| Param | Original file | Final file |
|---|---|---|
| Filename | modeM0/AS1A12_044T22_9000005750_42110cztM0_level2.fits | modeM0/AS1A12_044T22_9000005750_42110cztM0_level2_quad_clean.evt |
| Size (bytes) | 373,106,880 | 87,091,200 |
| Size | 355.8 MB | 83.1 MB |
| Events in quadrant A | 5,295,443 | 549,024 |
| Events in quadrant B | 2,455,511 | 617,413 |
| Events in quadrant C | 2,535,523 | 586,410 |
| Events in quadrant D | 3,128,995 | 527,840 |
| Mode M0 | |||
|---|---|---|---|
| Quadrant | BADHDUFLAG | Total packets | Discarded packets |
| A | 0 | 19147 | 2 |
| B | 0 | 10663 | 2 |
| C | 0 | 10549 | 2 |
| D | 0 | 12793 | 2 |
| Mode M9 | |||
|---|---|---|---|
| Quadrant | BADHDUFLAG | Total packets | Discarded packets |
| A | 0 | 35 | 0 |
| B | 0 | 36 | 0 |
| C | 0 | 36 | 0 |
| D | 0 | 36 | 0 |
| Mode SS | |||
|---|---|---|---|
| Quadrant | BADHDUFLAG | Total packets | Discarded packets |
| A | 0 | 104 | 0 |
| B | 0 | 104 | 0 |
| C | 0 | 104 | 0 |
| D | 0 | 104 | 0 |
| Quadrant | Total seconds | Saturated seconds | Saturation percentage |
|---|---|---|---|
| A | 5084 | 576 | 11.329662% |
| B | 5084 | 35 | 0.688434% |
| C | 5084 | 11 | 0.216365% |
| D | 5084 | 182 | 3.579858% |
Noise dominated data is calculated using 1-second bins in cleaned event files. If a bin has >2000 counts, and if more than 50% of those come from <1% of pixels, then it is considered to be noise-dominated and hence unusable.
| Quadrant | # 1 sec bins | Bins with >0 counts | Bins with >2000 counts | High rate bins dominated by noise | Noise dominated (total time) | Noise dominated (detector-on time) | Marked lightcurve |
|---|---|---|---|---|---|---|---|
| A | 6997 | 5085 | 433 | 433 | 6.19% | 8.52% | 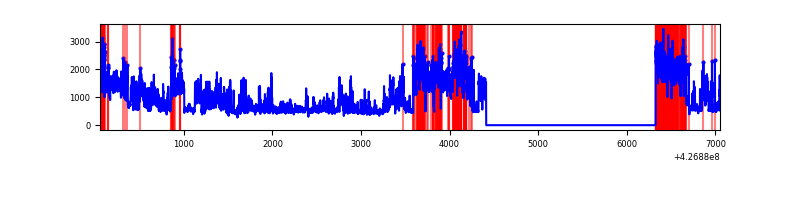 |
| B | 6997 | 5085 | 28 | 28 | 0.40% | 0.55% | 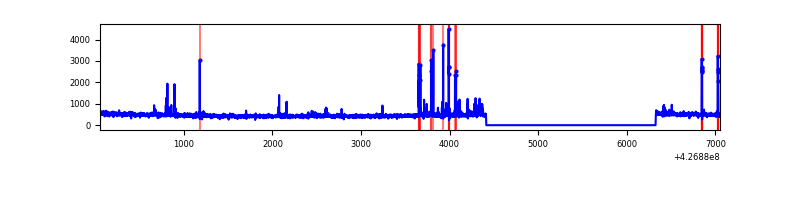 |
| C | 6997 | 5085 | 6 | 6 | 0.09% | 0.12% | 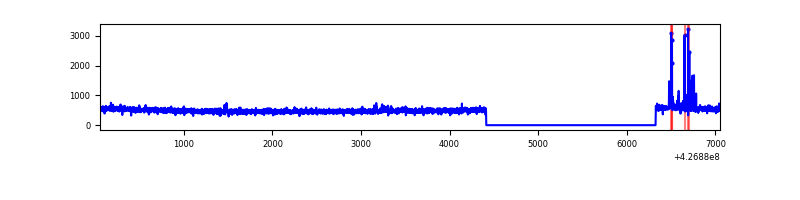 |
| D | 6997 | 5085 | 165 | 165 | 2.36% | 3.24% | 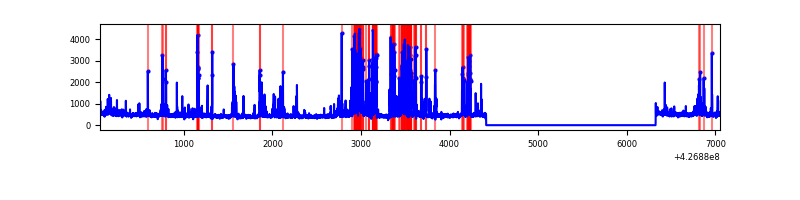 |
Top three noisy pixels from each quadrant. If the there are fewer than three noisy pixels in the level2.evt file, extra rows are filled as -1
| Pixel properties | Quadrant properties | ||||||
|---|---|---|---|---|---|---|---|
| Quadrant | DetID | PixID | Counts | Sigma | Mean | Median | Sigma |
| A | 15 | 222 | 2601368 | 22356.31 | 566 | 556 | 116.3 |
| A | 10 | 83 | 487424 | 4185.07 | 566 | 556 | 116.3 |
| A | 12 | 189 | 15011 | 124.25 | 566 | 556 | 116.3 |
| B | 5 | 255 | 152549 | 1343.34 | 582 | 566 | 113.1 |
| B | 12 | 111 | 14060 | 119.27 | 582 | 566 | 113.1 |
| B | 11 | 111 | 12961 | 109.56 | 582 | 566 | 113.1 |
| C | 15 | 214 | 223425 | 1652.35 | 576 | 579 | 134.9 |
| C | 8 | 79 | 51542 | 377.88 | 576 | 579 | 134.9 |
| C | 7 | 220 | 14505 | 103.26 | 576 | 579 | 134.9 |
| D | 12 | 6 | 614374 | 4449.32 | 565 | 549 | 138.0 |
| D | 13 | 249 | 167085 | 1207.14 | 565 | 549 | 138.0 |
| D | 10 | 199 | 69375 | 498.89 | 565 | 549 | 138.0 |
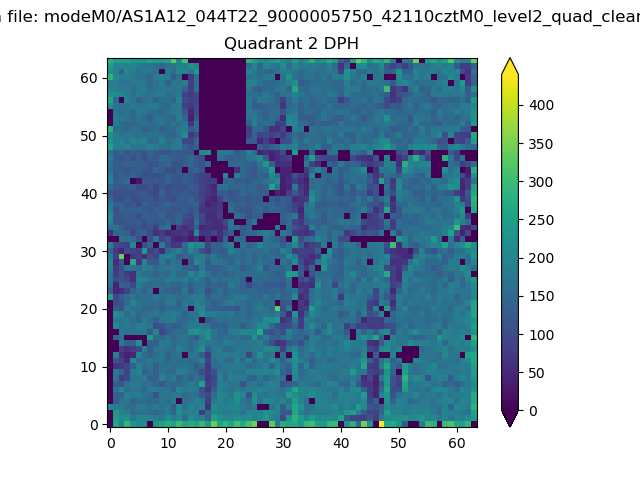
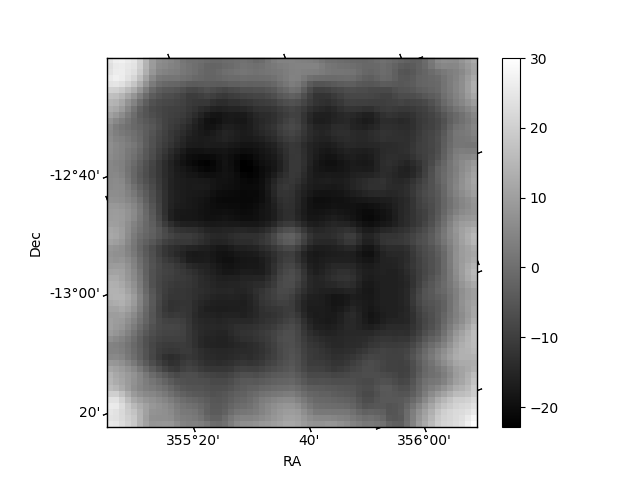
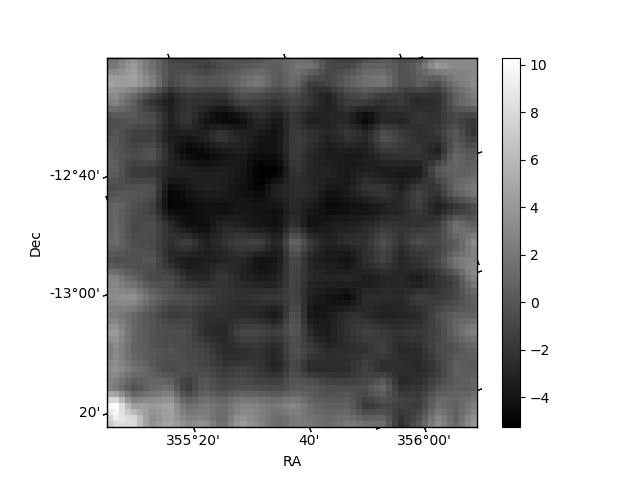
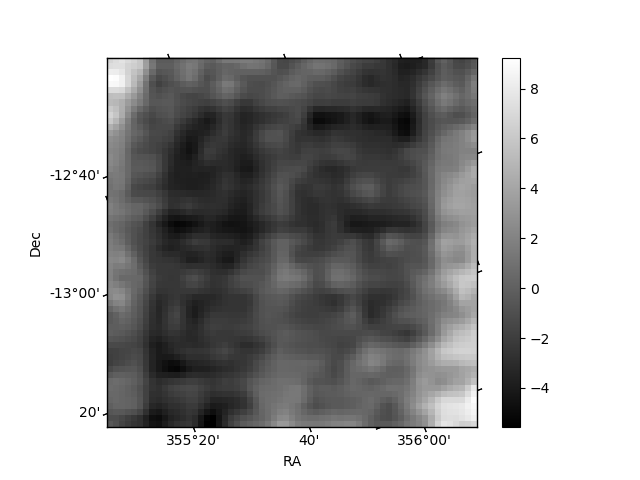
Histogram calculated using DETX and DETY for each event in the final _common_clean file
| Quadrant A | 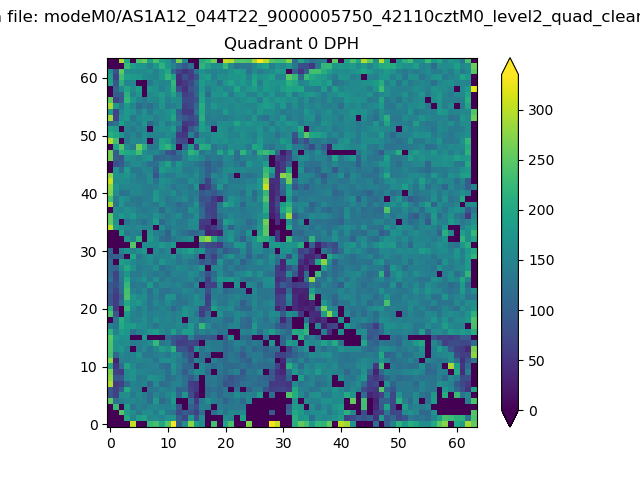 |
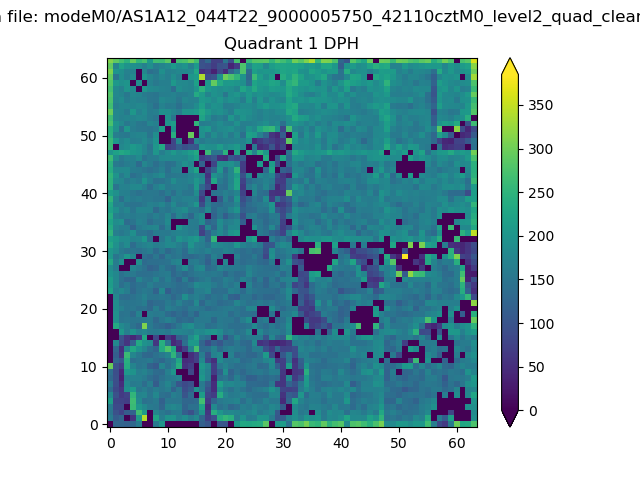 |
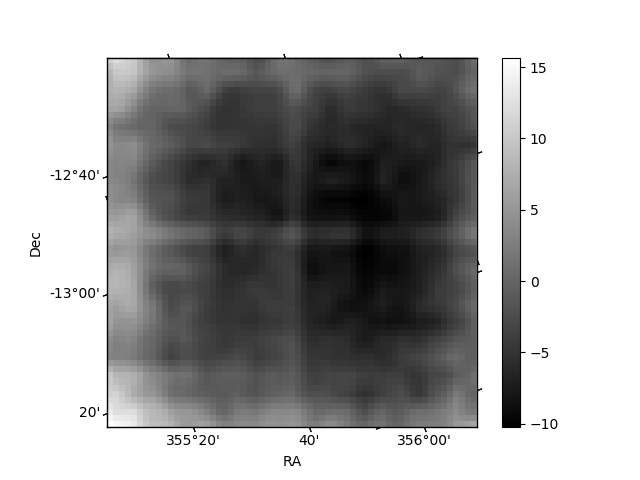
Quadrant B |
|---|---|---|---|
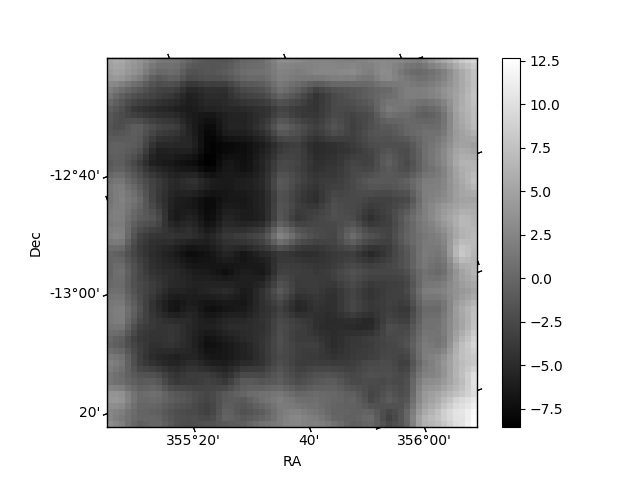
| Quadrant D | 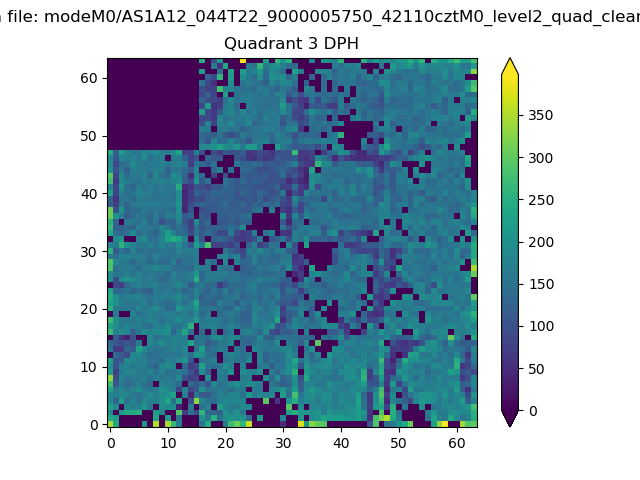 |
 |
Quadrant C |
| Plot type | Count rate plots | Images |
|---|---|---|
| Comparison with Poisson distribution Blue bars denote a histogram of data divided into 1 sec bins. Red curve is a Poisson curve with rate = median count rate of data. |
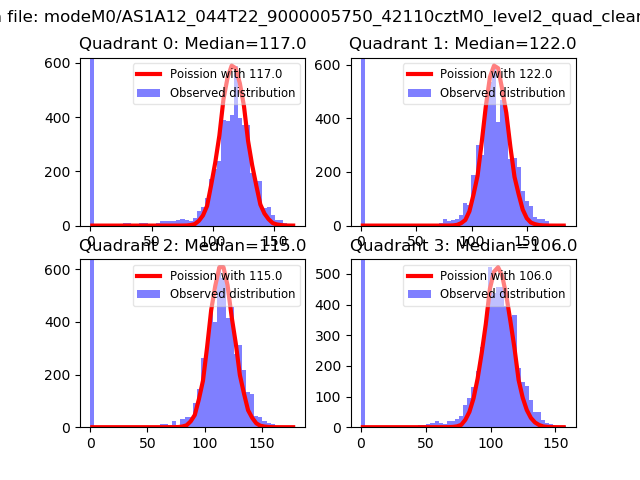 |
 |
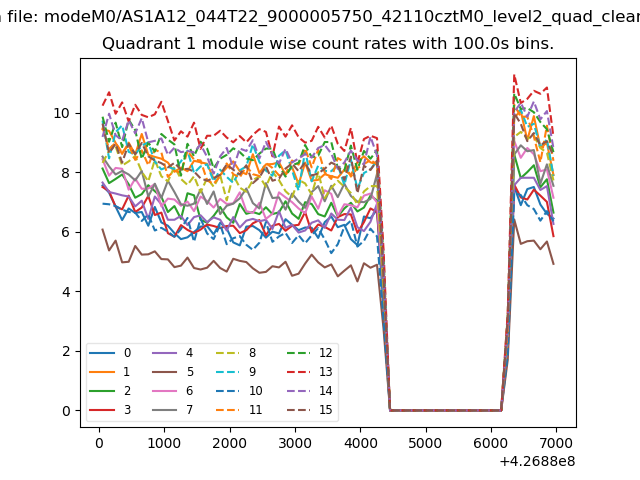
| Quadrant-wise count rates Data is divided into 100 sec bins |
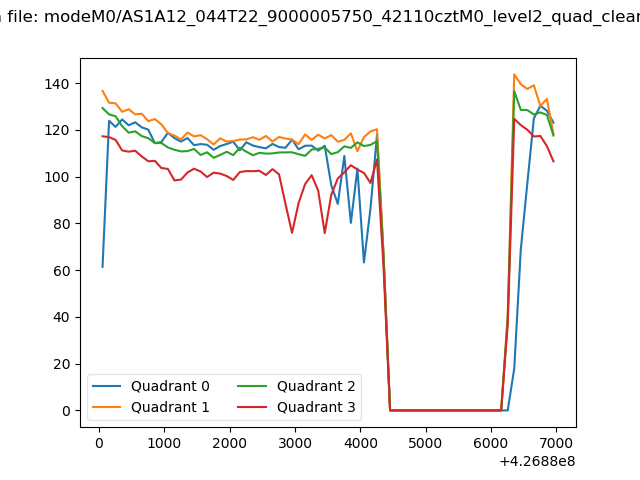 |
|
| Module-wise count rates for Quadrant A Data is divided into 100 sec bins |
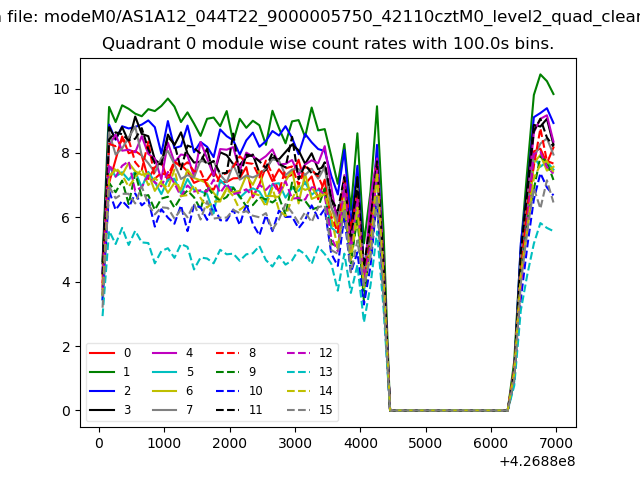 |
 |
| Module-wise count rates for Quadrant B Data is divided into 100 sec bins |
 |
 |
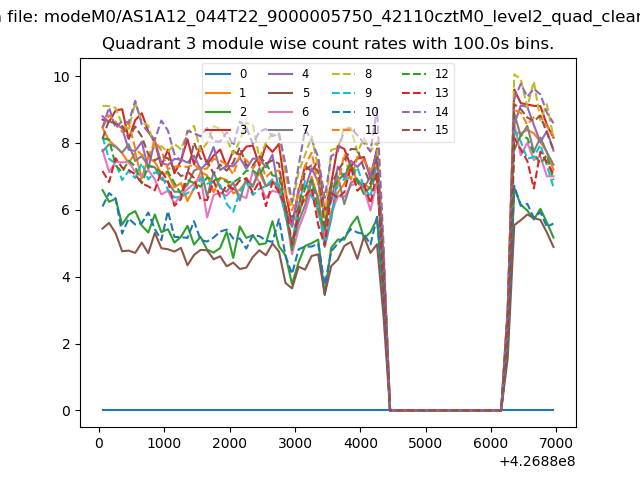
| Module-wise count rates for Quadrant C Data is divided into 100 sec bins |
 |
 |
| Module-wise count rates for Quadrant D Data is divided into 100 sec bins |
 |
 |
| Parameter | Plot |
|---|---|
| CZT HV Monitor | 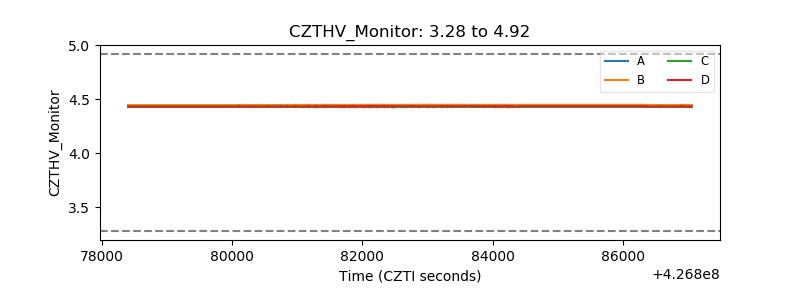 |
| D_VDD | 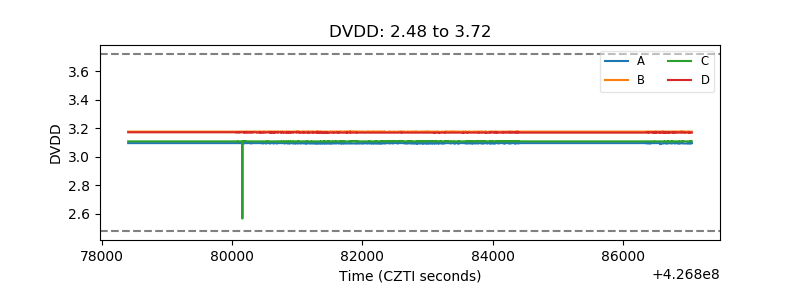 |
| Temperature 1 | 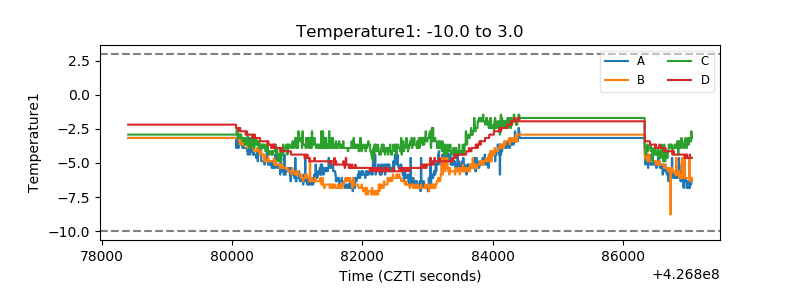 |
| Veto HV Monitor | 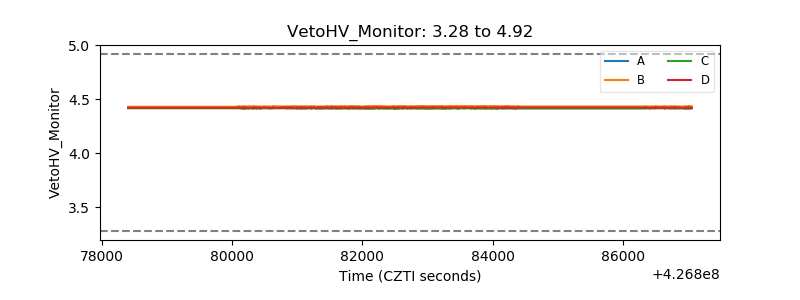 |
| Veto LLD |  |
| Alpha Counter | 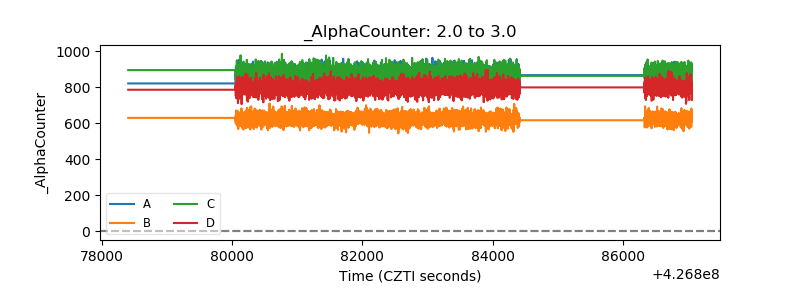 |
| _CPM_Rate | 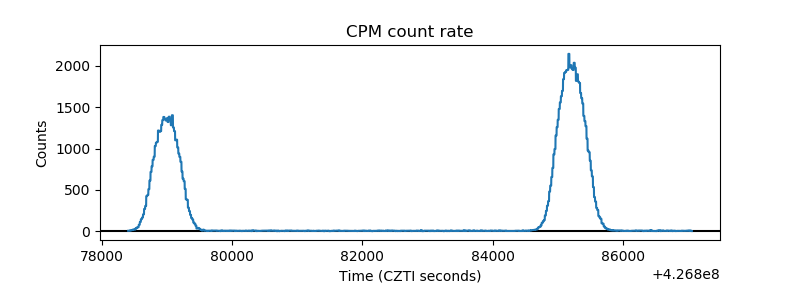 |
| CZT Counter | 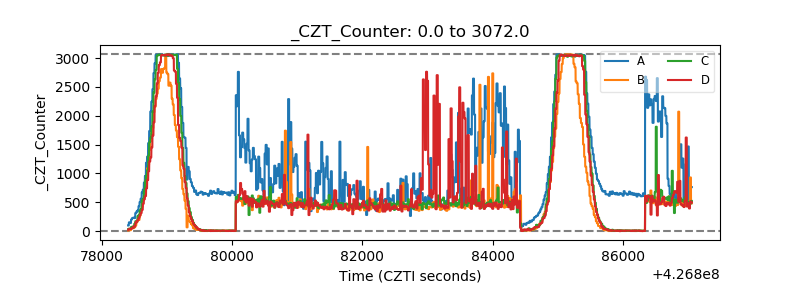 |
| +2.5 Volts monitor | 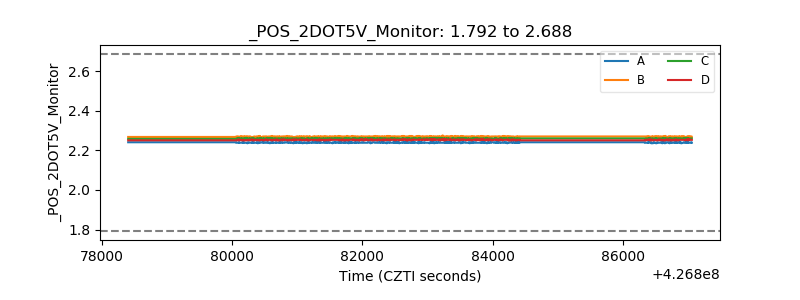 |
| +5 Volts monitor | 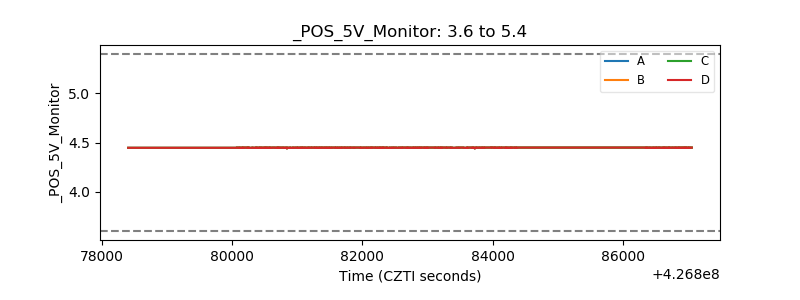 |
| _ROLL_ROT | 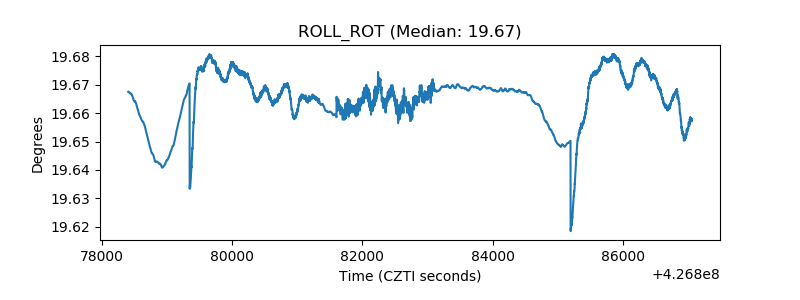 |
| _Roll_DEC | 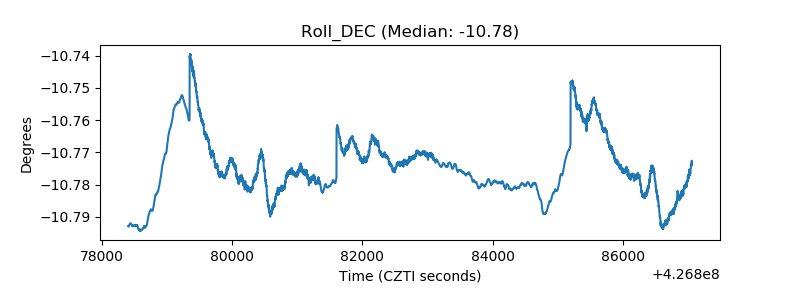 |
| _Roll_RA |  |
| Veto Counter | 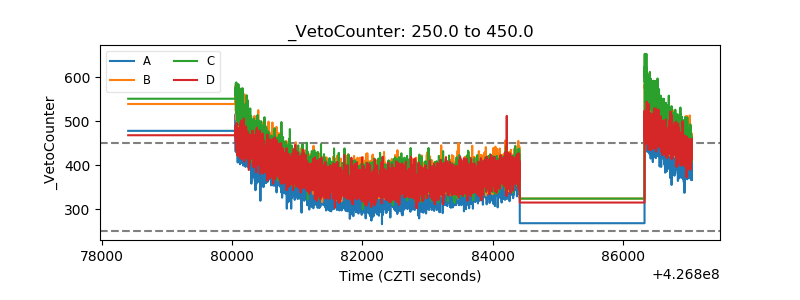 |