| Param | Original file | Final file |
|---|---|---|
| Filename | modeM0/AS1A12_044T22_9000005750_42111cztM0_level2.fits | modeM0/AS1A12_044T22_9000005750_42111cztM0_level2_quad_clean.evt |
| Size (bytes) | 368,409,600 | 89,953,920 |
| Size | 351.3 MB | 85.8 MB |
| Events in quadrant A | 5,090,204 | 581,583 |
| Events in quadrant B | 2,376,270 | 637,911 |
| Events in quadrant C | 2,586,523 | 606,381 |
| Events in quadrant D | 3,190,307 | 543,485 |
| Mode M0 | |||
|---|---|---|---|
| Quadrant | BADHDUFLAG | Total packets | Discarded packets |
| A | 0 | 18652 | 2 |
| B | 0 | 10350 | 2 |
| C | 0 | 10551 | 2 |
| D | 0 | 12903 | 2 |
| Mode M9 | |||
|---|---|---|---|
| Quadrant | BADHDUFLAG | Total packets | Discarded packets |
| A | 0 | 33 | 0 |
| B | 0 | 34 | 0 |
| C | 0 | 34 | 0 |
| D | 0 | 34 | 0 |
| Mode SS | |||
|---|---|---|---|
| Quadrant | BADHDUFLAG | Total packets | Discarded packets |
| A | 0 | 102 | 0 |
| B | 0 | 102 | 0 |
| C | 0 | 102 | 0 |
| D | 0 | 102 | 0 |
| Quadrant | Total seconds | Saturated seconds | Saturation percentage |
|---|---|---|---|
| A | 5064 | 352 | 6.951027% |
| B | 5064 | 27 | 0.533175% |
| C | 5064 | 13 | 0.256714% |
| D | 5064 | 189 | 3.732227% |
Noise dominated data is calculated using 1-second bins in cleaned event files. If a bin has >2000 counts, and if more than 50% of those come from <1% of pixels, then it is considered to be noise-dominated and hence unusable.
| Quadrant | # 1 sec bins | Bins with >0 counts | Bins with >2000 counts | High rate bins dominated by noise | Noise dominated (total time) | Noise dominated (detector-on time) | Marked lightcurve |
|---|---|---|---|---|---|---|---|
| A | 7067 | 5065 | 279 | 279 | 3.95% | 5.51% | 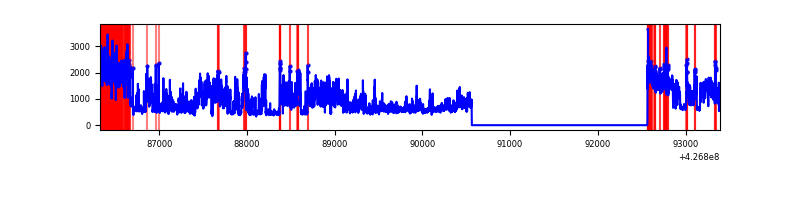 |
| B | 7067 | 5065 | 13 | 13 | 0.18% | 0.26% | 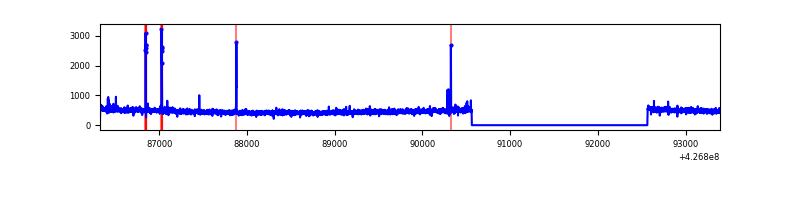 |
| C | 7067 | 5065 | 6 | 6 | 0.08% | 0.12% | 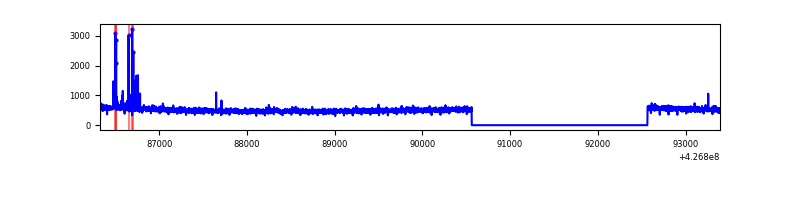 |
| D | 7067 | 5065 | 167 | 167 | 2.36% | 3.30% | 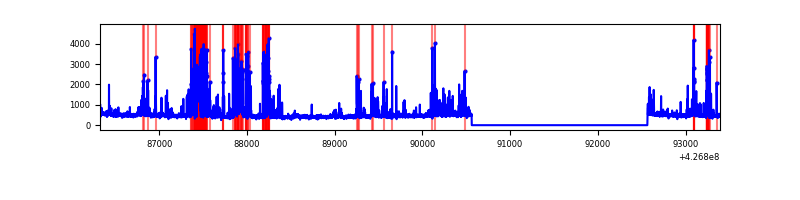 |
Top three noisy pixels from each quadrant. If the there are fewer than three noisy pixels in the level2.evt file, extra rows are filled as -1
| Pixel properties | Quadrant properties | ||||||
|---|---|---|---|---|---|---|---|
| Quadrant | DetID | PixID | Counts | Sigma | Mean | Median | Sigma |
| A | 15 | 222 | 2362272 | 20049.93 | 578 | 566 | 117.8 |
| A | 10 | 83 | 483447 | 4099.46 | 578 | 566 | 117.8 |
| A | 13 | 6 | 8138 | 64.28 | 578 | 566 | 117.8 |
| B | 5 | 255 | 44093 | 381.34 | 588 | 572 | 114.1 |
| B | 0 | 229 | 18170 | 154.2 | 588 | 572 | 114.1 |
| B | 12 | 111 | 14097 | 118.51 | 588 | 572 | 114.1 |
| C | 15 | 214 | 227943 | 1644.51 | 587 | 592 | 138.2 |
| C | 8 | 79 | 68839 | 493.65 | 587 | 592 | 138.2 |
| C | 13 | 61 | 3888 | 23.84 | 587 | 592 | 138.2 |
| D | 12 | 6 | 575572 | 4101.74 | 571 | 556 | 140.2 |
| D | 13 | 249 | 241929 | 1721.78 | 571 | 556 | 140.2 |
| D | 1 | 52 | 74620 | 528.32 | 571 | 556 | 140.2 |
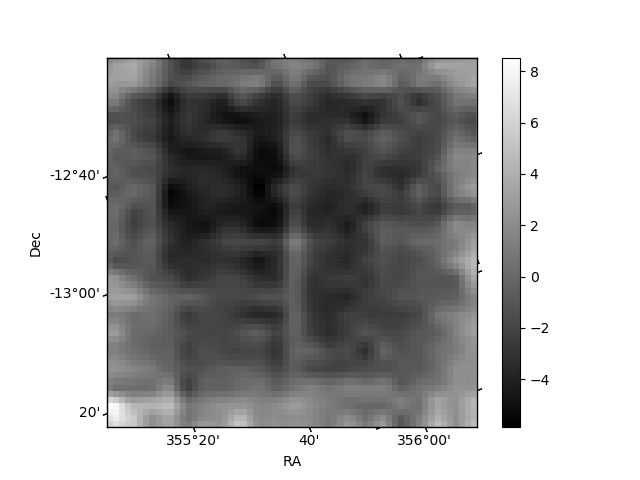
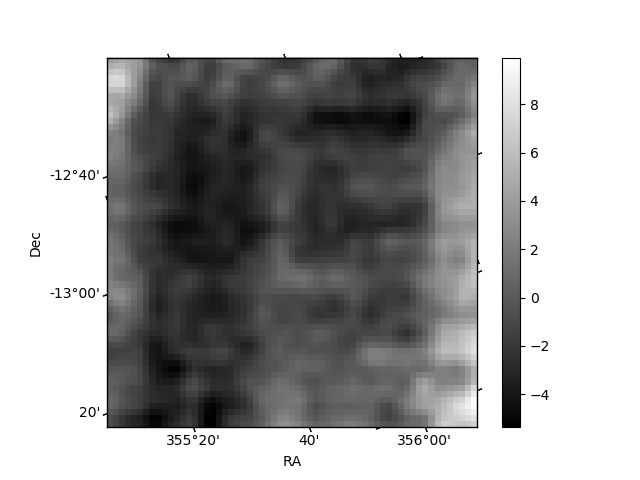
Histogram calculated using DETX and DETY for each event in the final _common_clean file
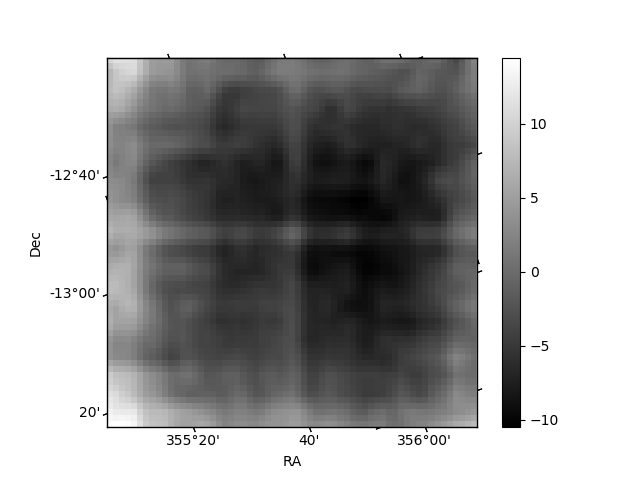
| Quadrant A | 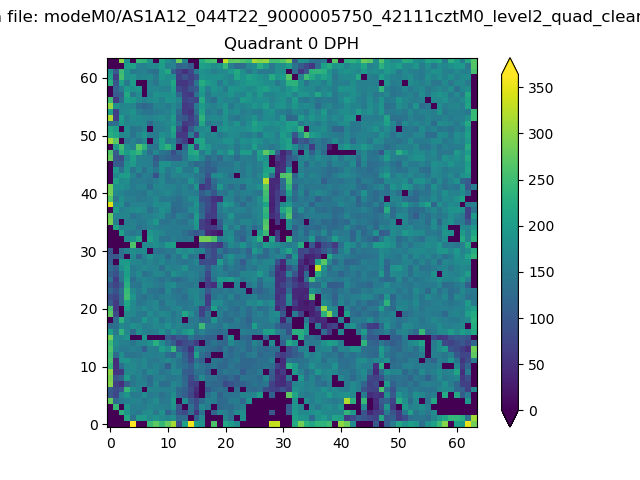 |
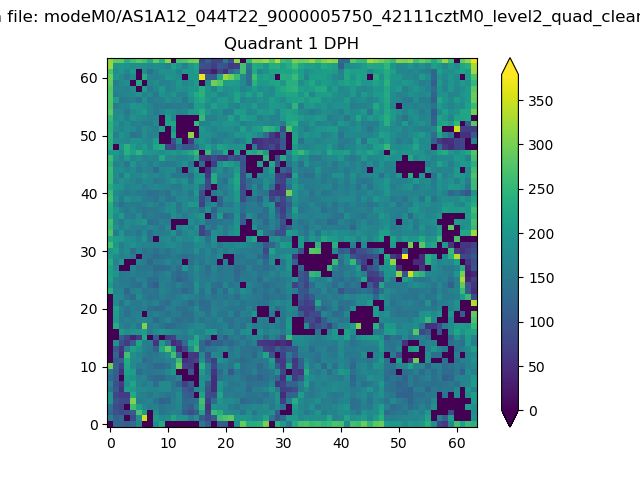 |
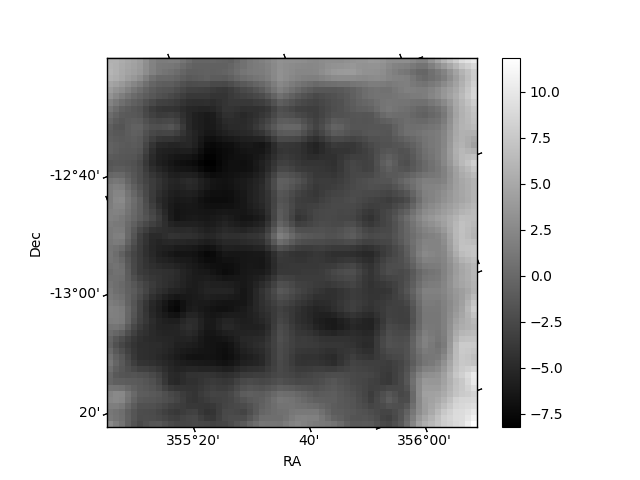
Quadrant B |
|---|---|---|---|
| Quadrant D | 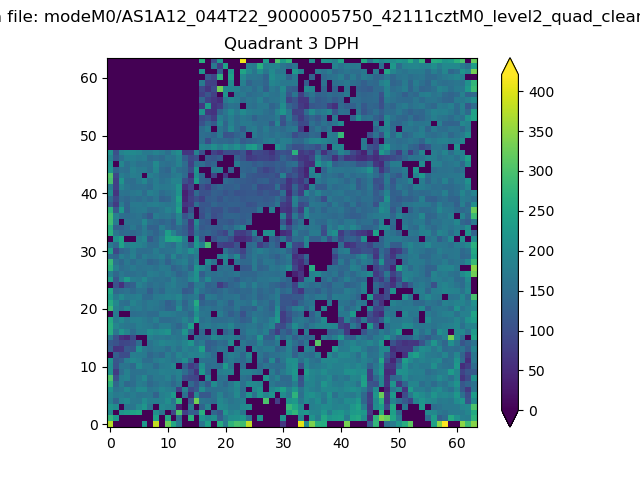 |
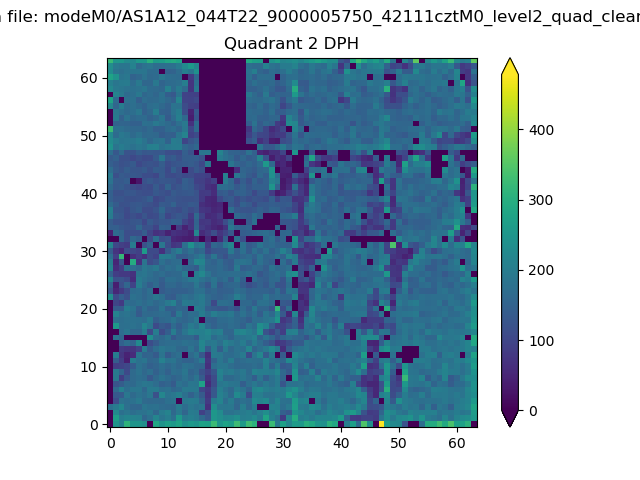 |
Quadrant C |
| Plot type | Count rate plots | Images |
|---|---|---|
| Comparison with Poisson distribution Blue bars denote a histogram of data divided into 1 sec bins. Red curve is a Poisson curve with rate = median count rate of data. |
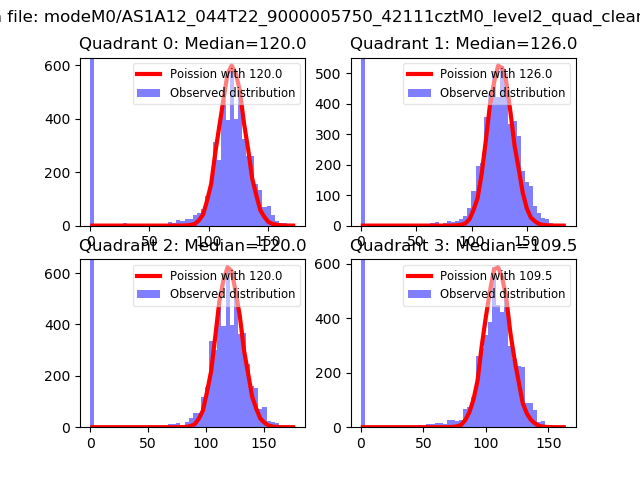 |
 |
| Quadrant-wise count rates Data is divided into 100 sec bins |
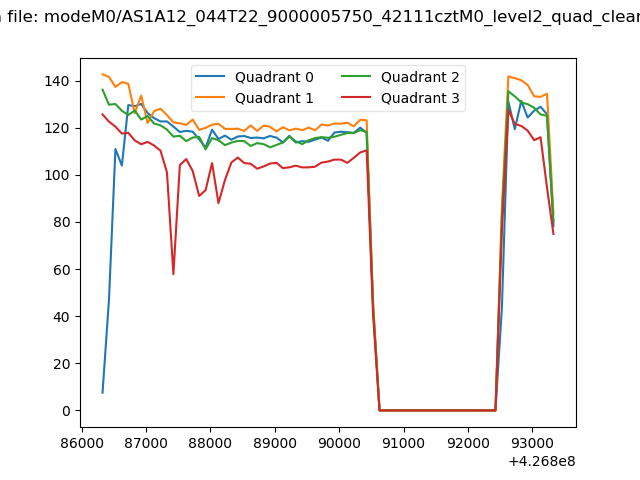 |
|
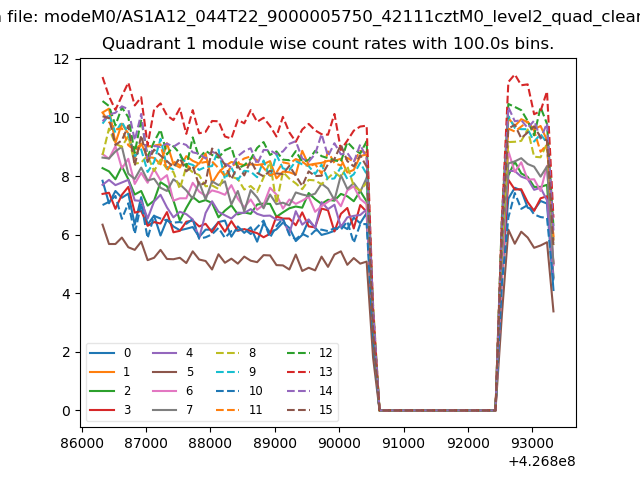
| Module-wise count rates for Quadrant A Data is divided into 100 sec bins |
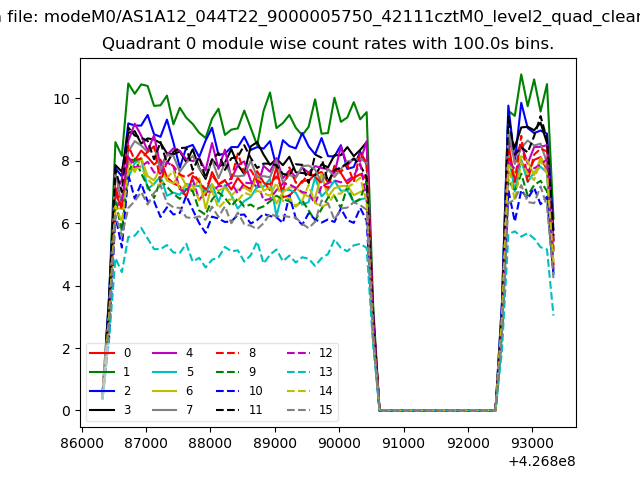 |
 |
| Module-wise count rates for Quadrant B Data is divided into 100 sec bins |
 |
 |
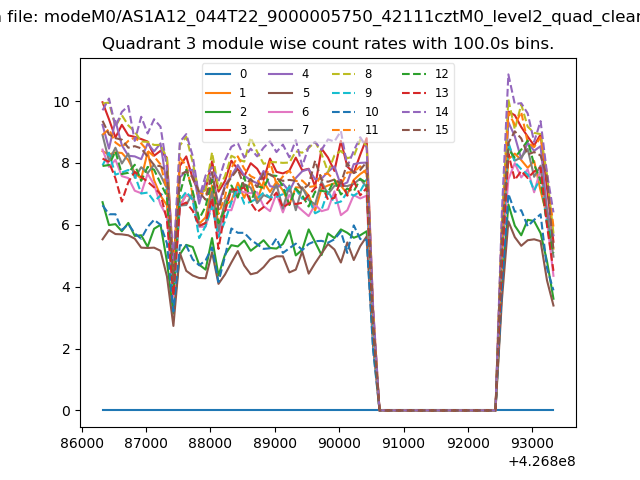
| Module-wise count rates for Quadrant C Data is divided into 100 sec bins |
 |
 |
| Module-wise count rates for Quadrant D Data is divided into 100 sec bins |
 |
 |
| Parameter | Plot |
|---|---|
| CZT HV Monitor | 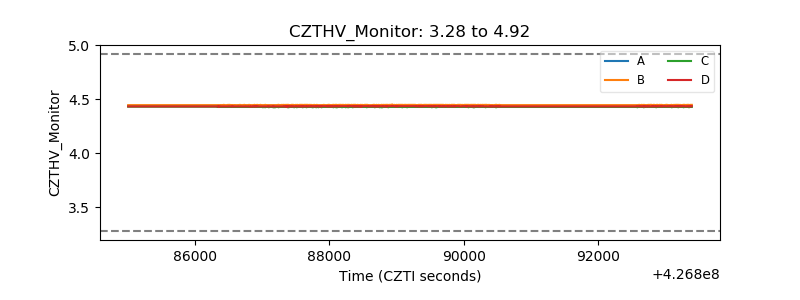 |
| D_VDD | 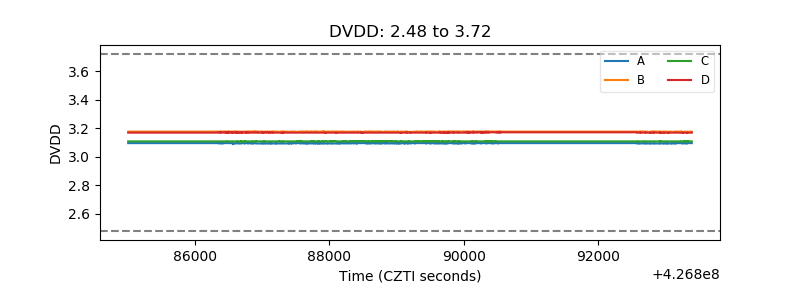 |
| Temperature 1 | 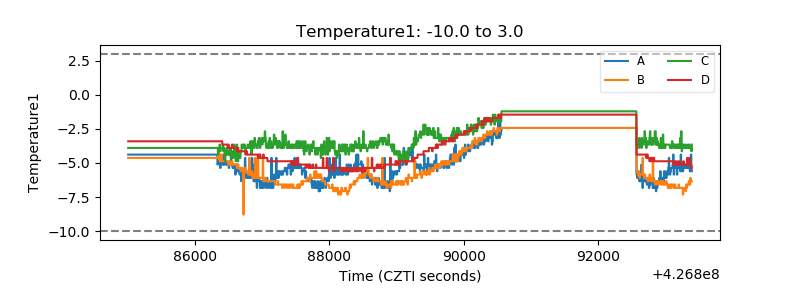 |
| Veto HV Monitor | 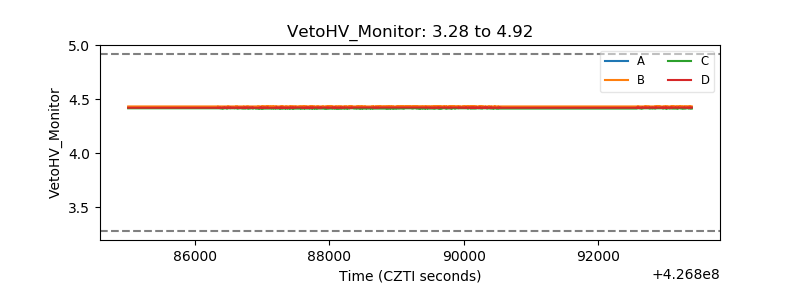 |
| Veto LLD | 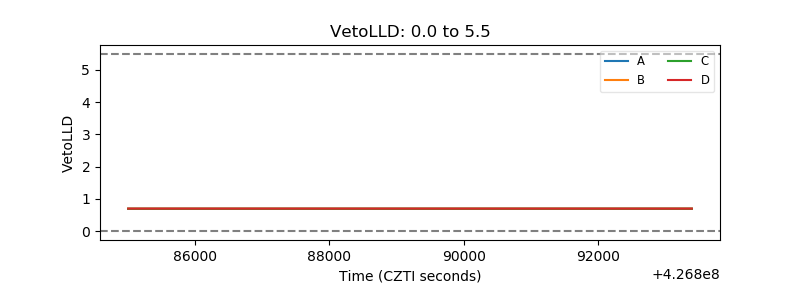 |
| Alpha Counter | 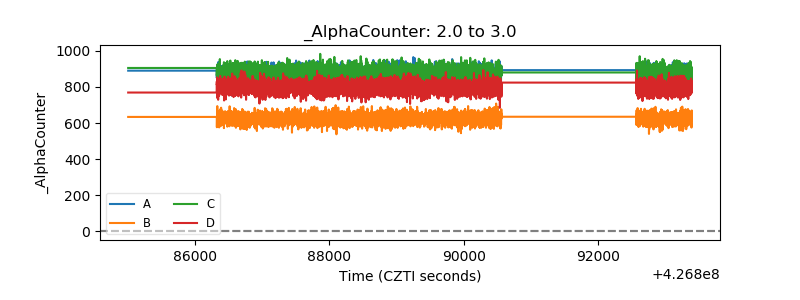 |
| _CPM_Rate | 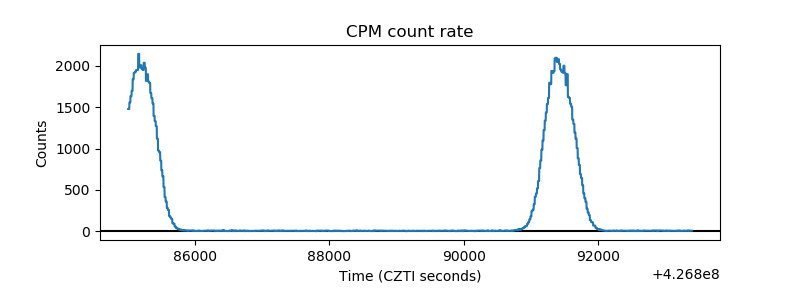 |
| CZT Counter | 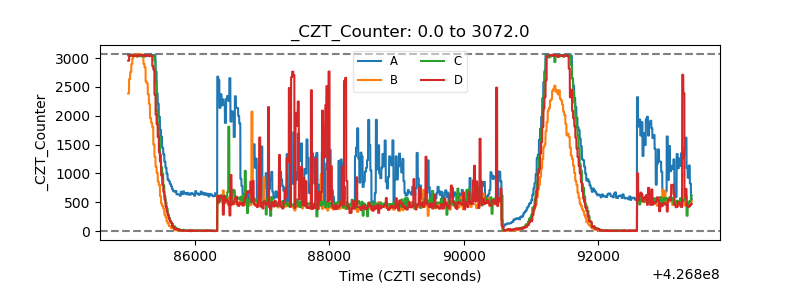 |
| +2.5 Volts monitor |  |
| +5 Volts monitor | 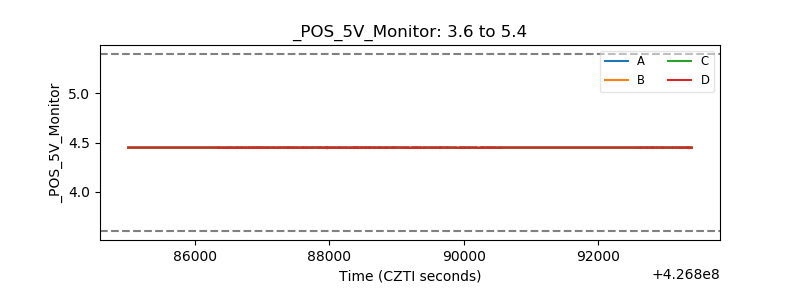 |
| _ROLL_ROT | 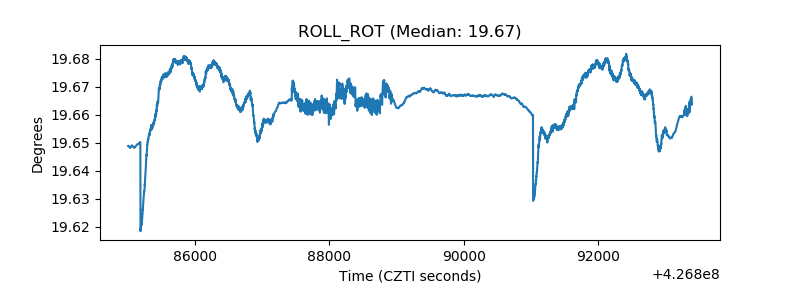 |
| _Roll_DEC |  |
| _Roll_RA |  |
| Veto Counter | 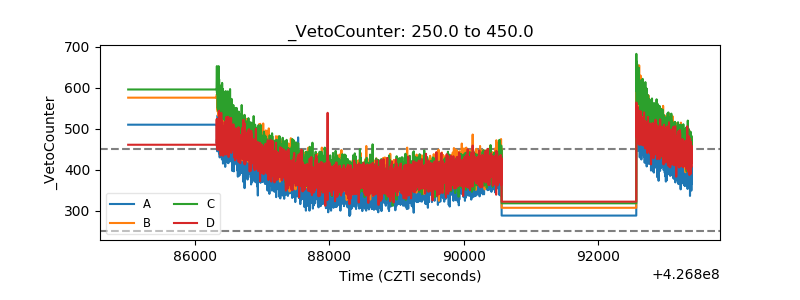 |