| Param | Original file | Final file |
|---|---|---|
| Filename | modeM0/AS1A12_044T22_9000005750_42112cztM0_level2.fits | modeM0/AS1A12_044T22_9000005750_42112cztM0_level2_quad_clean.evt |
| Size (bytes) | 380,655,360 | 85,150,080 |
| Size | 363.0 MB | 81.2 MB |
| Events in quadrant A | 5,447,488 | 538,796 |
| Events in quadrant B | 2,217,807 | 611,550 |
| Events in quadrant C | 2,497,692 | 580,575 |
| Events in quadrant D | 3,550,346 | 506,945 |
| Mode M0 | |||
|---|---|---|---|
| Quadrant | BADHDUFLAG | Total packets | Discarded packets |
| A | 0 | 19565 | 2 |
| B | 0 | 9759 | 2 |
| C | 0 | 10191 | 3 |
| D | 0 | 13806 | 2 |
| Mode M9 | |||
|---|---|---|---|
| Quadrant | BADHDUFLAG | Total packets | Discarded packets |
| A | 0 | 29 | 0 |
| B | 0 | 30 | 0 |
| C | 0 | 30 | 0 |
| D | 0 | 30 | 0 |
| Mode SS | |||
|---|---|---|---|
| Quadrant | BADHDUFLAG | Total packets | Discarded packets |
| A | 0 | 100 | 0 |
| B | 0 | 100 | 0 |
| C | 0 | 100 | 0 |
| D | 0 | 100 | 0 |
| Quadrant | Total seconds | Saturated seconds | Saturation percentage |
|---|---|---|---|
| A | 4852 | 483 | 9.954658% |
| B | 4852 | 8 | 0.164880% |
| C | 4851 | 34 | 0.700886% |
| D | 4851 | 320 | 6.596578% |
Noise dominated data is calculated using 1-second bins in cleaned event files. If a bin has >2000 counts, and if more than 50% of those come from <1% of pixels, then it is considered to be noise-dominated and hence unusable.
| Quadrant | # 1 sec bins | Bins with >0 counts | Bins with >2000 counts | High rate bins dominated by noise | Noise dominated (total time) | Noise dominated (detector-on time) | Marked lightcurve |
|---|---|---|---|---|---|---|---|
| A | 6945 | 4853 | 469 | 469 | 6.75% | 9.66% | 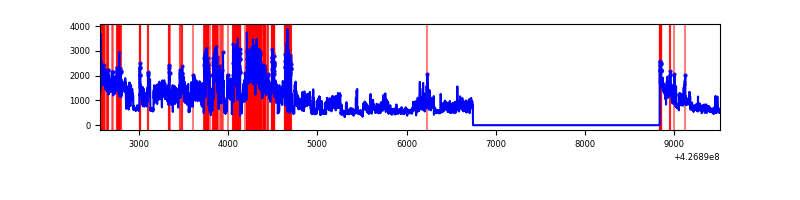 |
| B | 6945 | 4853 | 0 | 0 | 0.00% | 0.00% | 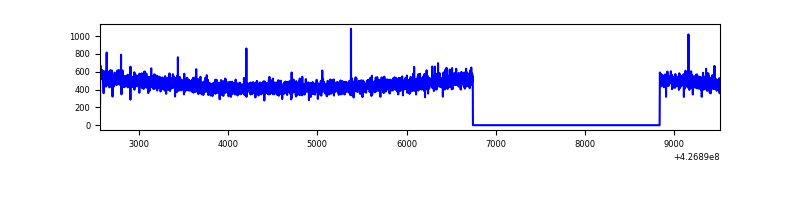 |
| C | 6944 | 4852 | 27 | 27 | 0.39% | 0.56% | 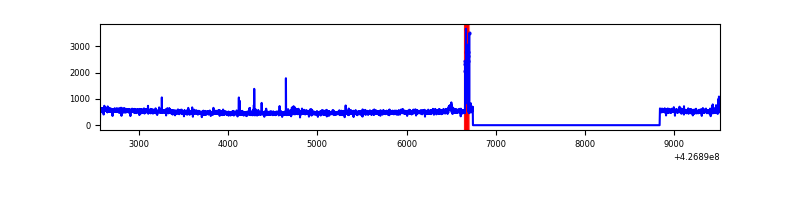 |
| D | 6944 | 4852 | 314 | 314 | 4.52% | 6.47% | 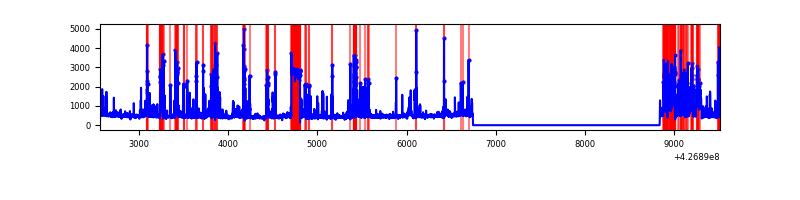 |
Top three noisy pixels from each quadrant. If the there are fewer than three noisy pixels in the level2.evt file, extra rows are filled as -1
| Pixel properties | Quadrant properties | ||||||
|---|---|---|---|---|---|---|---|
| Quadrant | DetID | PixID | Counts | Sigma | Mean | Median | Sigma |
| A | 15 | 222 | 2849643 | 25533.52 | 546 | 536 | 111.6 |
| A | 10 | 83 | 476950 | 4269.59 | 546 | 536 | 111.6 |
| A | 13 | 6 | 9868 | 83.63 | 546 | 536 | 111.6 |
| B | 12 | 111 | 13458 | 118.84 | 562 | 546 | 108.7 |
| B | 11 | 111 | 12531 | 110.3 | 562 | 546 | 108.7 |
| B | 14 | 111 | 12285 | 108.04 | 562 | 546 | 108.7 |
| C | 15 | 214 | 215271 | 1646.08 | 557 | 563 | 130.4 |
| C | 8 | 79 | 80108 | 609.84 | 557 | 563 | 130.4 |
| C | 10 | 223 | 15218 | 112.35 | 557 | 563 | 130.4 |
| D | 12 | 6 | 514116 | 3898.57 | 537 | 523 | 131.7 |
| D | 13 | 249 | 457653 | 3469.97 | 537 | 523 | 131.7 |
| D | 10 | 204 | 303477 | 2299.66 | 537 | 523 | 131.7 |
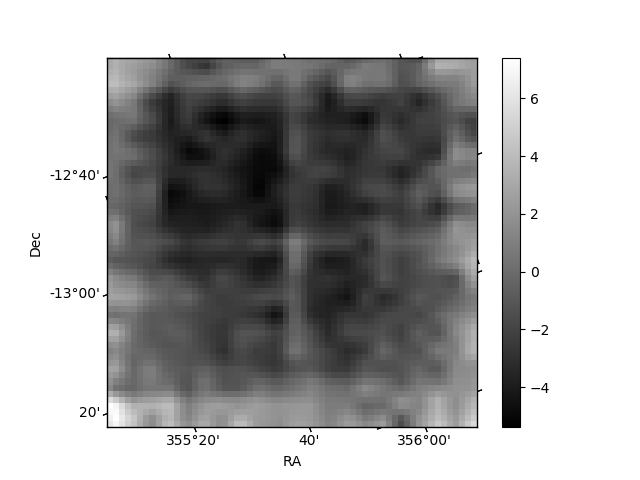
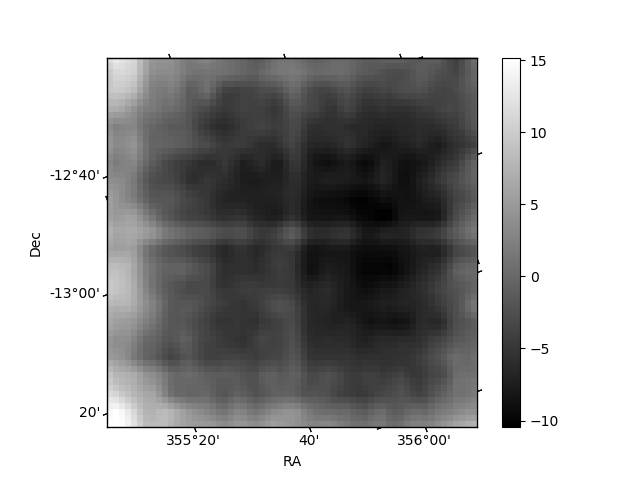
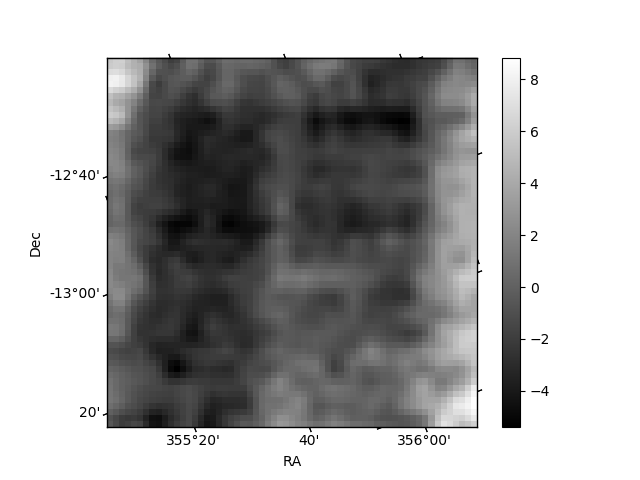
Histogram calculated using DETX and DETY for each event in the final _common_clean file
| Quadrant A | 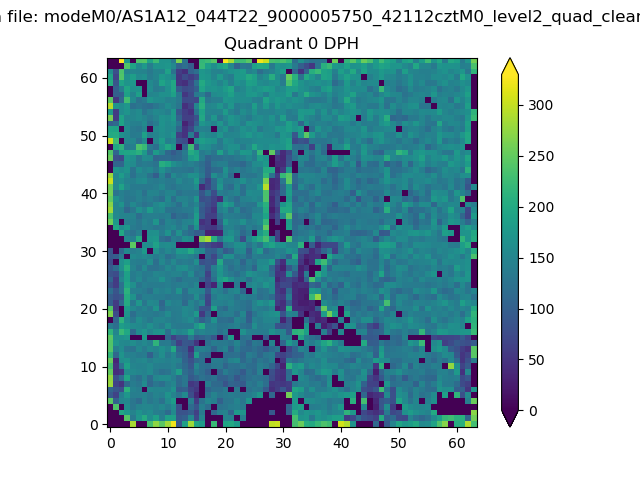 |
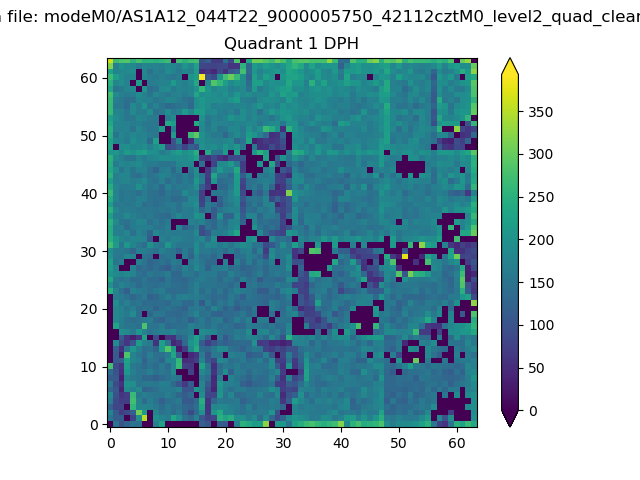 |
Quadrant B |
|---|---|---|---|
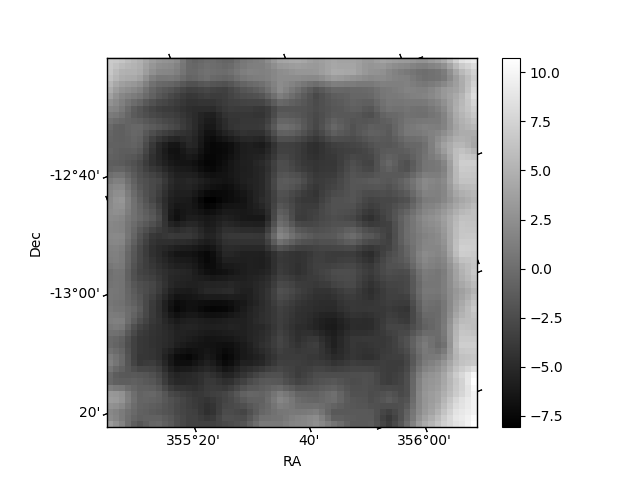
| Quadrant D | 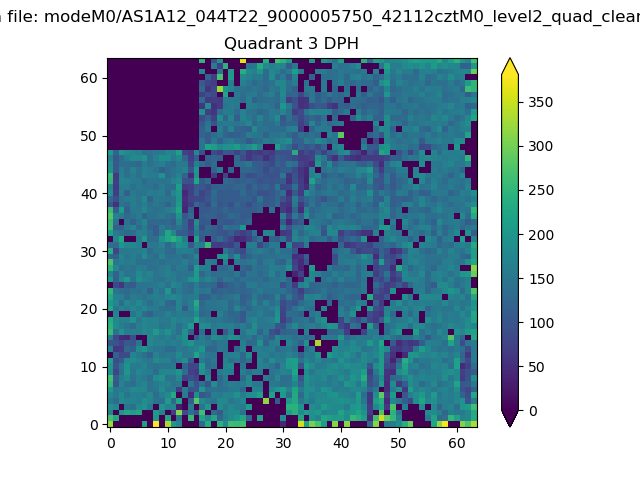 |
 |
Quadrant C |
| Plot type | Count rate plots | Images |
|---|---|---|
| Comparison with Poisson distribution Blue bars denote a histogram of data divided into 1 sec bins. Red curve is a Poisson curve with rate = median count rate of data. |
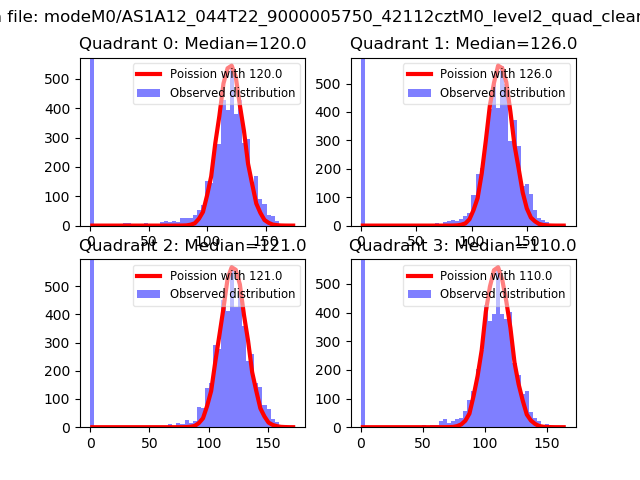 |
 |
| Quadrant-wise count rates Data is divided into 100 sec bins |
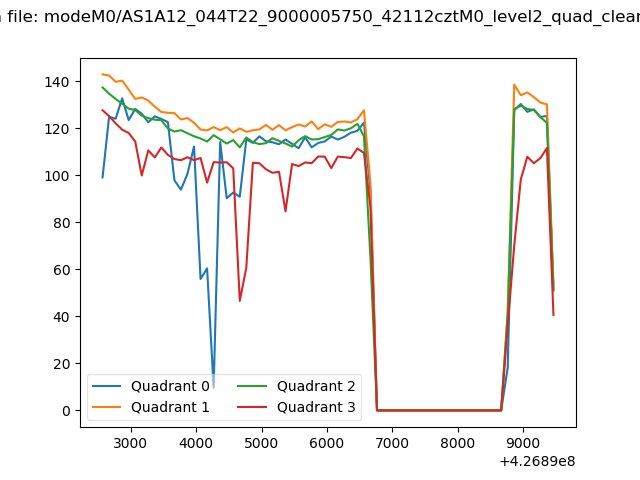 |
|
| Module-wise count rates for Quadrant A Data is divided into 100 sec bins |
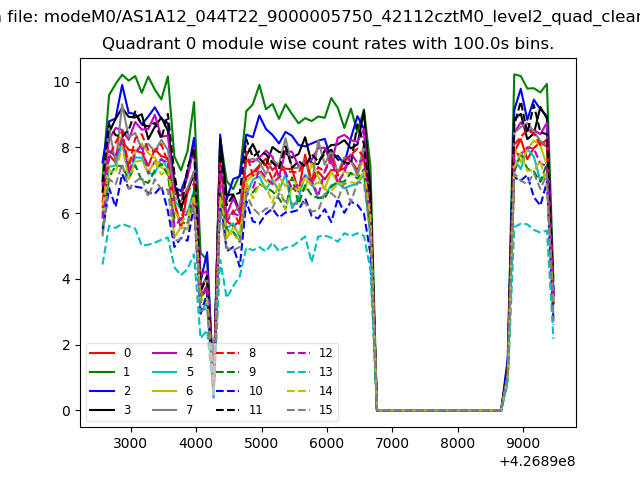 |
 |
| Module-wise count rates for Quadrant B Data is divided into 100 sec bins |
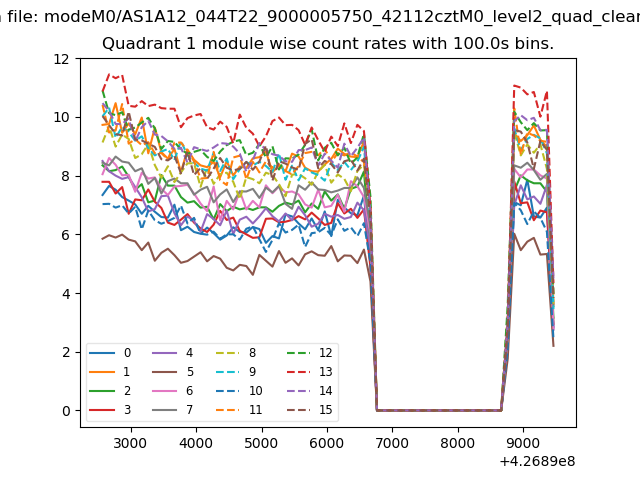 |
 |
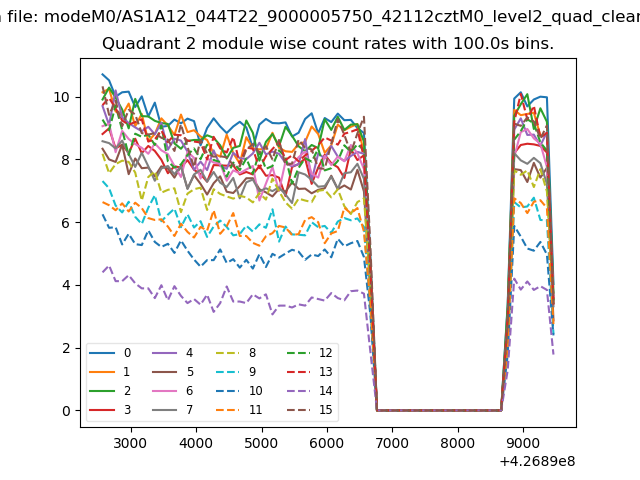
| Module-wise count rates for Quadrant C Data is divided into 100 sec bins |
 |
 |
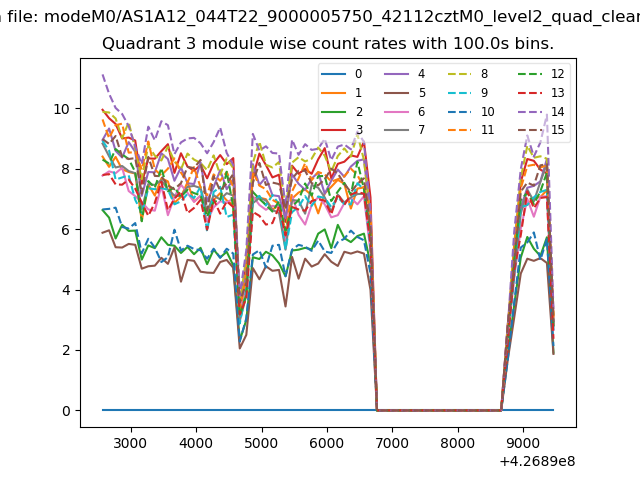
| Module-wise count rates for Quadrant D Data is divided into 100 sec bins |
 |
 |
| Parameter | Plot |
|---|---|
| CZT HV Monitor | 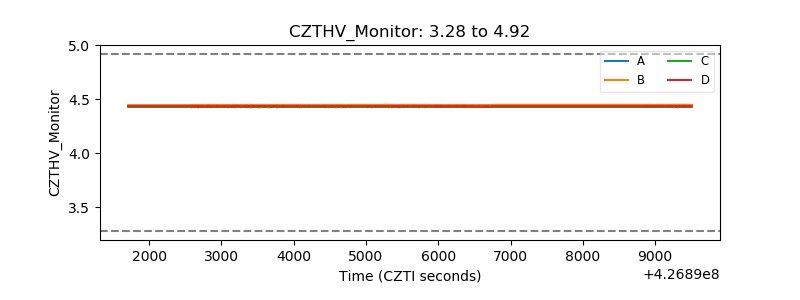 |
| D_VDD | 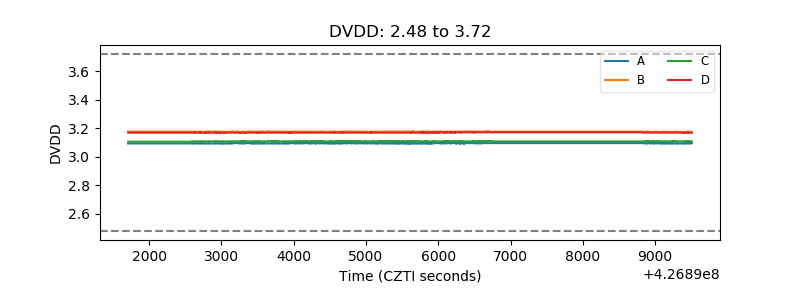 |
| Temperature 1 | 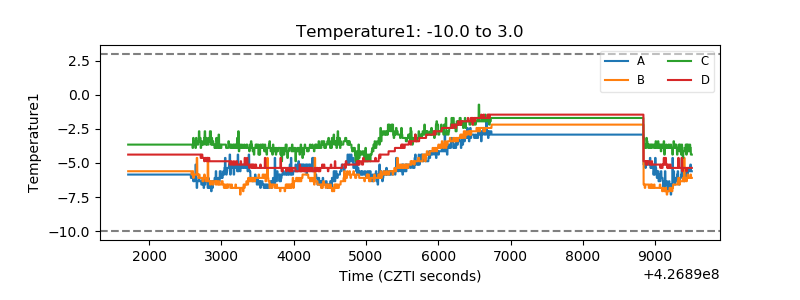 |
| Veto HV Monitor | 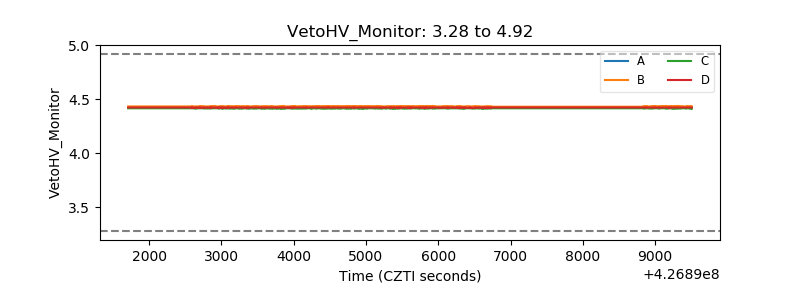 |
| Veto LLD | 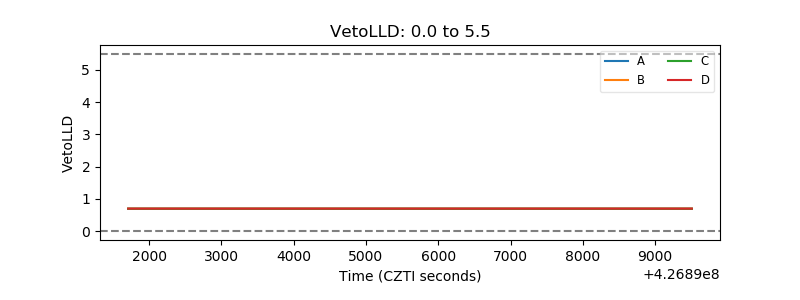 |
| Alpha Counter | 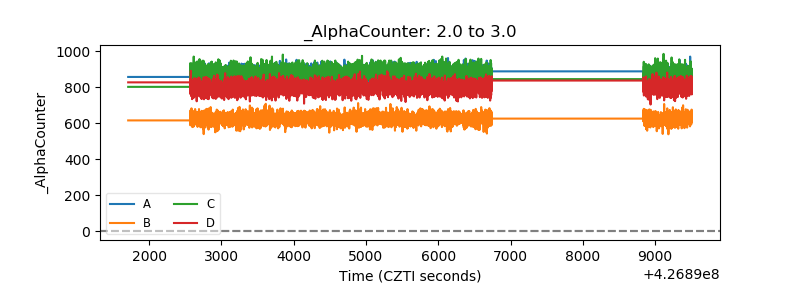 |
| _CPM_Rate | 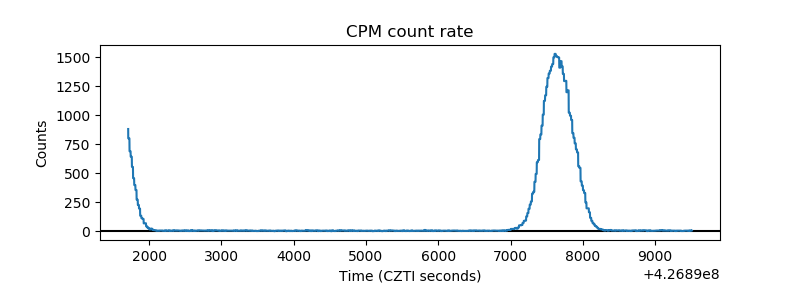 |
| CZT Counter | 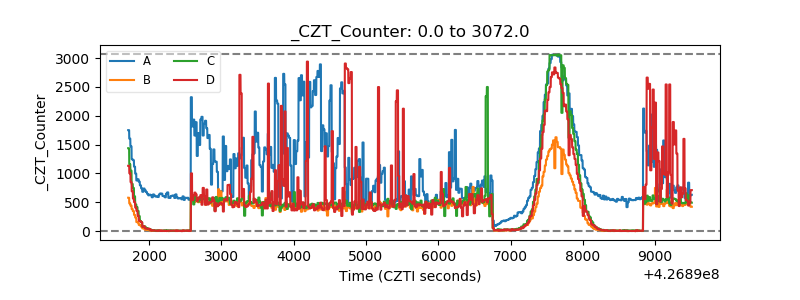 |
| +2.5 Volts monitor | 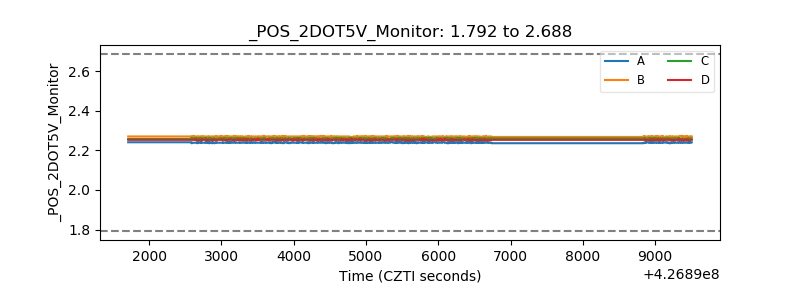 |
| +5 Volts monitor | 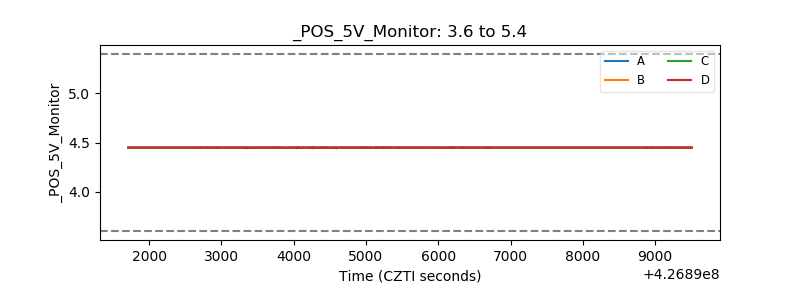 |
| _ROLL_ROT | 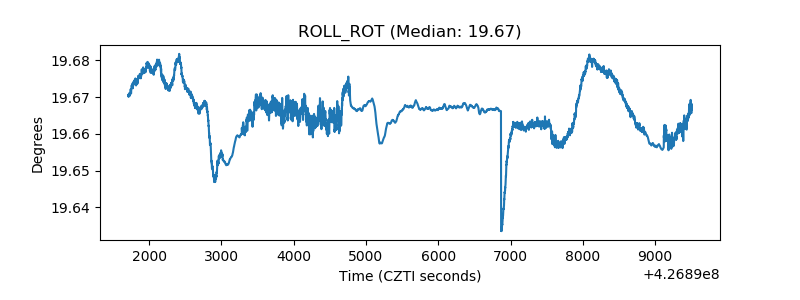 |
| _Roll_DEC | 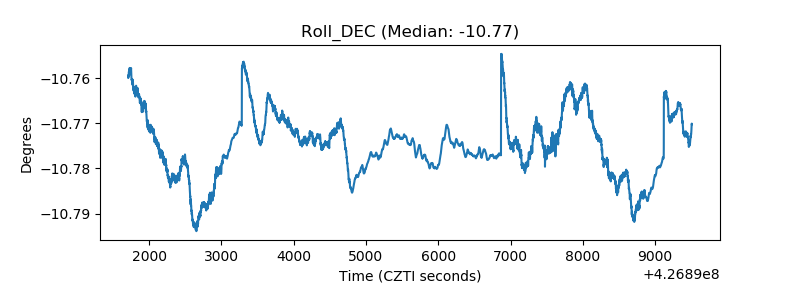 |
| _Roll_RA | 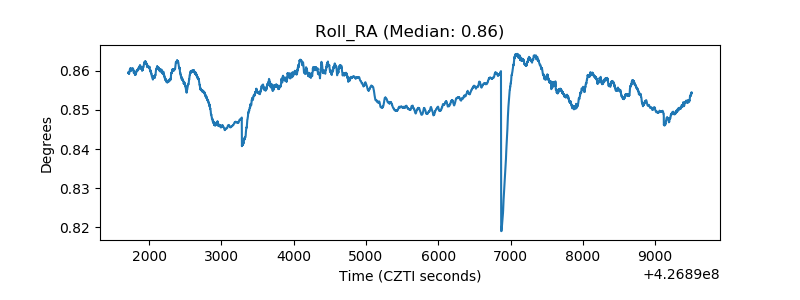 |
| Veto Counter | 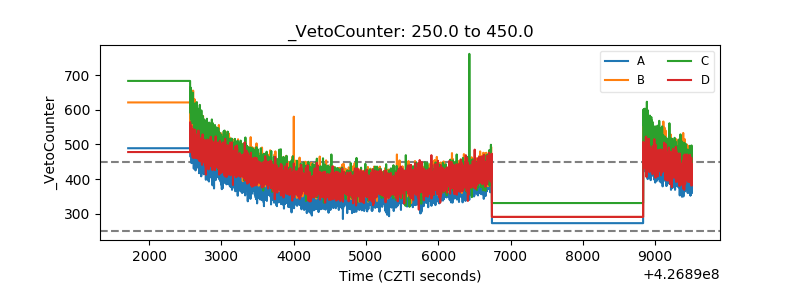 |