| Param | Original file | Final file |
|---|---|---|
| Filename | modeM0/AS1A12_044T22_9000005750_42113cztM0_level2.fits | modeM0/AS1A12_044T22_9000005750_42113cztM0_level2_quad_clean.evt |
| Size (bytes) | 404,501,760 | 90,037,440 |
| Size | 385.8 MB | 85.9 MB |
| Events in quadrant A | 5,257,597 | 574,369 |
| Events in quadrant B | 2,383,699 | 645,830 |
| Events in quadrant C | 2,810,282 | 612,845 |
| Events in quadrant D | 4,111,857 | 524,511 |
| Mode M0 | |||
|---|---|---|---|
| Quadrant | BADHDUFLAG | Total packets | Discarded packets |
| A | 0 | 19304 | 5 |
| B | 0 | 10606 | 2 |
| C | 0 | 11439 | 2 |
| D | 0 | 15927 | 2 |
| Mode M9 | |||
|---|---|---|---|
| Quadrant | BADHDUFLAG | Total packets | Discarded packets |
| A | 0 | 42 | 0 |
| B | 0 | 42 | 0 |
| C | 0 | 42 | 0 |
| D | 0 | 42 | 0 |
| Mode SS | |||
|---|---|---|---|
| Quadrant | BADHDUFLAG | Total packets | Discarded packets |
| A | 0 | 108 | 0 |
| B | 0 | 108 | 0 |
| C | 0 | 108 | 0 |
| D | 0 | 108 | 0 |
| Quadrant | Total seconds | Saturated seconds | Saturation percentage |
|---|---|---|---|
| A | 5270 | 494 | 9.373814% |
| B | 5271 | 7 | 0.132802% |
| C | 5271 | 51 | 0.967558% |
| D | 5271 | 488 | 9.258205% |
Noise dominated data is calculated using 1-second bins in cleaned event files. If a bin has >2000 counts, and if more than 50% of those come from <1% of pixels, then it is considered to be noise-dominated and hence unusable.
| Quadrant | # 1 sec bins | Bins with >0 counts | Bins with >2000 counts | High rate bins dominated by noise | Noise dominated (total time) | Noise dominated (detector-on time) | Marked lightcurve |
|---|---|---|---|---|---|---|---|
| A | 9486 | 5272 | 371 | 371 | 3.91% | 7.04% | 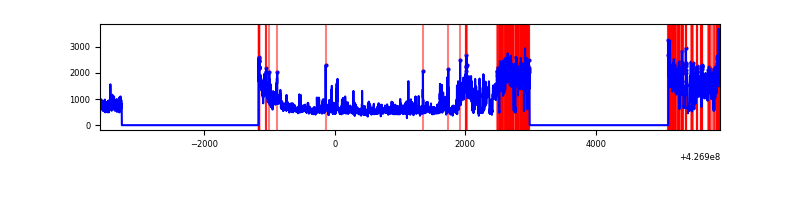 |
| B | 9487 | 5273 | 0 | 0 | 0.00% | 0.00% | 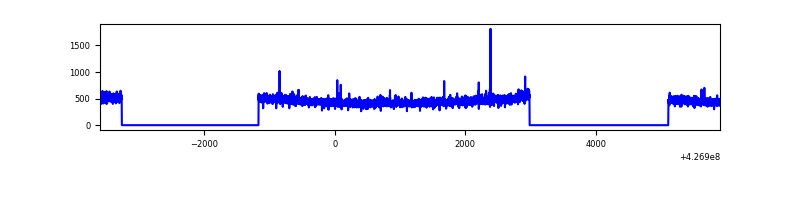 |
| C | 9487 | 5273 | 43 | 43 | 0.45% | 0.82% | 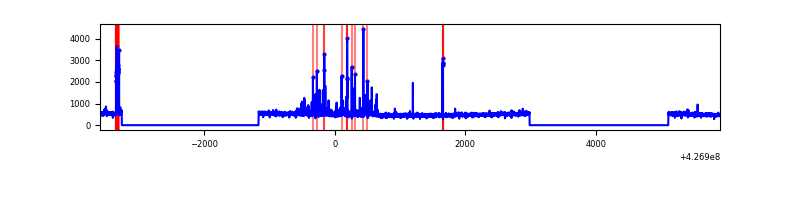 |
| D | 9487 | 5273 | 412 | 412 | 4.34% | 7.81% | 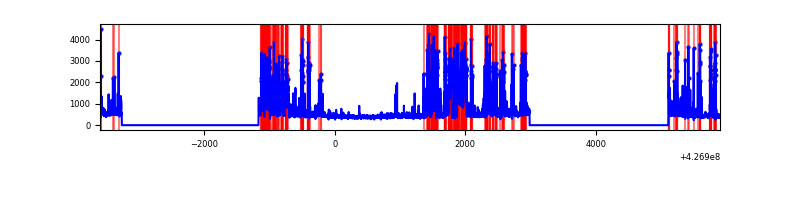 |
Top three noisy pixels from each quadrant. If the there are fewer than three noisy pixels in the level2.evt file, extra rows are filled as -1
| Pixel properties | Quadrant properties | ||||||
|---|---|---|---|---|---|---|---|
| Quadrant | DetID | PixID | Counts | Sigma | Mean | Median | Sigma |
| A | 15 | 222 | 2470464 | 20440.05 | 587 | 573 | 120.8 |
| A | 10 | 83 | 507249 | 4193.09 | 587 | 573 | 120.8 |
| A | 13 | 248 | 7759 | 59.47 | 587 | 573 | 120.8 |
| B | 3 | 112 | 17253 | 142.7 | 600 | 583 | 116.8 |
| B | 12 | 111 | 14704 | 120.88 | 600 | 583 | 116.8 |
| B | 11 | 111 | 13694 | 112.24 | 600 | 583 | 116.8 |
| C | 15 | 214 | 220364 | 1571.77 | 596 | 601 | 139.8 |
| C | 8 | 79 | 163922 | 1168.09 | 596 | 601 | 139.8 |
| C | 10 | 223 | 102468 | 728.56 | 596 | 601 | 139.8 |
| D | 13 | 249 | 1070126 | 7642.01 | 571 | 557 | 140.0 |
| D | 12 | 6 | 455146 | 3248.01 | 571 | 557 | 140.0 |
| D | 1 | 52 | 213141 | 1518.9 | 571 | 557 | 140.0 |
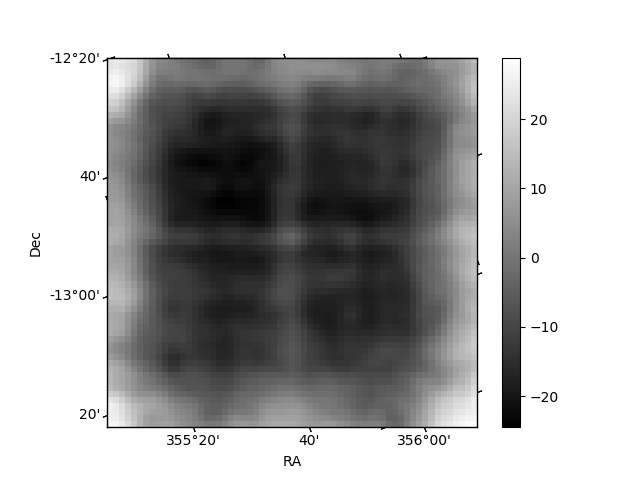
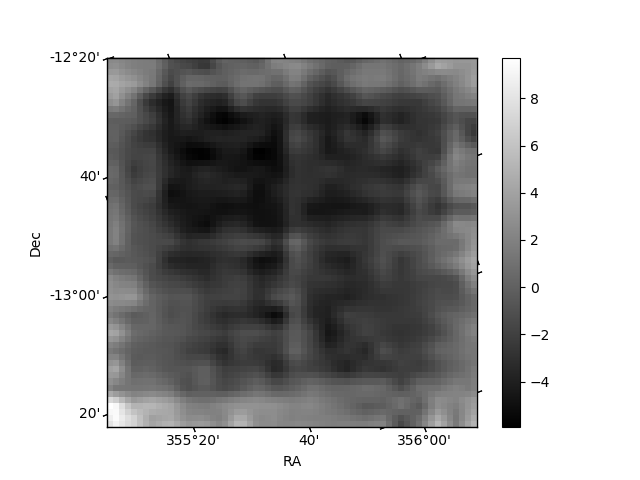
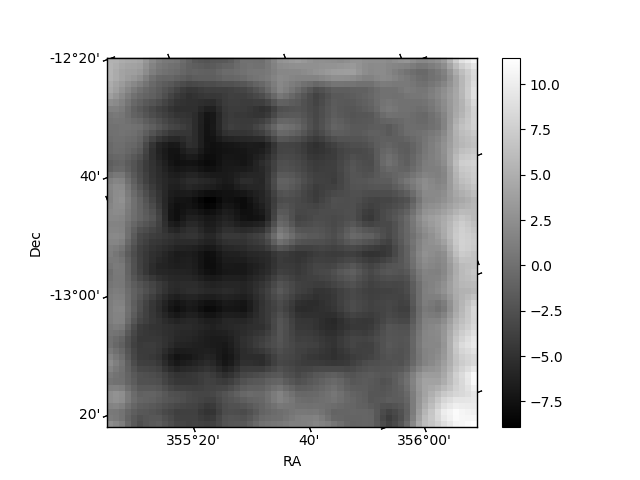
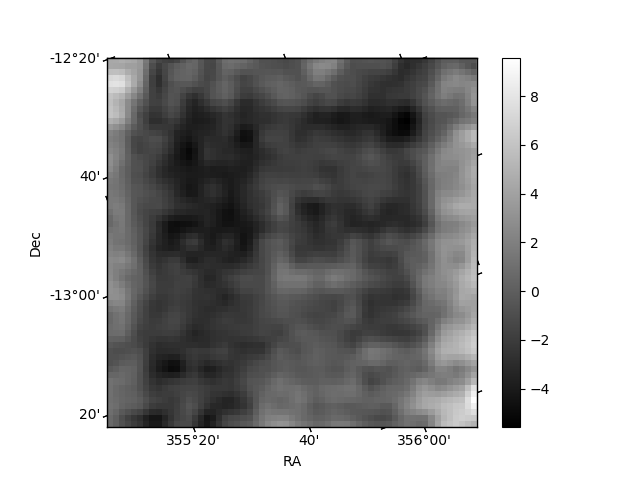
Histogram calculated using DETX and DETY for each event in the final _common_clean file
| Quadrant A | 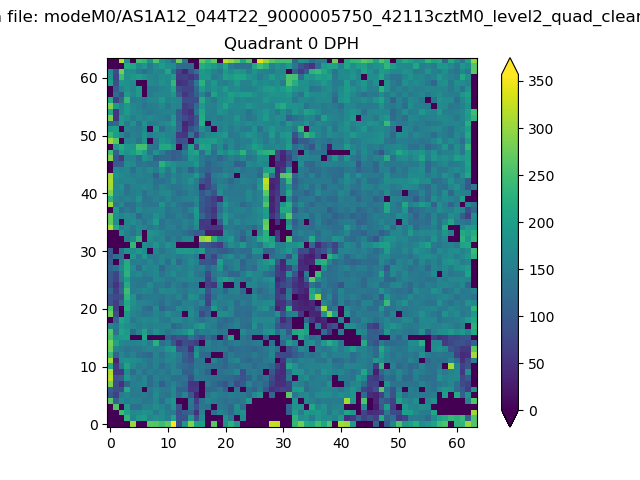 |
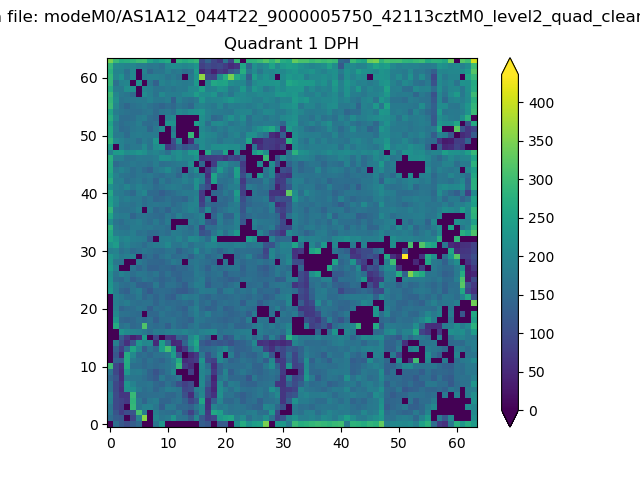 |
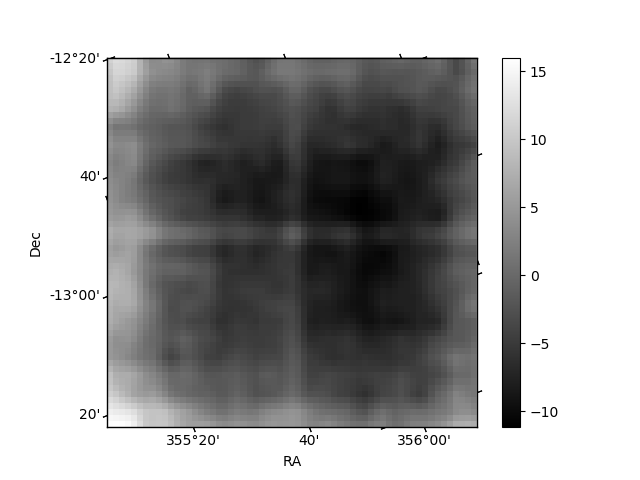
Quadrant B |
|---|---|---|---|
| Quadrant D | 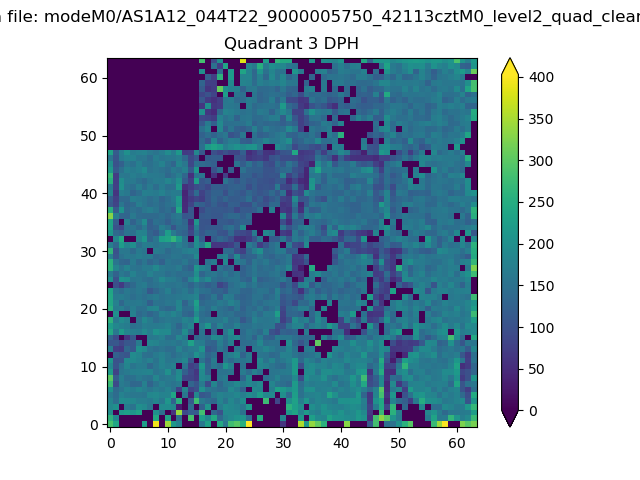 |
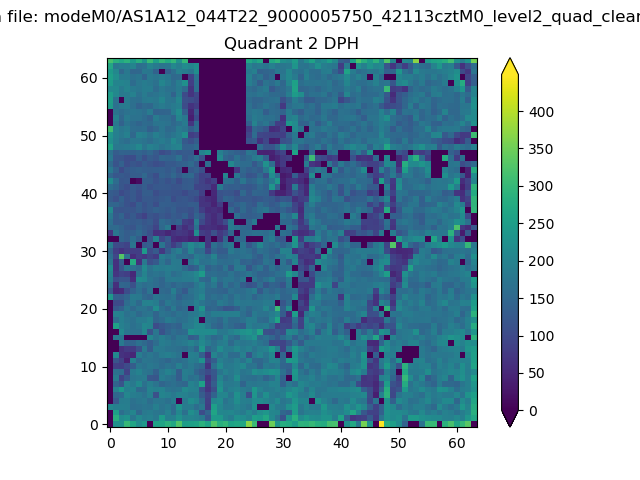 |
Quadrant C |
| Plot type | Count rate plots | Images |
|---|---|---|
| Comparison with Poisson distribution Blue bars denote a histogram of data divided into 1 sec bins. Red curve is a Poisson curve with rate = median count rate of data. |
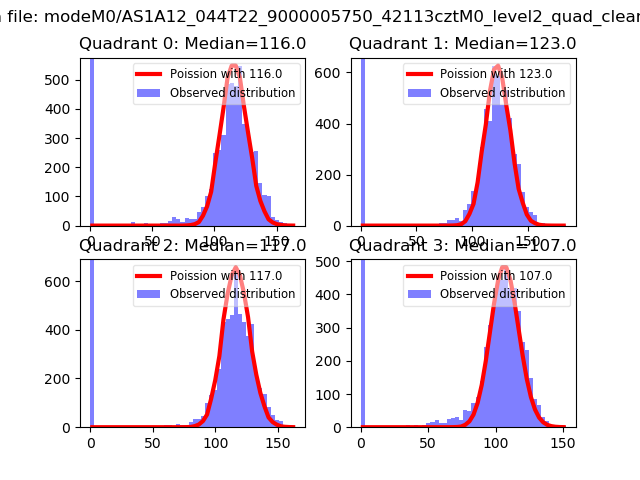 |
 |
| Quadrant-wise count rates Data is divided into 100 sec bins |
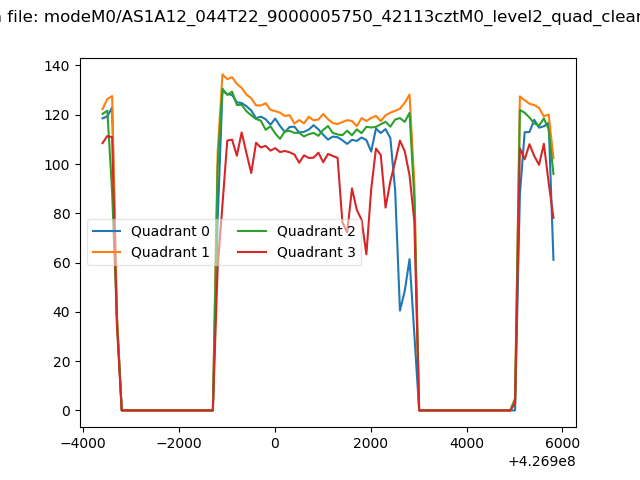 |
|
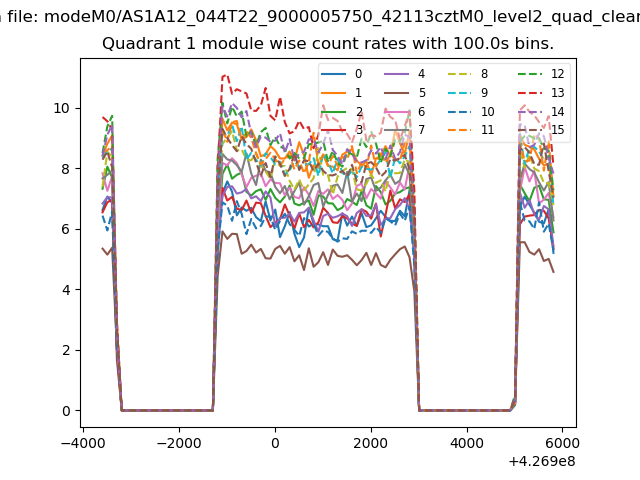
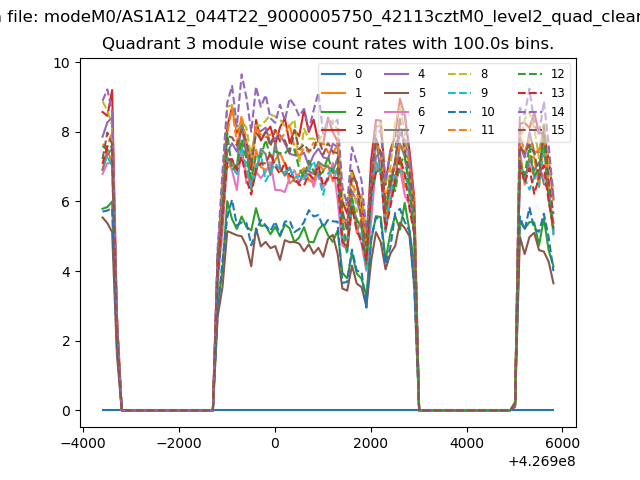
| Module-wise count rates for Quadrant A Data is divided into 100 sec bins |
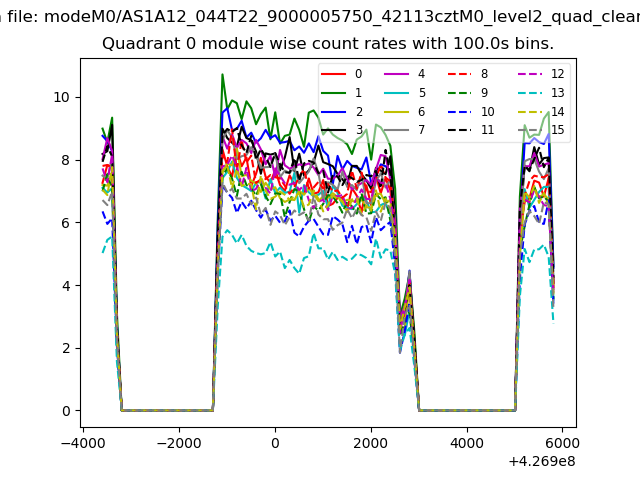 |
 |
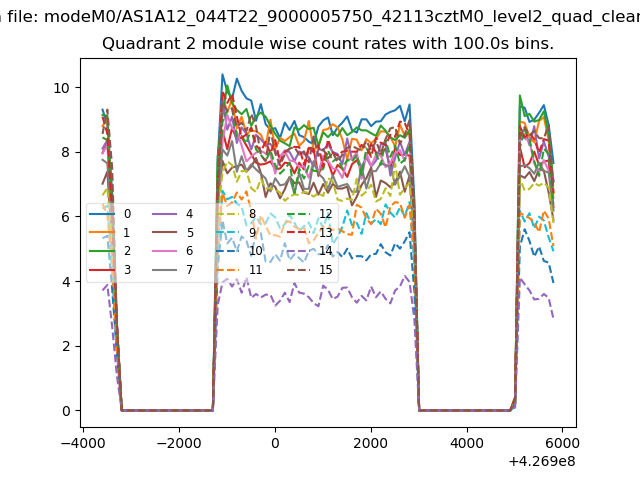
| Module-wise count rates for Quadrant B Data is divided into 100 sec bins |
 |
 |
| Module-wise count rates for Quadrant C Data is divided into 100 sec bins |
 |
 |
| Module-wise count rates for Quadrant D Data is divided into 100 sec bins |
 |
 |
| Parameter | Plot |
|---|---|
| CZT HV Monitor | 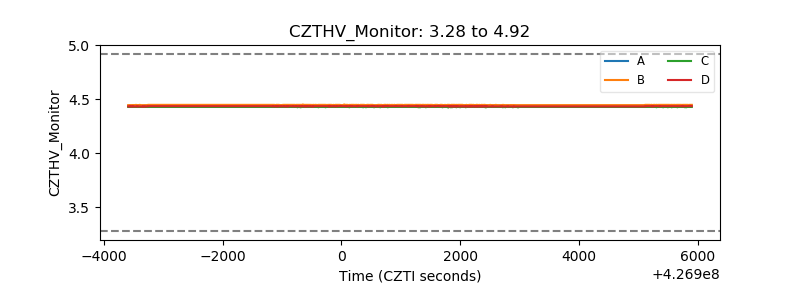 |
| D_VDD | 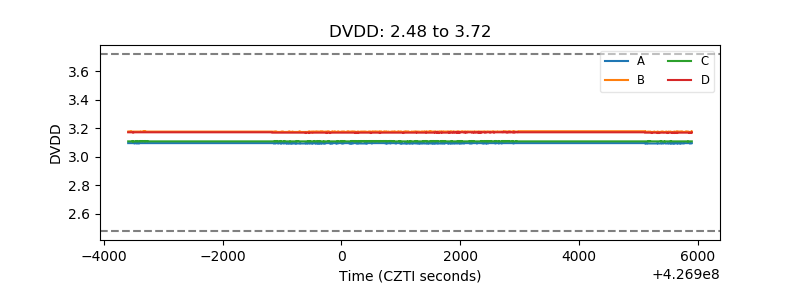 |
| Temperature 1 | 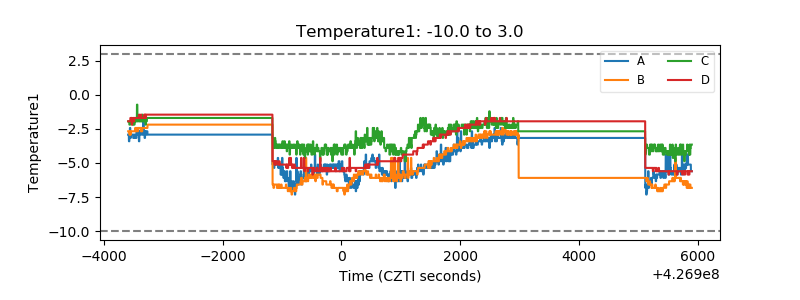 |
| Veto HV Monitor | 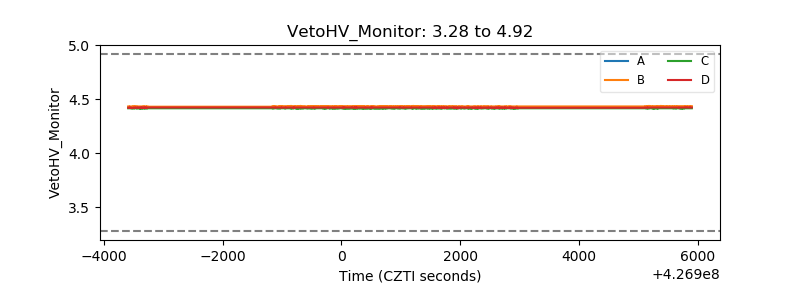 |
| Veto LLD | 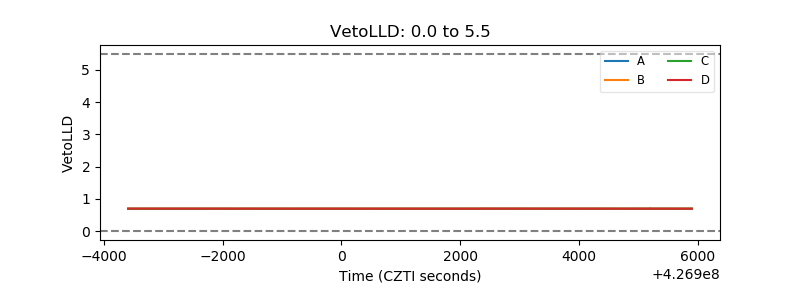 |
| Alpha Counter | 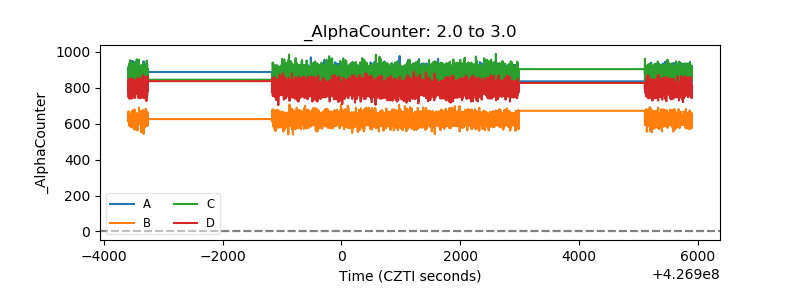 |
| _CPM_Rate | 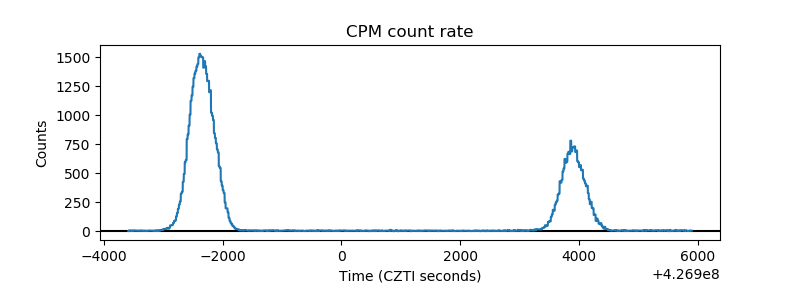 |
| CZT Counter | 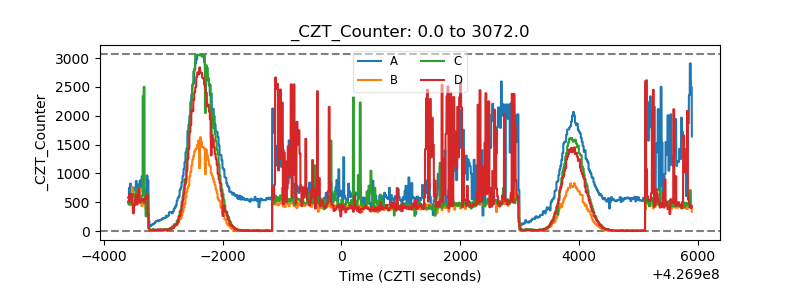 |
| +2.5 Volts monitor | 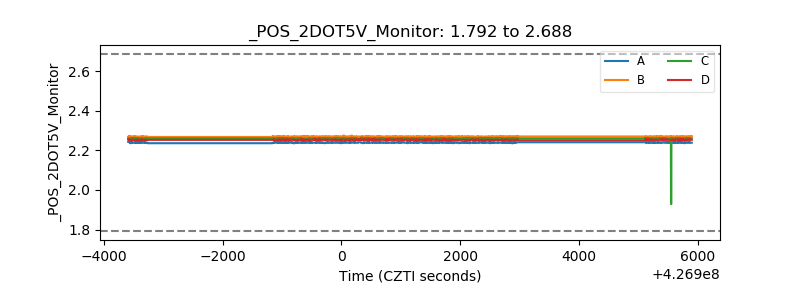 |
| +5 Volts monitor | 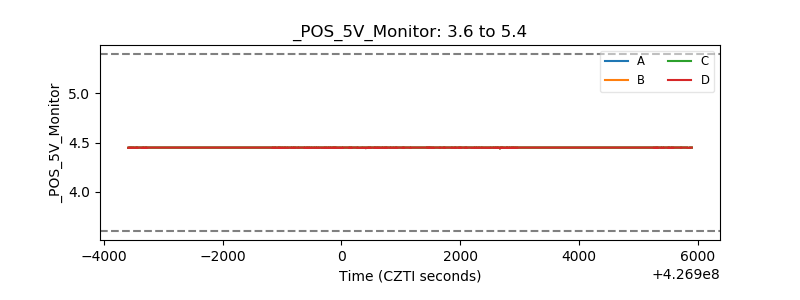 |
| _ROLL_ROT | 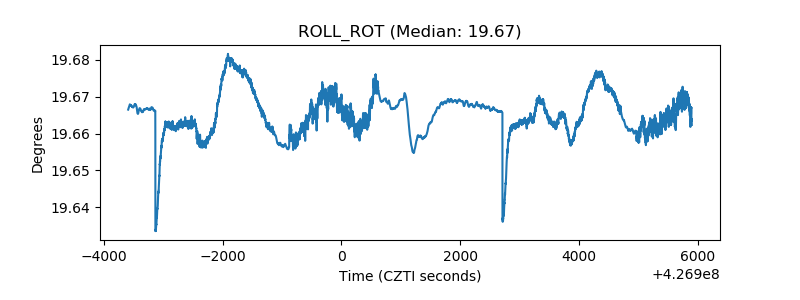 |
| _Roll_DEC | 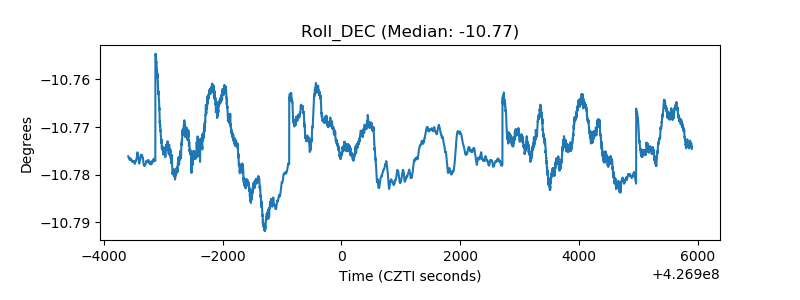 |
| _Roll_RA | 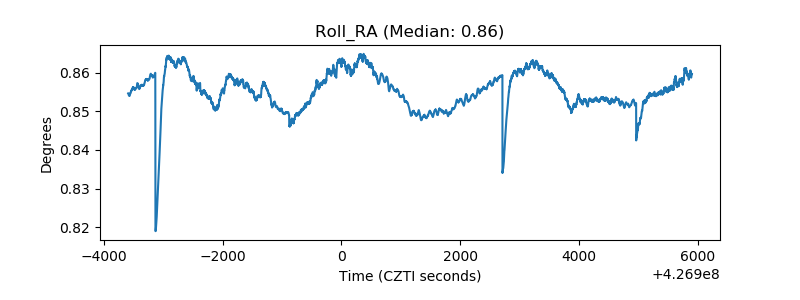 |
| Veto Counter | 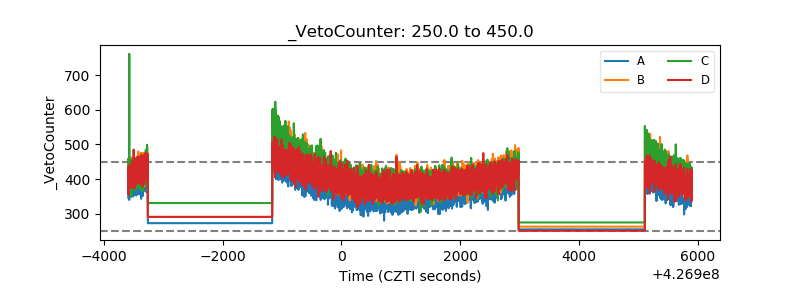 |