| Param | Original file | Final file |
|---|---|---|
| Filename | modeM0/AS1A12_044T22_9000005750_42114cztM0_level2.fits | modeM0/AS1A12_044T22_9000005750_42114cztM0_level2_quad_clean.evt |
| Size (bytes) | 420,258,240 | 83,494,080 |
| Size | 400.8 MB | 79.6 MB |
| Events in quadrant A | 6,921,737 | 521,097 |
| Events in quadrant B | 2,227,064 | 594,352 |
| Events in quadrant C | 2,393,590 | 567,920 |
| Events in quadrant D | 3,619,718 | 488,731 |
| Mode M0 | |||
|---|---|---|---|
| Quadrant | BADHDUFLAG | Total packets | Discarded packets |
| A | 0 | 24104 | 2 |
| B | 0 | 10210 | 2 |
| C | 0 | 10216 | 2 |
| D | 0 | 14445 | 2 |
| Mode M9 | |||
|---|---|---|---|
| Quadrant | BADHDUFLAG | Total packets | Discarded packets |
| A | 0 | 42 | 0 |
| B | 0 | 42 | 0 |
| C | 0 | 42 | 0 |
| D | 0 | 42 | 0 |
| Mode SS | |||
|---|---|---|---|
| Quadrant | BADHDUFLAG | Total packets | Discarded packets |
| A | 0 | 106 | 0 |
| B | 0 | 106 | 0 |
| C | 0 | 106 | 0 |
| D | 0 | 106 | 0 |
| Quadrant | Total seconds | Saturated seconds | Saturation percentage |
|---|---|---|---|
| A | 5077 | 685 | 13.492220% |
| B | 5078 | 8 | 0.157542% |
| C | 5078 | 5 | 0.098464% |
| D | 5078 | 403 | 7.936195% |
Noise dominated data is calculated using 1-second bins in cleaned event files. If a bin has >2000 counts, and if more than 50% of those come from <1% of pixels, then it is considered to be noise-dominated and hence unusable.
| Quadrant | # 1 sec bins | Bins with >0 counts | Bins with >2000 counts | High rate bins dominated by noise | Noise dominated (total time) | Noise dominated (detector-on time) | Marked lightcurve |
|---|---|---|---|---|---|---|---|
| A | 9293 | 5079 | 531 | 531 | 5.71% | 10.45% | 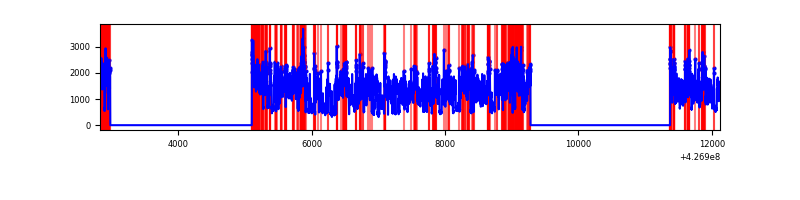 |
| B | 9294 | 5080 | 2 | 2 | 0.02% | 0.04% | 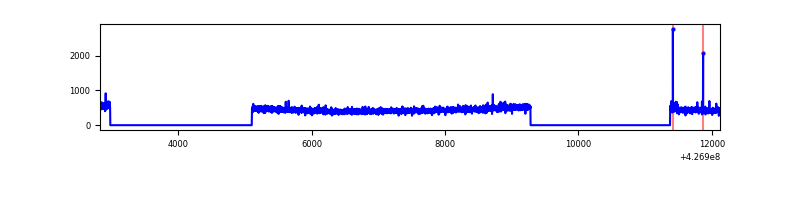 |
| C | 9294 | 5080 | 0 | 0 | 0.00% | 0.00% | 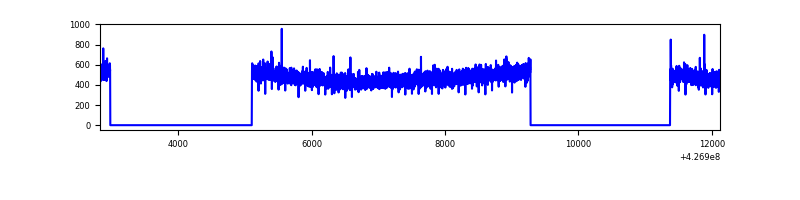 |
| D | 9294 | 5080 | 335 | 335 | 3.60% | 6.59% | 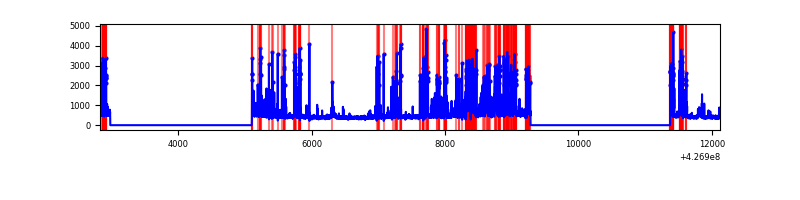 |
Top three noisy pixels from each quadrant. If the there are fewer than three noisy pixels in the level2.evt file, extra rows are filled as -1
| Pixel properties | Quadrant properties | ||||||
|---|---|---|---|---|---|---|---|
| Quadrant | DetID | PixID | Counts | Sigma | Mean | Median | Sigma |
| A | 15 | 222 | 4258924 | 37995.67 | 546 | 535 | 112.1 |
| A | 10 | 83 | 492286 | 4387.67 | 546 | 535 | 112.1 |
| A | 15 | 223 | 46008 | 405.73 | 546 | 535 | 112.1 |
| B | 12 | 111 | 13791 | 120.9 | 562 | 546 | 109.6 |
| B | 11 | 111 | 12735 | 111.26 | 562 | 546 | 109.6 |
| B | 14 | 111 | 12376 | 107.99 | 562 | 546 | 109.6 |
| C | 15 | 214 | 214640 | 1632.19 | 559 | 564 | 131.2 |
| C | 13 | 61 | 3763 | 24.39 | 559 | 564 | 131.2 |
| C | 0 | 207 | 1968 | 10.7 | 559 | 564 | 131.2 |
| D | 13 | 249 | 684742 | 5133.51 | 537 | 522 | 133.3 |
| D | 12 | 233 | 420507 | 3151.03 | 537 | 522 | 133.3 |
| D | 12 | 6 | 208267 | 1558.65 | 537 | 522 | 133.3 |
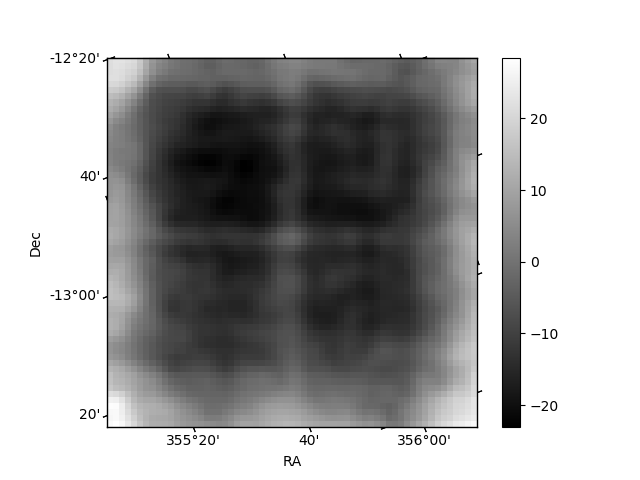
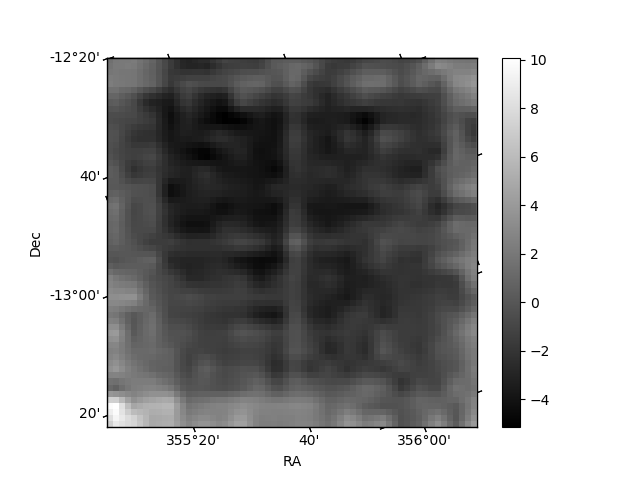
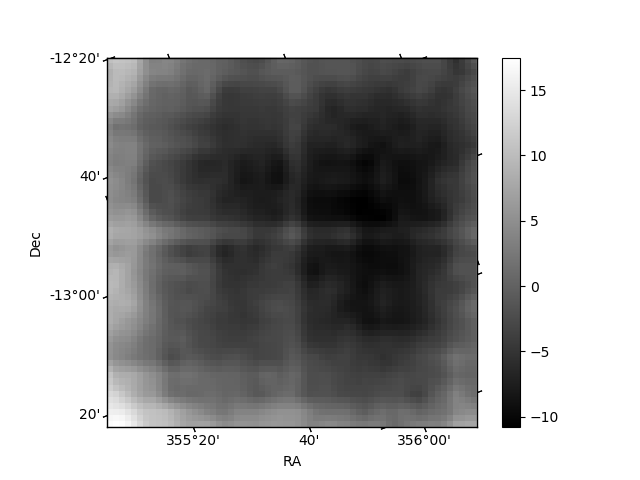
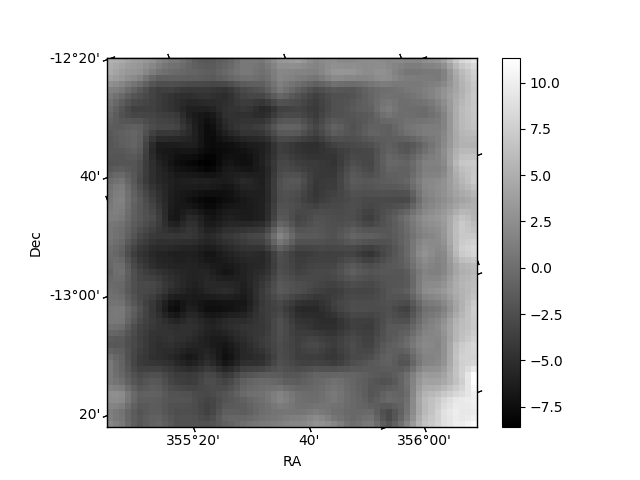
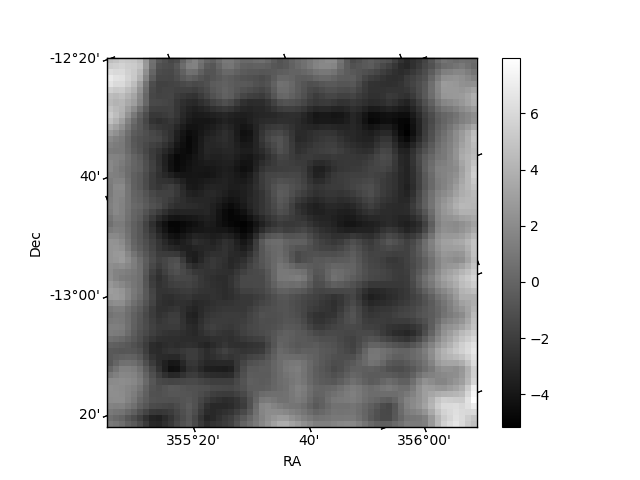
Histogram calculated using DETX and DETY for each event in the final _common_clean file
| Quadrant A | 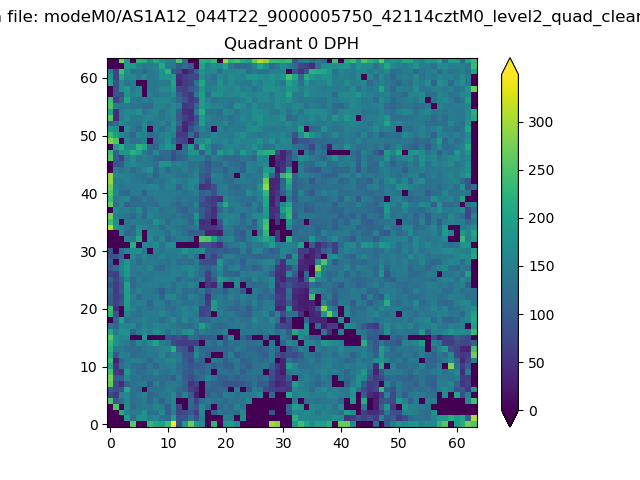 |
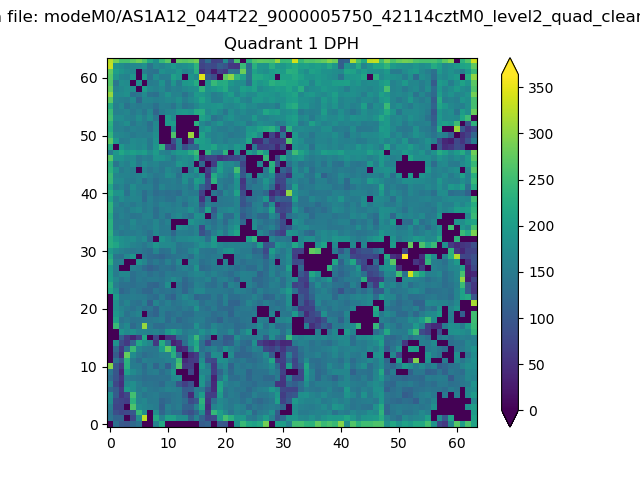 |
Quadrant B |
|---|---|---|---|
| Quadrant D | 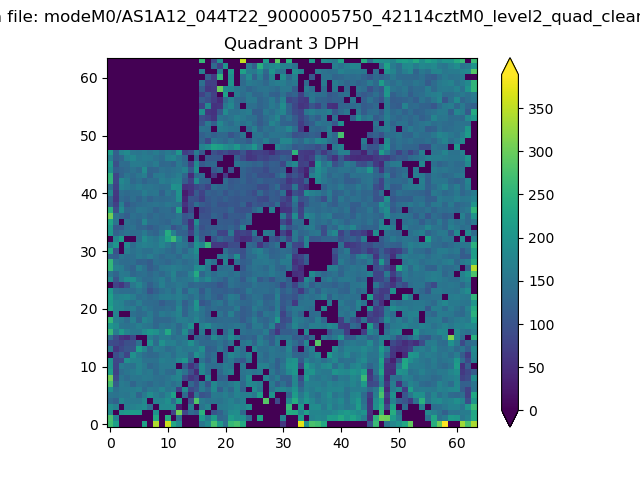 |
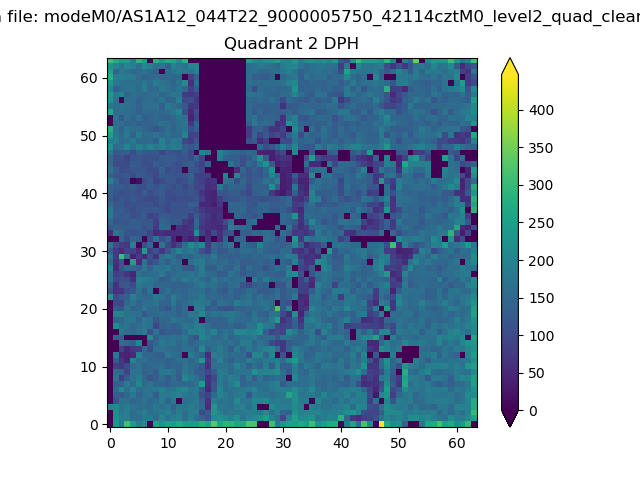 |
Quadrant C |
| Plot type | Count rate plots | Images |
|---|---|---|
| Comparison with Poisson distribution Blue bars denote a histogram of data divided into 1 sec bins. Red curve is a Poisson curve with rate = median count rate of data. |
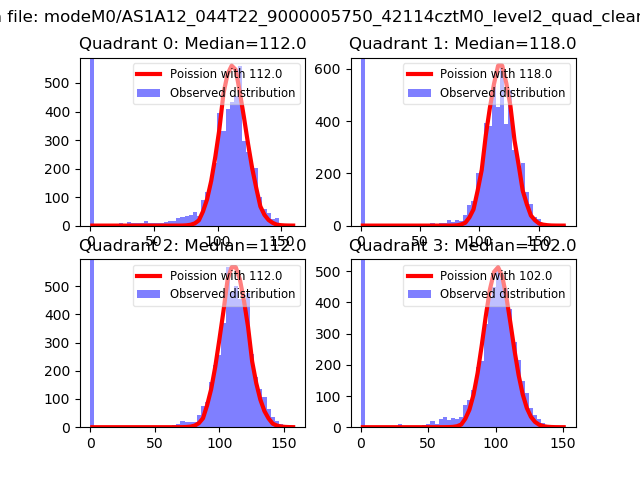 |
 |
| Quadrant-wise count rates Data is divided into 100 sec bins |
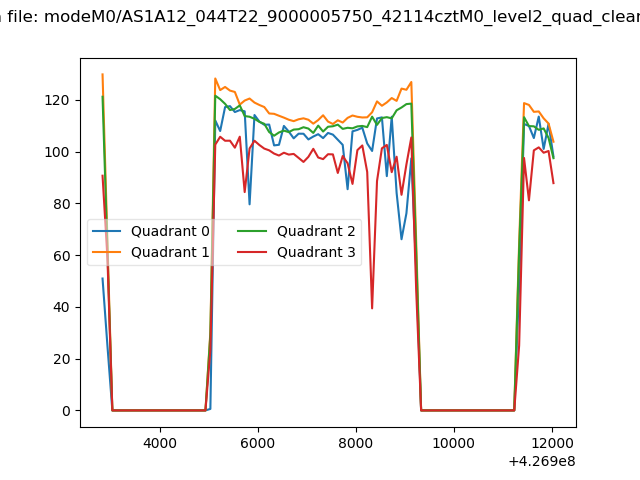 |
|
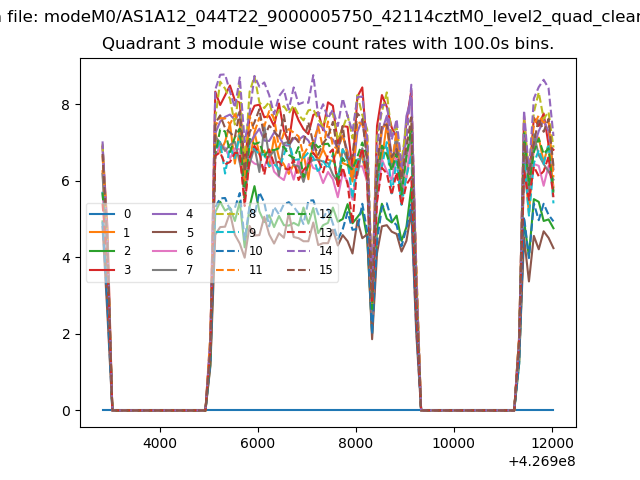
| Module-wise count rates for Quadrant A Data is divided into 100 sec bins |
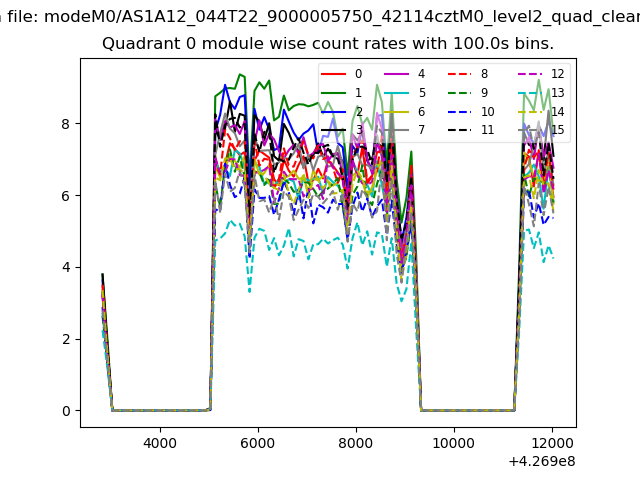 |
 |
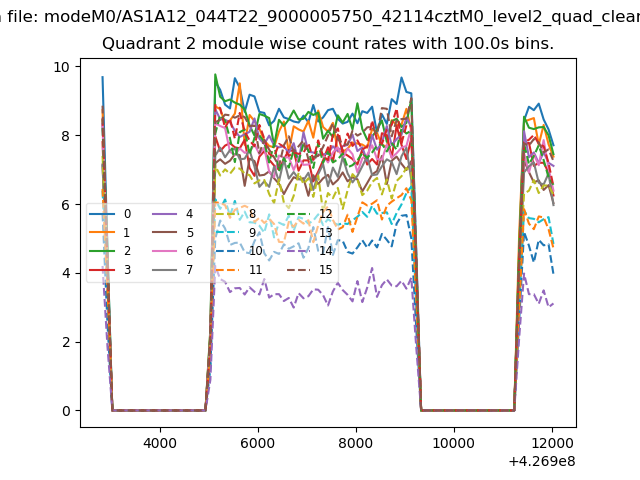
| Module-wise count rates for Quadrant B Data is divided into 100 sec bins |
 |
 |
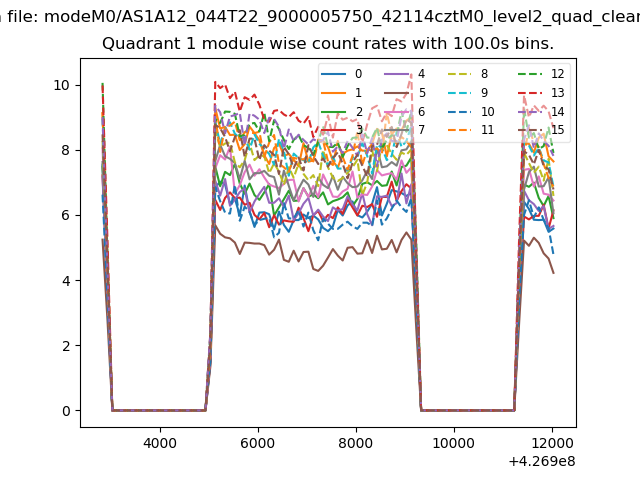
| Module-wise count rates for Quadrant C Data is divided into 100 sec bins |
 |
 |
| Module-wise count rates for Quadrant D Data is divided into 100 sec bins |
 |
 |
| Parameter | Plot |
|---|---|
| CZT HV Monitor | 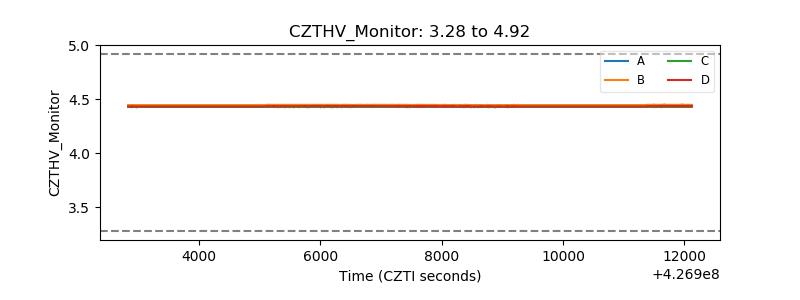 |
| D_VDD | 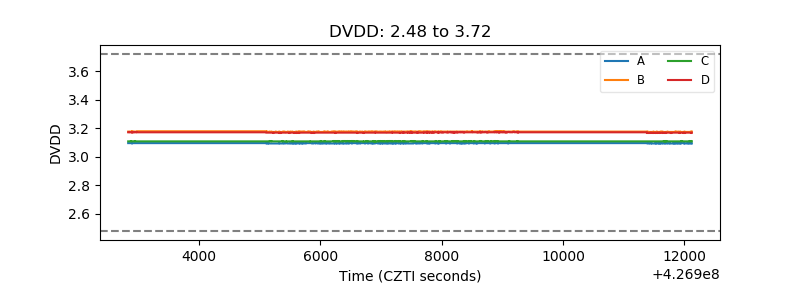 |
| Temperature 1 | 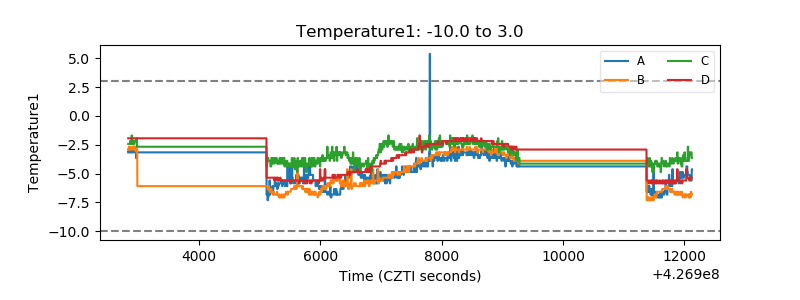 |
| Veto HV Monitor | 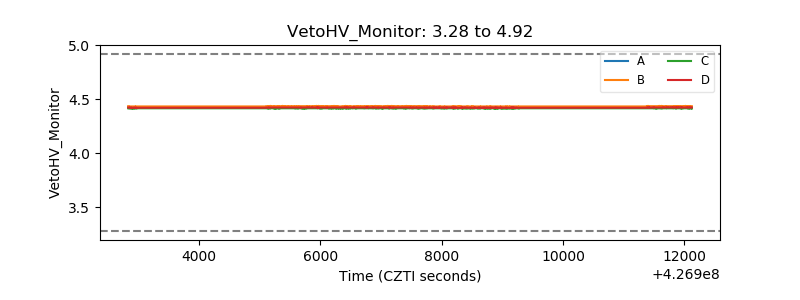 |
| Veto LLD | 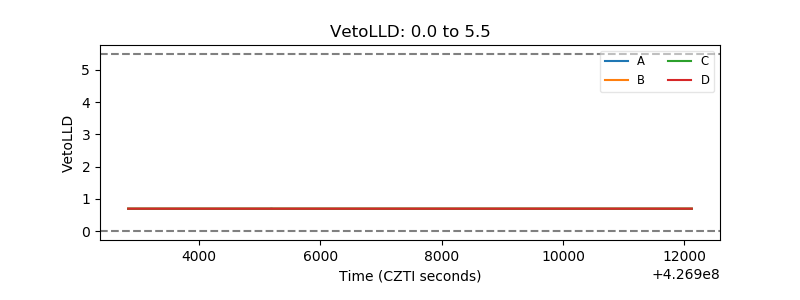 |
| Alpha Counter | 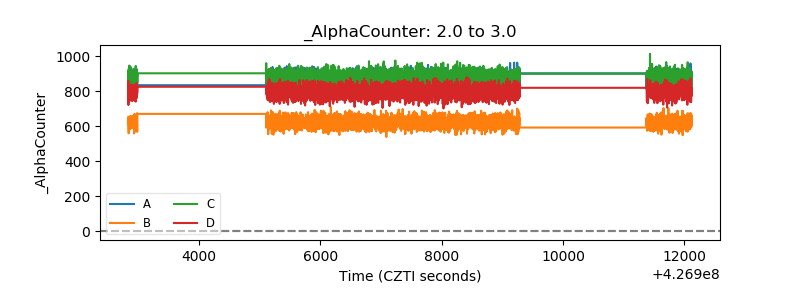 |
| _CPM_Rate | 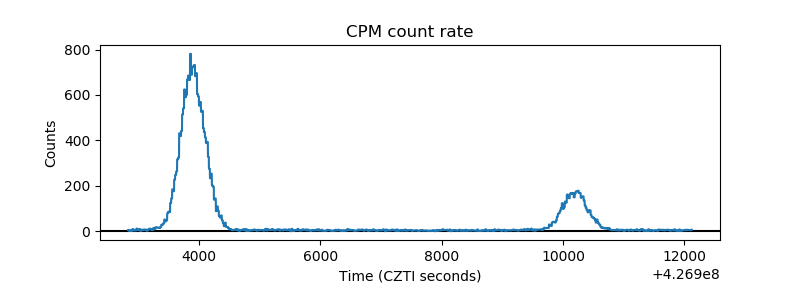 |
| CZT Counter | 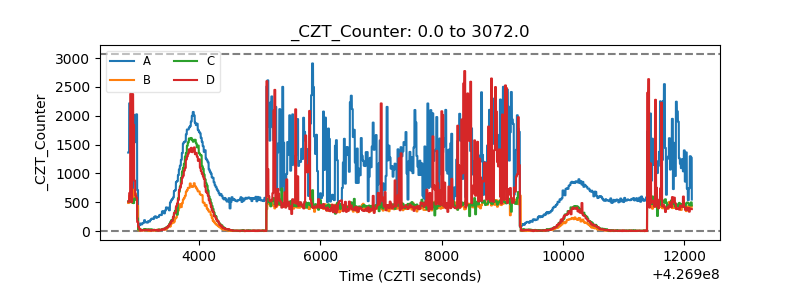 |
| +2.5 Volts monitor | 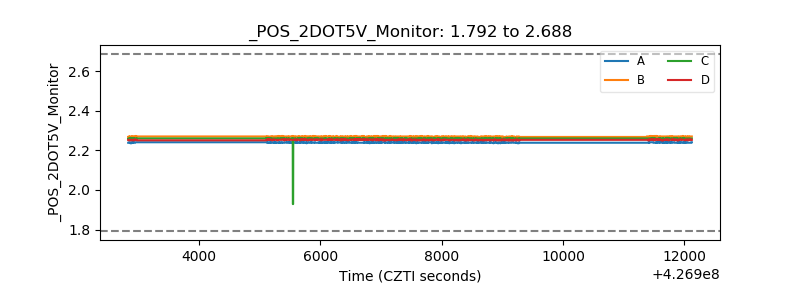 |
| +5 Volts monitor | 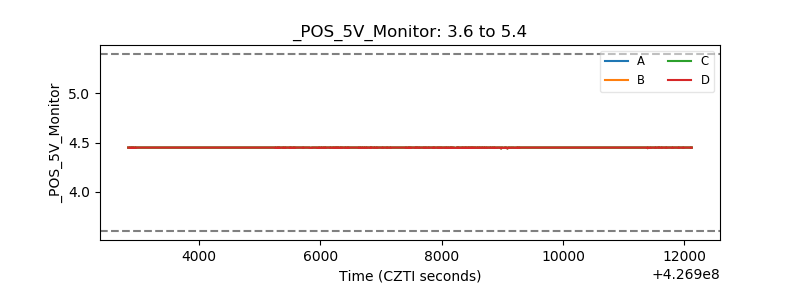 |
| _ROLL_ROT | 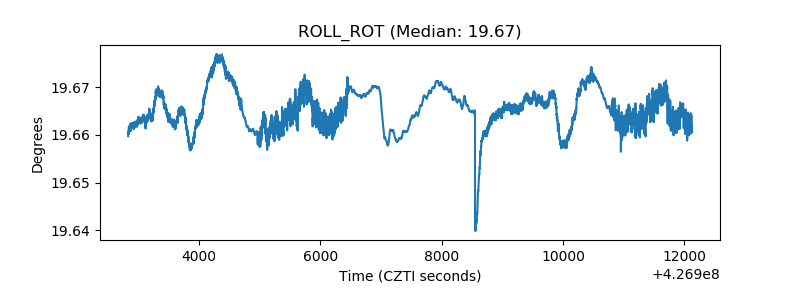 |
| _Roll_DEC | 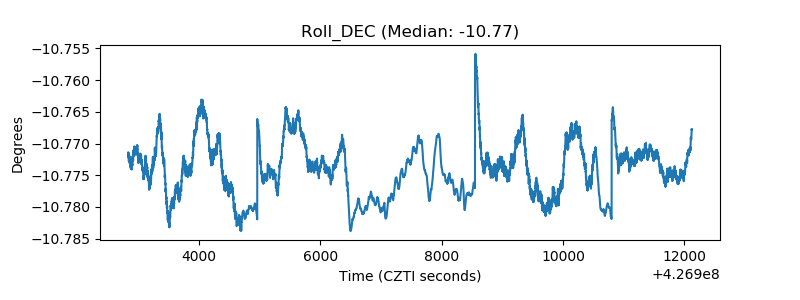 |
| _Roll_RA | 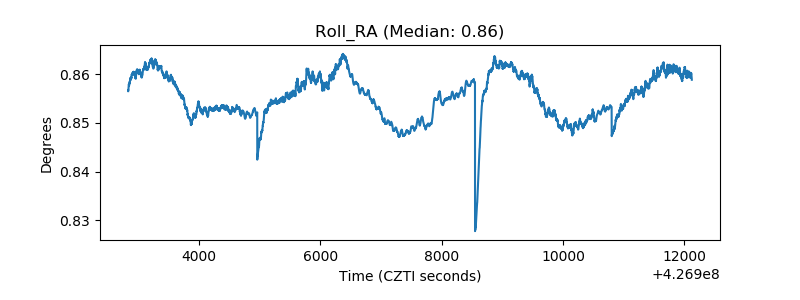 |
| Veto Counter | 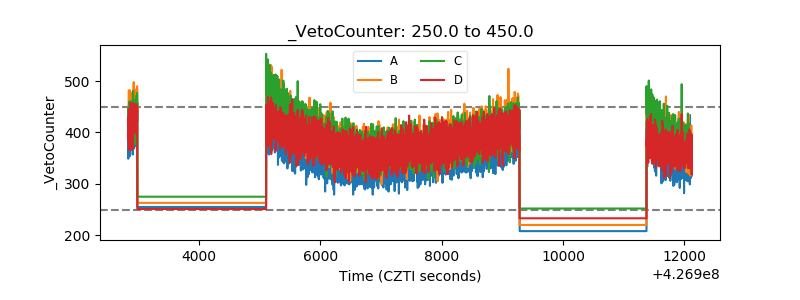 |