| Param | Original file | Final file |
|---|---|---|
| Filename | modeM0/AS1A12_044T22_9000005750_42115cztM0_level2.fits | modeM0/AS1A12_044T22_9000005750_42115cztM0_level2_quad_clean.evt |
| Size (bytes) | 333,898,560 | 77,160,960 |
| Size | 318.4 MB | 73.6 MB |
| Events in quadrant A | 4,073,849 | 504,962 |
| Events in quadrant B | 2,126,921 | 540,622 |
| Events in quadrant C | 2,296,881 | 516,544 |
| Events in quadrant D | 3,493,191 | 441,692 |
| Mode M0 | |||
|---|---|---|---|
| Quadrant | BADHDUFLAG | Total packets | Discarded packets |
| A | 0 | 15948 | 869 |
| B | 0 | 10107 | 531 |
| C | 0 | 10297 | 518 |
| D | 0 | 14709 | 930 |
| Mode M9 | |||
|---|---|---|---|
| Quadrant | BADHDUFLAG | Total packets | Discarded packets |
| A | 0 | 40 | 2 |
| B | 0 | 40 | 4 |
| C | 0 | 39 | 2 |
| D | 0 | 39 | 3 |
| Mode SS | |||
|---|---|---|---|
| Quadrant | BADHDUFLAG | Total packets | Discarded packets |
| A | 0 | 104 | 6 |
| B | 0 | 105 | 5 |
| C | 0 | 104 | 4 |
| D | 0 | 104 | 6 |
| Quadrant | Total seconds | Saturated seconds | Saturation percentage |
|---|---|---|---|
| A | 4721 | 223 | 4.723576% |
| B | 4742 | 11 | 0.231970% |
| C | 4758 | 28 | 0.588483% |
| D | 4721 | 398 | 8.430417% |
Noise dominated data is calculated using 1-second bins in cleaned event files. If a bin has >2000 counts, and if more than 50% of those come from <1% of pixels, then it is considered to be noise-dominated and hence unusable.
| Quadrant | # 1 sec bins | Bins with >0 counts | Bins with >2000 counts | High rate bins dominated by noise | Noise dominated (total time) | Noise dominated (detector-on time) | Marked lightcurve |
|---|---|---|---|---|---|---|---|
| A | 8747 | 4742 | 151 | 151 | 1.73% | 3.18% | 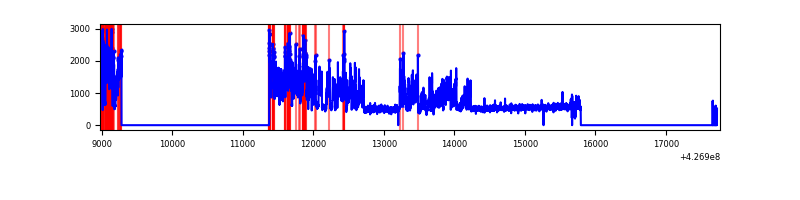 |
| B | 8777 | 4767 | 5 | 5 | 0.06% | 0.10% | 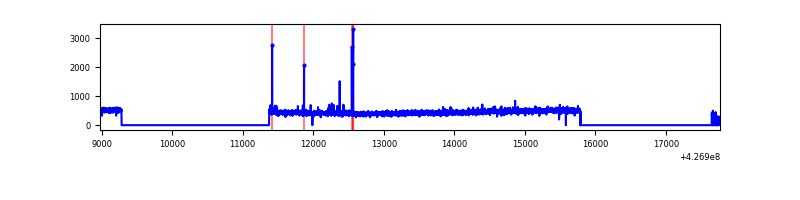 |
| C | 8771 | 4781 | 22 | 22 | 0.25% | 0.46% | 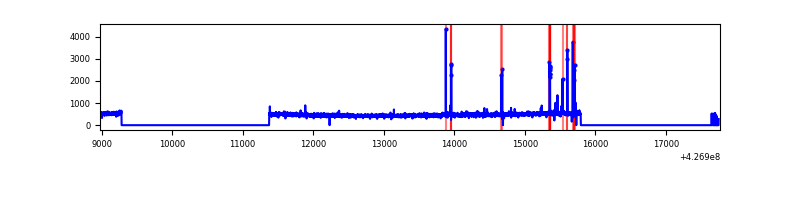 |
| D | 8789 | 4746 | 307 | 307 | 3.49% | 6.47% | 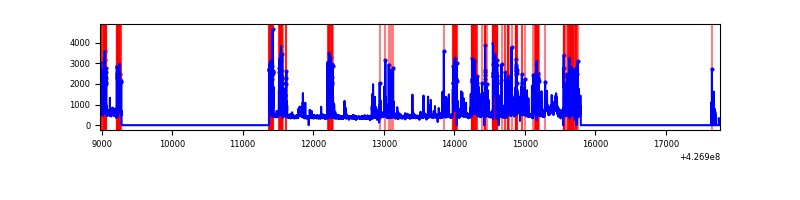 |
Top three noisy pixels from each quadrant. If the there are fewer than three noisy pixels in the level2.evt file, extra rows are filled as -1
| Pixel properties | Quadrant properties | ||||||
|---|---|---|---|---|---|---|---|
| Quadrant | DetID | PixID | Counts | Sigma | Mean | Median | Sigma |
| A | 15 | 222 | 1616616 | 15018.81 | 522 | 510 | 107.6 |
| A | 10 | 83 | 384043 | 3564.25 | 522 | 510 | 107.6 |
| A | 15 | 223 | 45942 | 422.21 | 522 | 510 | 107.6 |
| B | 3 | 112 | 25644 | 241.9 | 527 | 512 | 103.9 |
| B | 0 | 229 | 18340 | 171.6 | 527 | 512 | 103.9 |
| B | 12 | 111 | 13017 | 120.36 | 527 | 512 | 103.9 |
| C | 15 | 214 | 195071 | 1585.91 | 519 | 523 | 122.7 |
| C | 8 | 79 | 72684 | 588.24 | 519 | 523 | 122.7 |
| C | 12 | 249 | 5259 | 38.61 | 519 | 523 | 122.7 |
| D | 13 | 249 | 994636 | 7967.58 | 501 | 486 | 124.8 |
| D | 12 | 233 | 400061 | 3202.38 | 501 | 486 | 124.8 |
| D | 1 | 52 | 80558 | 641.73 | 501 | 486 | 124.8 |
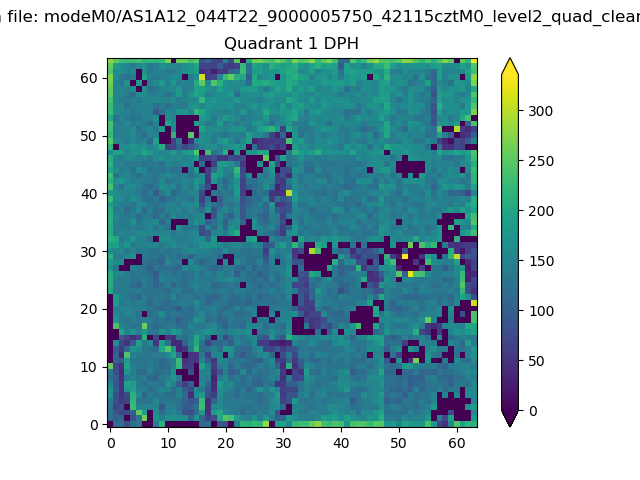
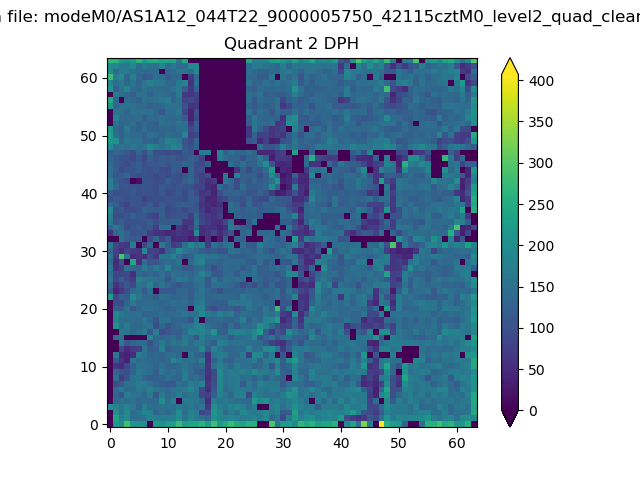
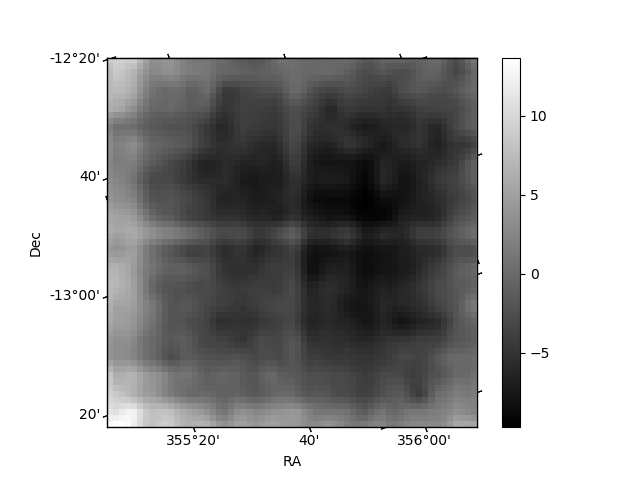
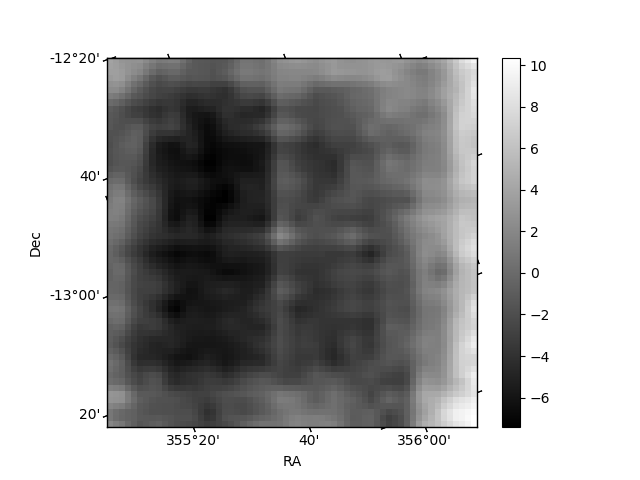
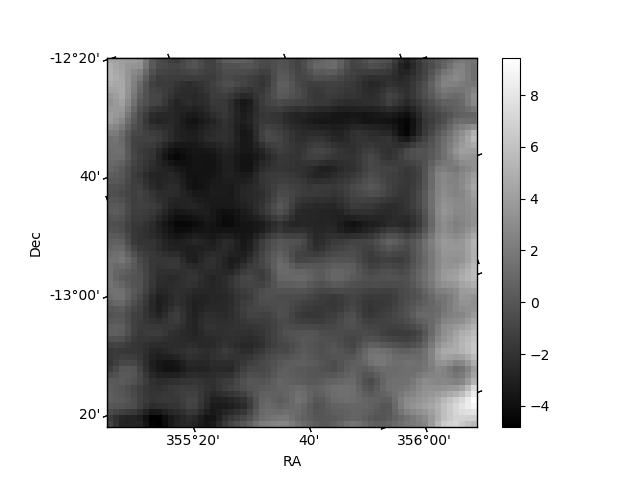
Histogram calculated using DETX and DETY for each event in the final _common_clean file
| Quadrant A |  |
 |
Quadrant B |
|---|---|---|---|
| Quadrant D |  |
 |
Quadrant C |
| Plot type | Count rate plots | Images |
|---|---|---|
| Comparison with Poisson distribution Blue bars denote a histogram of data divided into 1 sec bins. Red curve is a Poisson curve with rate = median count rate of data. |
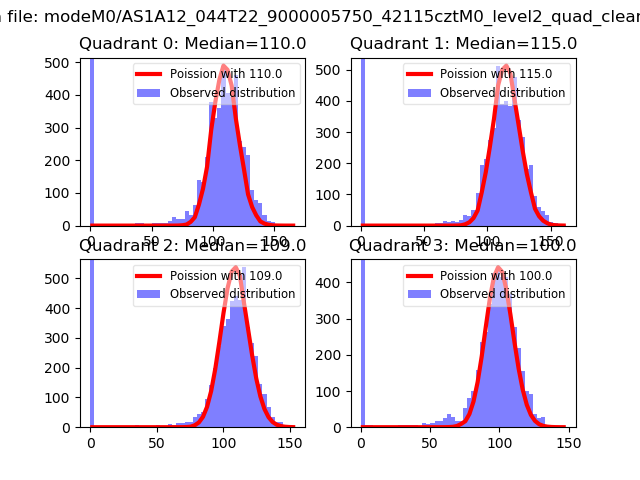 |
 |
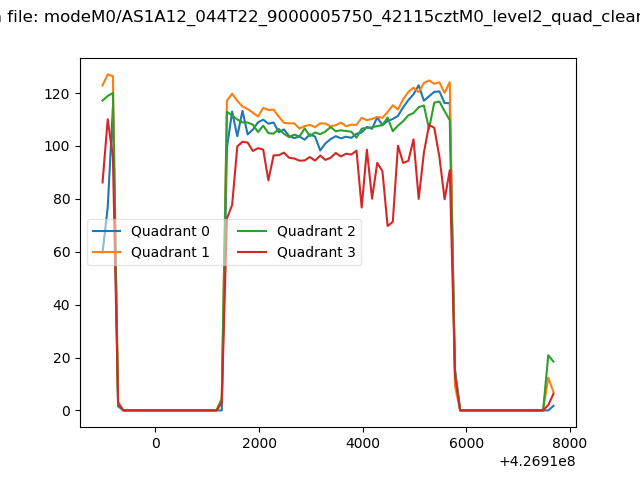
| Quadrant-wise count rates Data is divided into 100 sec bins |
 |
|
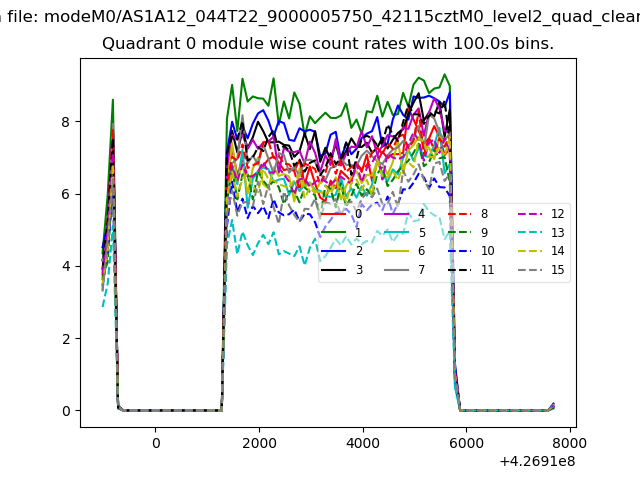
| Module-wise count rates for Quadrant A Data is divided into 100 sec bins |
 |
 |
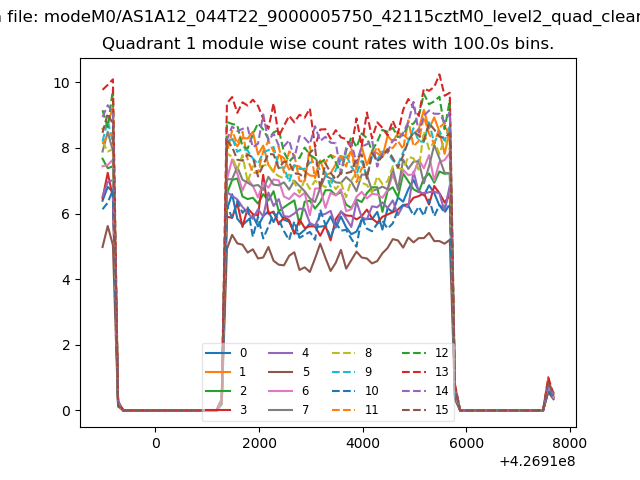
| Module-wise count rates for Quadrant B Data is divided into 100 sec bins |
 |
 |
| Module-wise count rates for Quadrant C Data is divided into 100 sec bins |
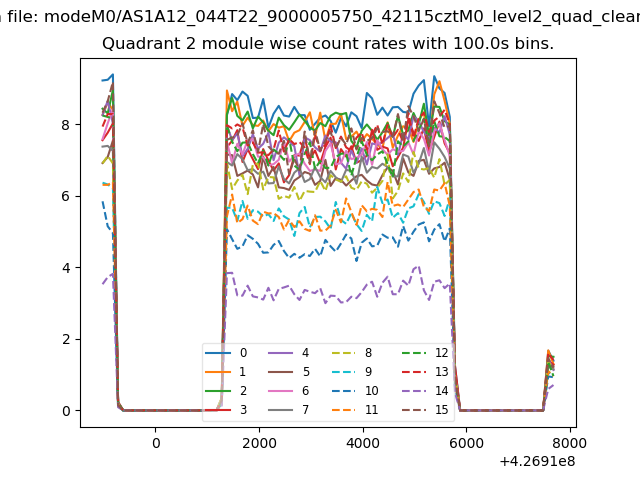 |
 |
| Module-wise count rates for Quadrant D Data is divided into 100 sec bins |
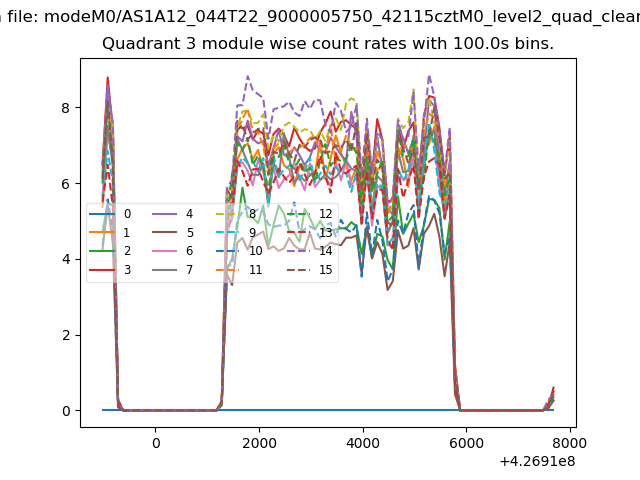 |
 |
| Parameter | Plot |
|---|---|
| CZT HV Monitor | 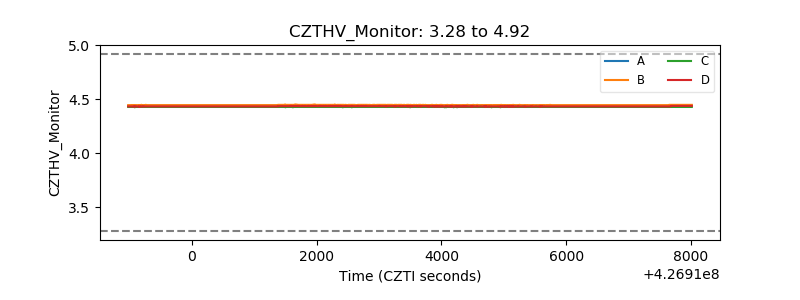 |
| D_VDD | 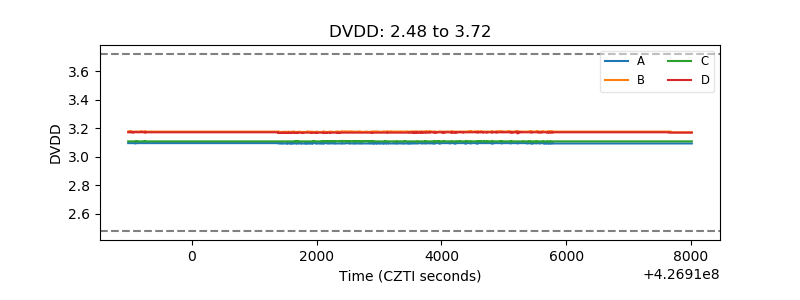 |
| Temperature 1 | 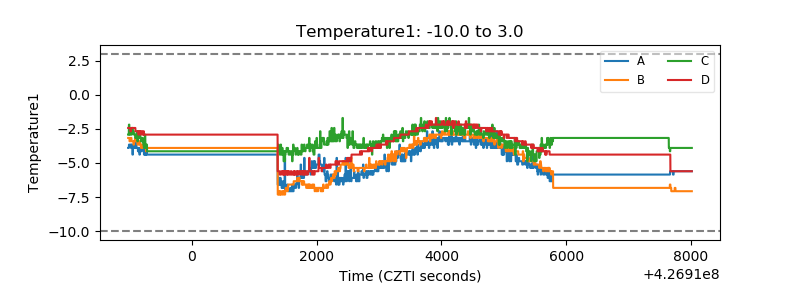 |
| Veto HV Monitor | 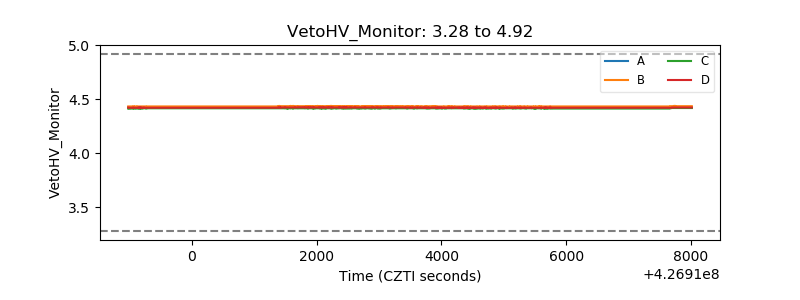 |
| Veto LLD | 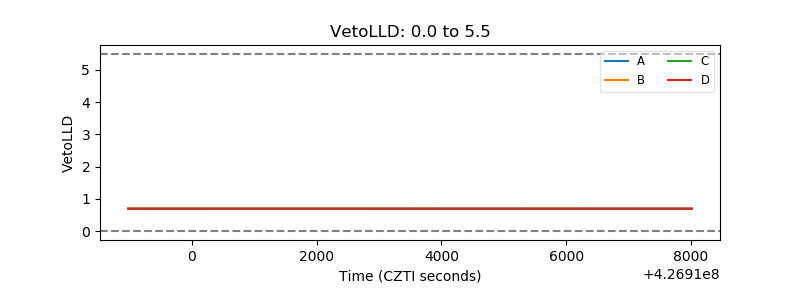 |
| Alpha Counter |  |
| _CPM_Rate | 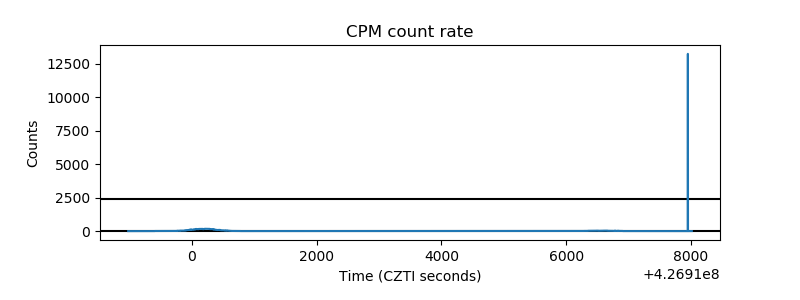 |
| CZT Counter | 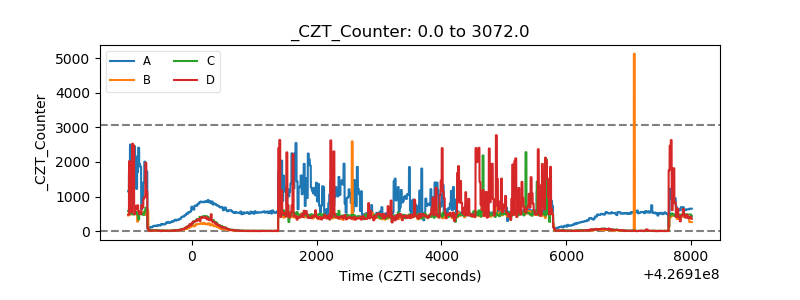 |
| +2.5 Volts monitor | 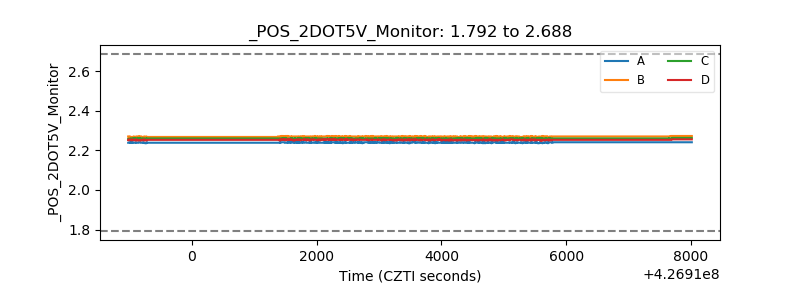 |
| +5 Volts monitor | 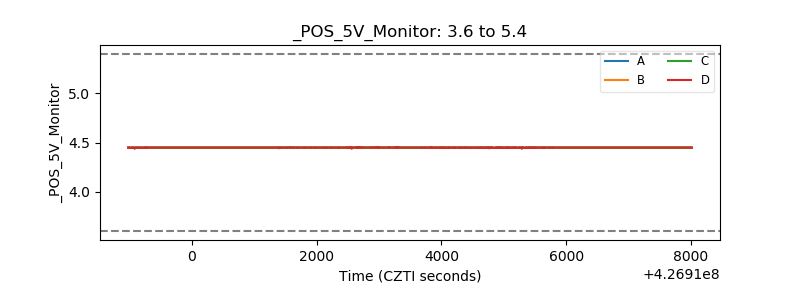 |
| _ROLL_ROT | 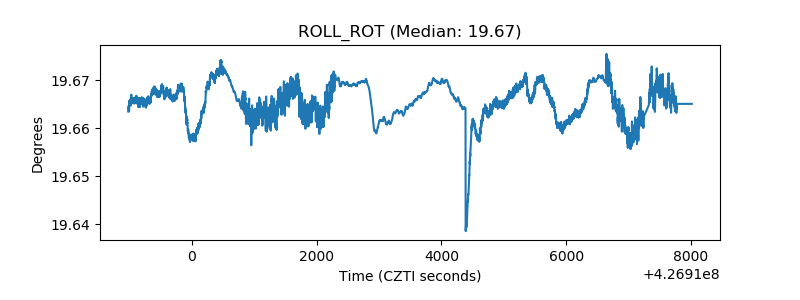 |
| _Roll_DEC | 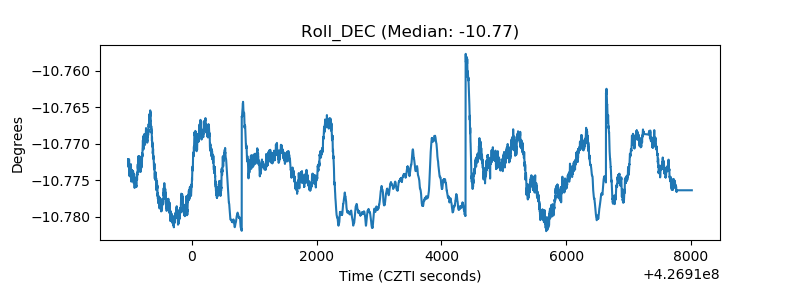 |
| _Roll_RA | 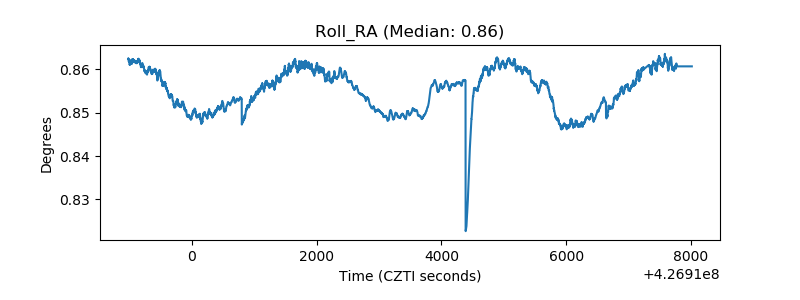 |
| Veto Counter | 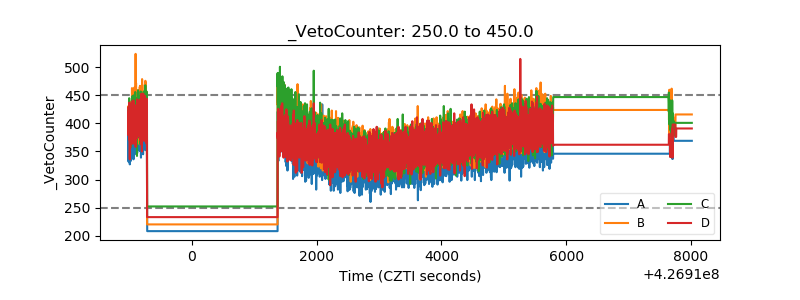 |