| Param | Original file | Final file |
|---|---|---|
| Filename | modeM0/AS1A12_044T22_9000005750_42116cztM0_level2.fits | modeM0/AS1A12_044T22_9000005750_42116cztM0_level2_quad_clean.evt |
| Size (bytes) | 358,727,040 | 92,436,480 |
| Size | 342.1 MB | 88.2 MB |
| Events in quadrant A | 3,501,522 | 617,828 |
| Events in quadrant B | 2,502,533 | 640,104 |
| Events in quadrant C | 2,672,392 | 611,347 |
| Events in quadrant D | 4,155,213 | 527,825 |
| Mode M0 | |||
|---|---|---|---|
| Quadrant | BADHDUFLAG | Total packets | Discarded packets |
| A | 0 | 14109 | 1 |
| B | 0 | 11593 | 1 |
| C | 0 | 11568 | 1 |
| D | 0 | 16375 | 1 |
| Mode M9 | |||
|---|---|---|---|
| Quadrant | BADHDUFLAG | Total packets | Discarded packets |
| A | 0 | 15 | 0 |
| B | 0 | 15 | 0 |
| C | 0 | 15 | 0 |
| D | 0 | 15 | 0 |
| Mode SS | |||
|---|---|---|---|
| Quadrant | BADHDUFLAG | Total packets | Discarded packets |
| A | 0 | 118 | 0 |
| B | 0 | 118 | 0 |
| C | 0 | 118 | 0 |
| D | 0 | 118 | 0 |
| Quadrant | Total seconds | Saturated seconds | Saturation percentage |
|---|---|---|---|
| A | 5742 | 19 | 0.330895% |
| B | 5743 | 12 | 0.208950% |
| C | 5743 | 5 | 0.087063% |
| D | 5743 | 427 | 7.435138% |
Noise dominated data is calculated using 1-second bins in cleaned event files. If a bin has >2000 counts, and if more than 50% of those come from <1% of pixels, then it is considered to be noise-dominated and hence unusable.
| Quadrant | # 1 sec bins | Bins with >0 counts | Bins with >2000 counts | High rate bins dominated by noise | Noise dominated (total time) | Noise dominated (detector-on time) | Marked lightcurve |
|---|---|---|---|---|---|---|---|
| A | 7235 | 5743 | 3 | 3 | 0.04% | 0.05% | 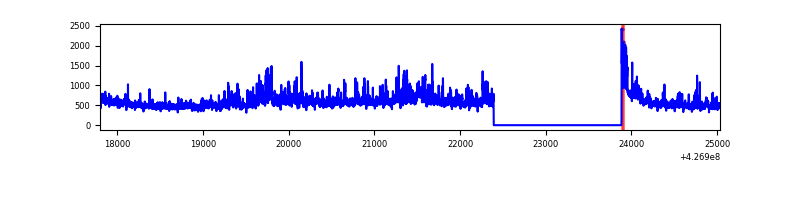 |
| B | 7236 | 5744 | 4 | 4 | 0.06% | 0.07% | 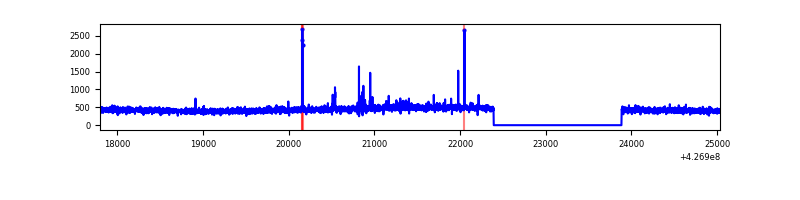 |
| C | 7236 | 5744 | 3 | 3 | 0.04% | 0.05% | 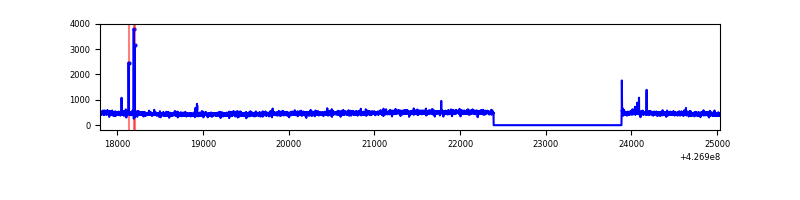 |
| D | 7236 | 5744 | 359 | 359 | 4.96% | 6.25% | 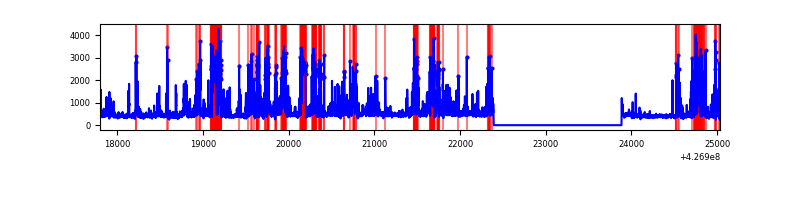 |
Top three noisy pixels from each quadrant. If the there are fewer than three noisy pixels in the level2.evt file, extra rows are filled as -1
| Pixel properties | Quadrant properties | ||||||
|---|---|---|---|---|---|---|---|
| Quadrant | DetID | PixID | Counts | Sigma | Mean | Median | Sigma |
| A | 15 | 222 | 539730 | 4098.27 | 634 | 620 | 131.5 |
| A | 10 | 83 | 508589 | 3861.54 | 634 | 620 | 131.5 |
| A | 3 | 137 | 7186 | 49.91 | 634 | 620 | 131.5 |
| B | 3 | 112 | 26273 | 205.57 | 627 | 611 | 124.8 |
| B | 12 | 111 | 15809 | 121.75 | 627 | 611 | 124.8 |
| B | 11 | 111 | 14635 | 112.34 | 627 | 611 | 124.8 |
| C | 15 | 214 | 236922 | 1617.4 | 617 | 620 | 146.1 |
| C | 8 | 79 | 27948 | 187.05 | 617 | 620 | 146.1 |
| C | 13 | 61 | 4127 | 24.0 | 617 | 620 | 146.1 |
| D | 13 | 249 | 1024191 | 7011.63 | 596 | 580 | 146.0 |
| D | 12 | 233 | 467300 | 3196.99 | 596 | 580 | 146.0 |
| D | 1 | 52 | 185288 | 1265.23 | 596 | 580 | 146.0 |
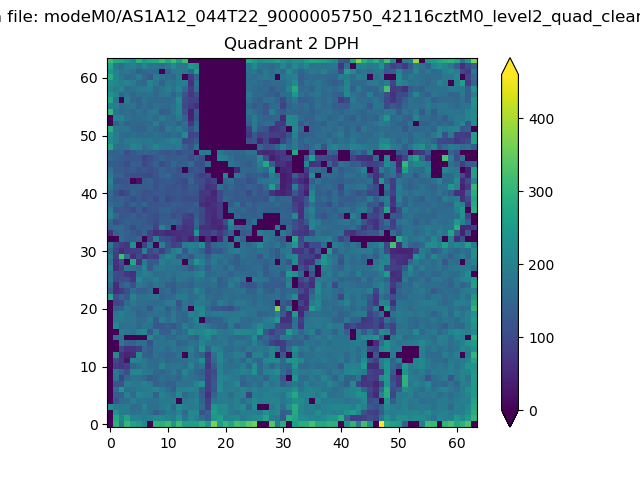
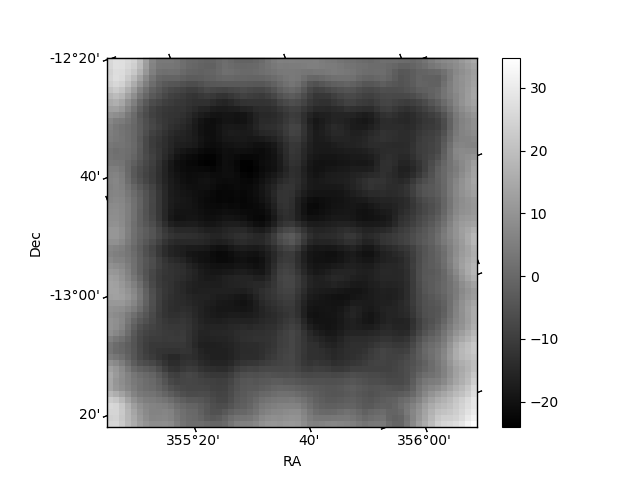
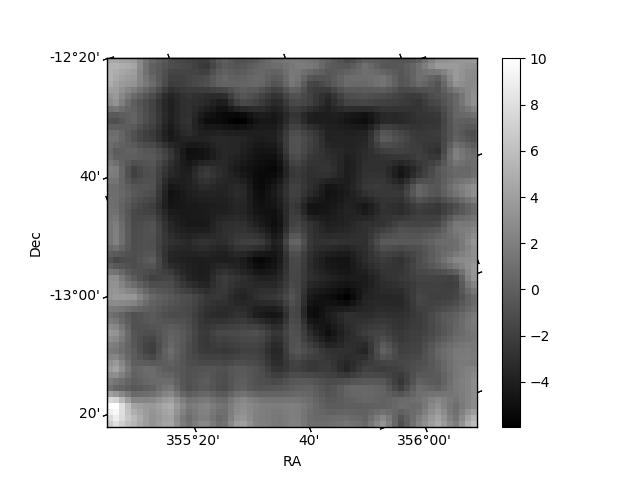
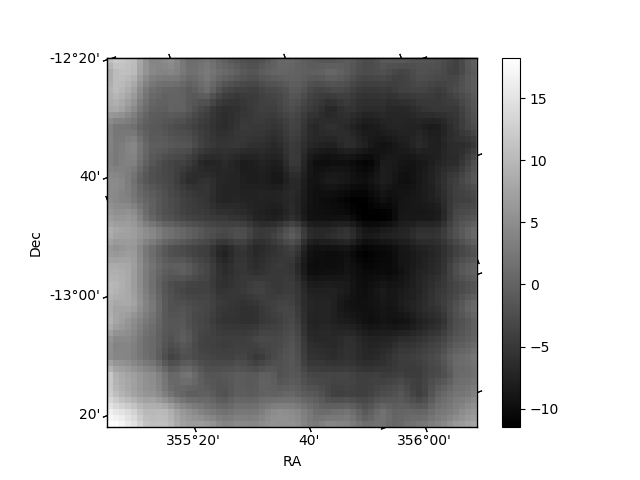
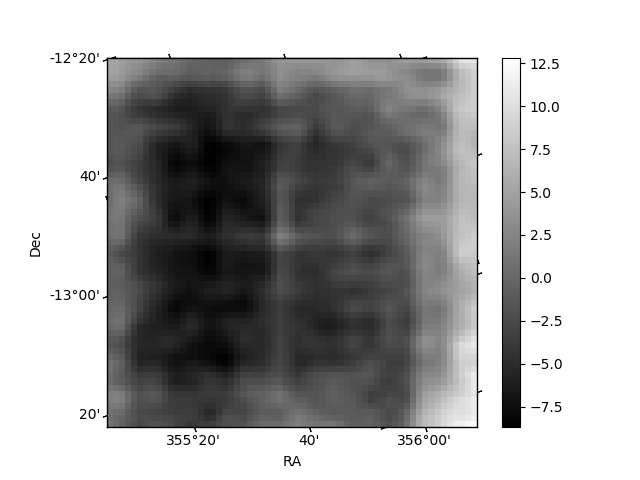
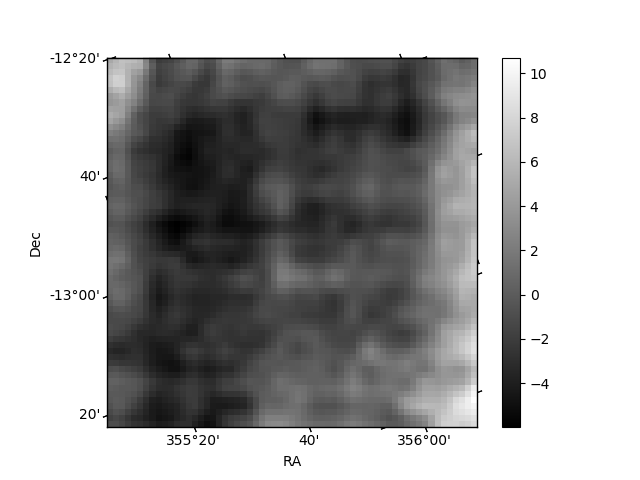
Histogram calculated using DETX and DETY for each event in the final _common_clean file
| Quadrant A | 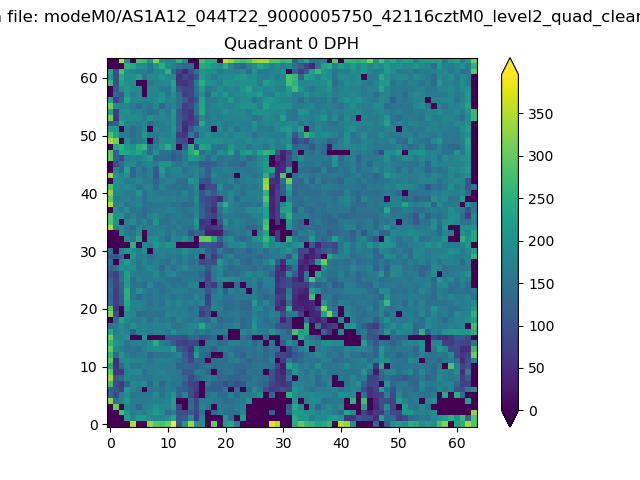 |
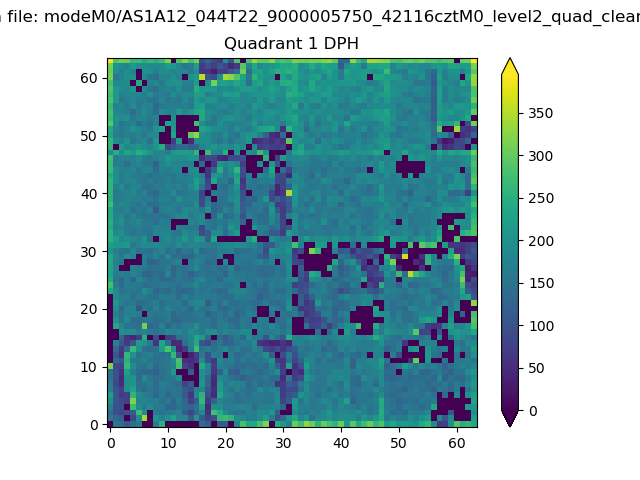 |
Quadrant B |
|---|---|---|---|
| Quadrant D | 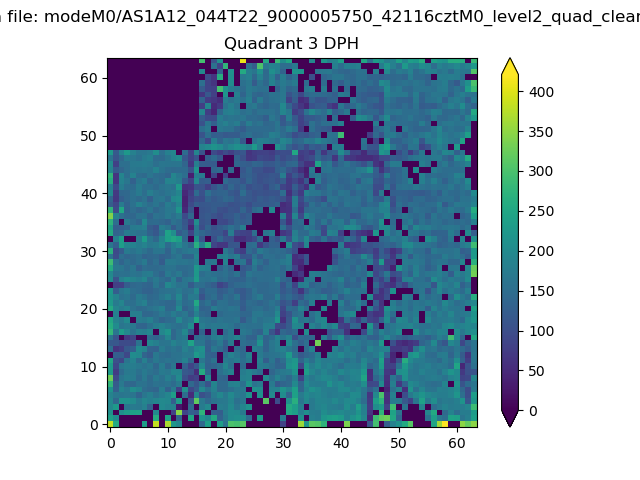 |
 |
Quadrant C |
| Plot type | Count rate plots | Images |
|---|---|---|
| Comparison with Poisson distribution Blue bars denote a histogram of data divided into 1 sec bins. Red curve is a Poisson curve with rate = median count rate of data. |
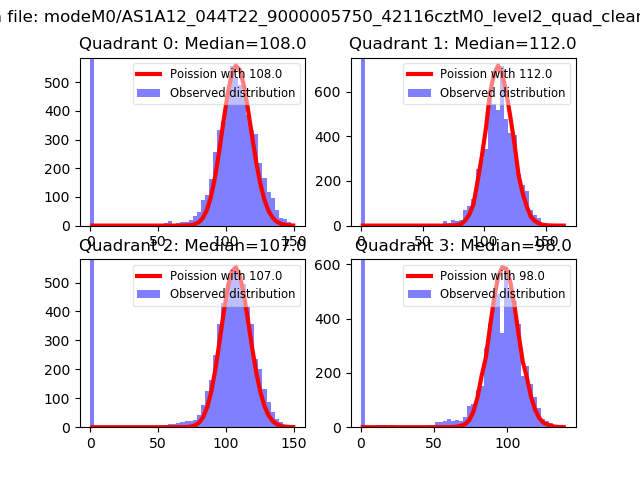 |
 |
| Quadrant-wise count rates Data is divided into 100 sec bins |
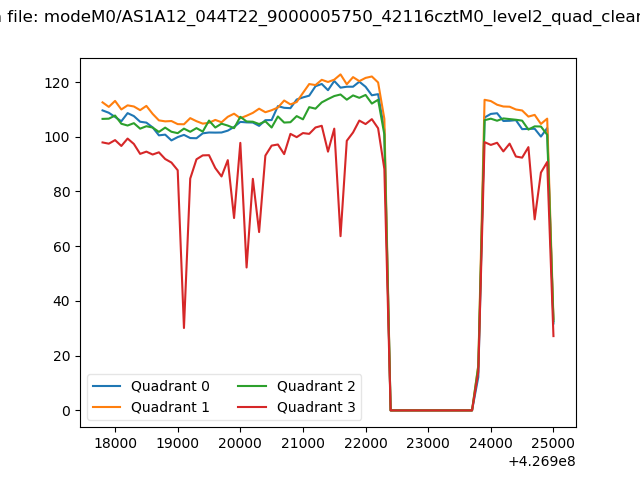 |
|
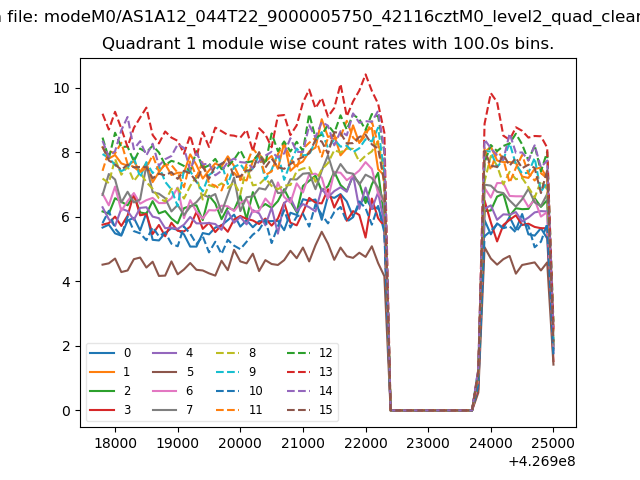
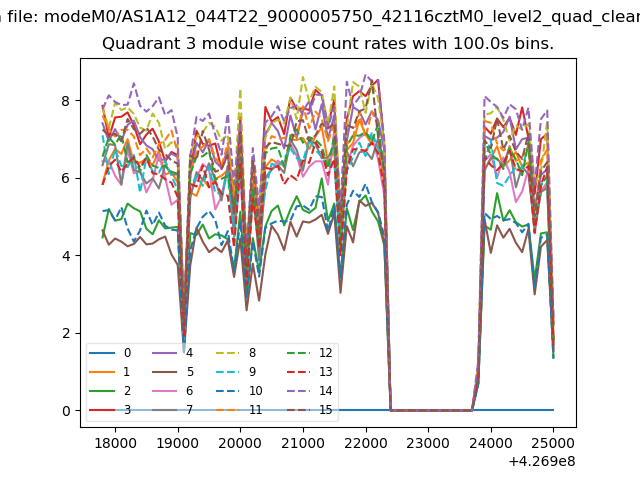
| Module-wise count rates for Quadrant A Data is divided into 100 sec bins |
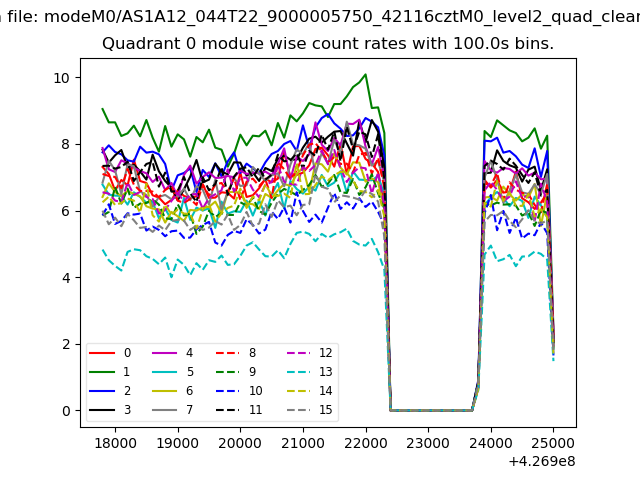 |
 |
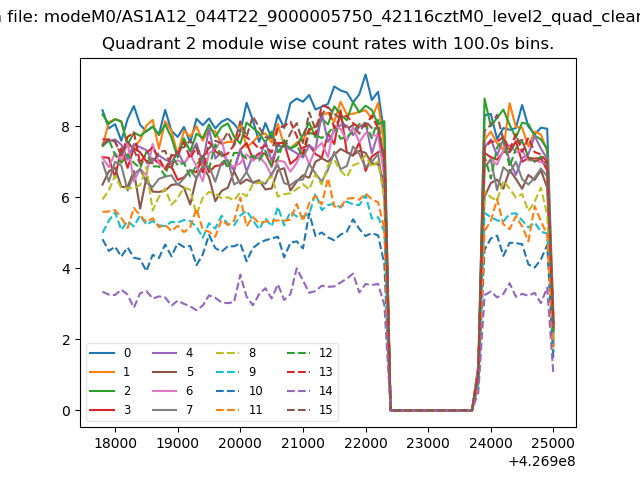
| Module-wise count rates for Quadrant B Data is divided into 100 sec bins |
 |
 |
| Module-wise count rates for Quadrant C Data is divided into 100 sec bins |
 |
 |
| Module-wise count rates for Quadrant D Data is divided into 100 sec bins |
 |
 |
| Parameter | Plot |
|---|---|
| CZT HV Monitor | 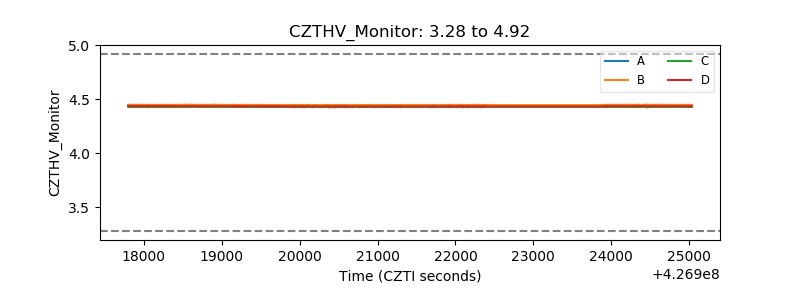 |
| D_VDD | 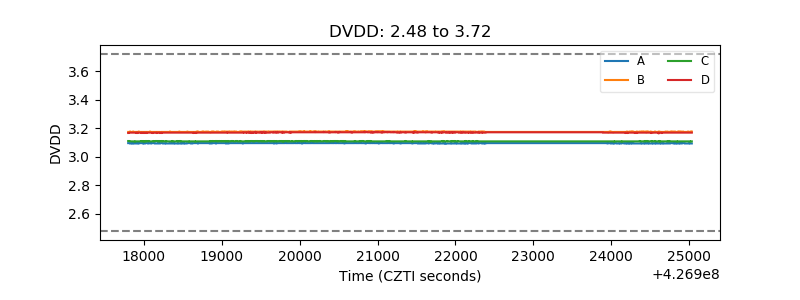 |
| Temperature 1 | 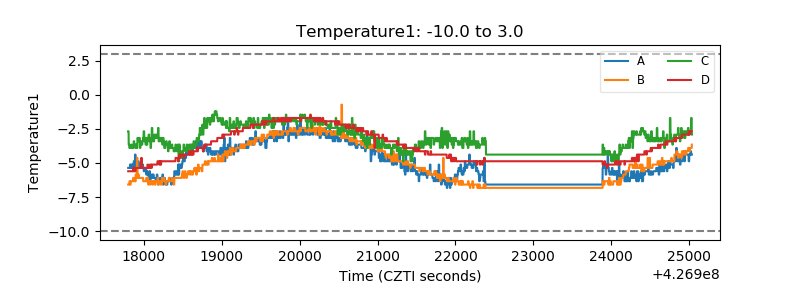 |
| Veto HV Monitor | 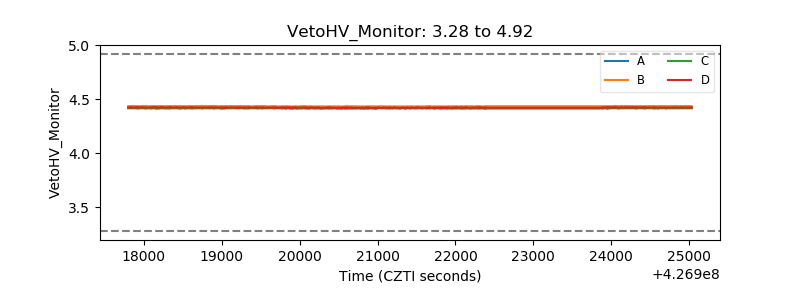 |
| Veto LLD | 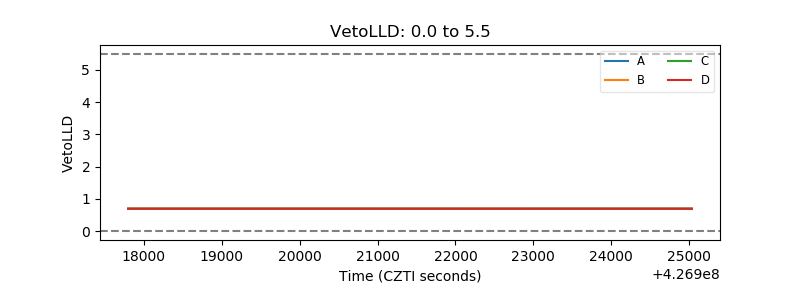 |
| Alpha Counter | 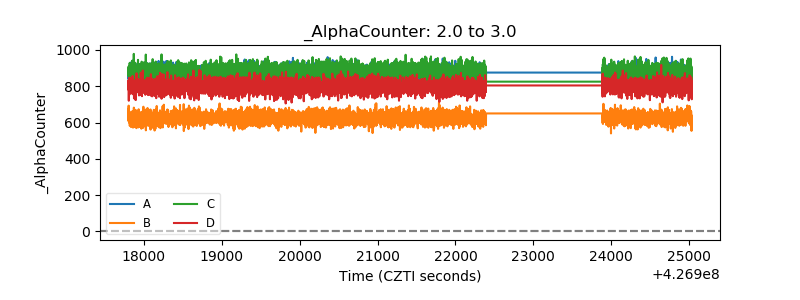 |
| _CPM_Rate |  |
| CZT Counter | 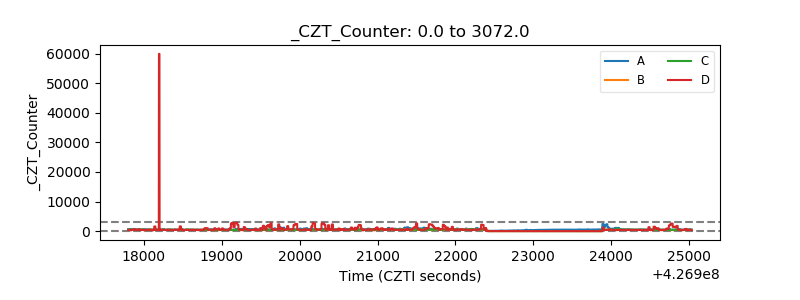 |
| +2.5 Volts monitor | 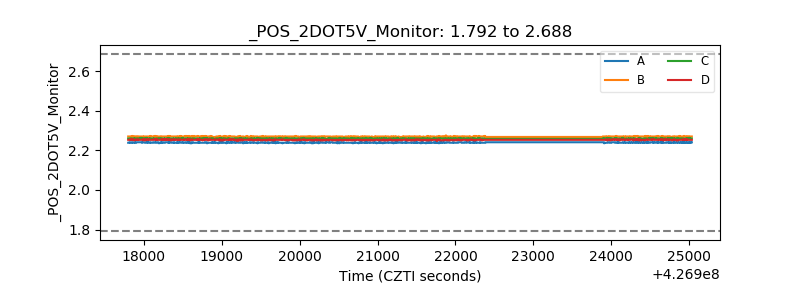 |
| +5 Volts monitor | 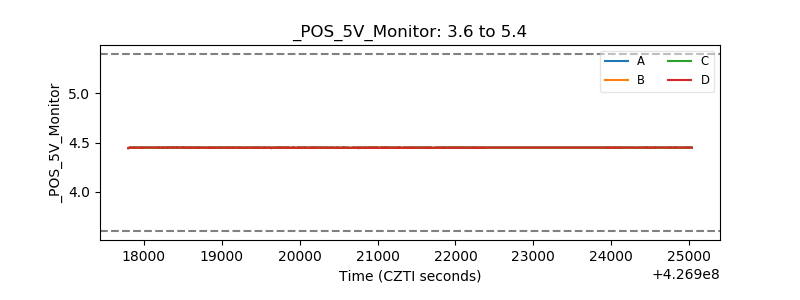 |
| _ROLL_ROT | 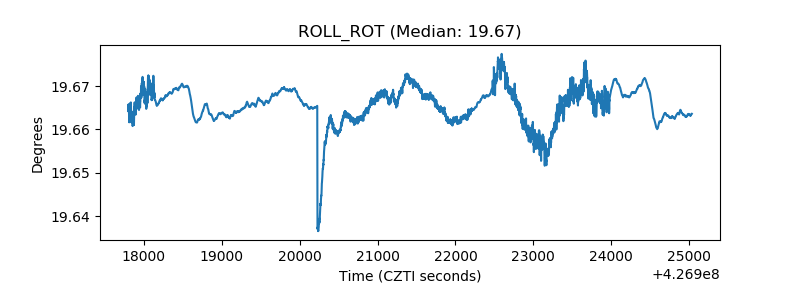 |
| _Roll_DEC | 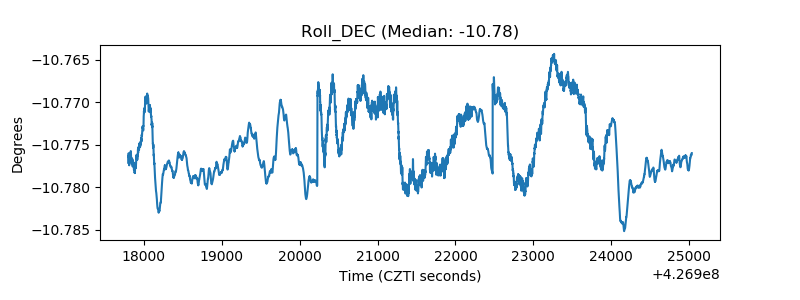 |
| _Roll_RA | 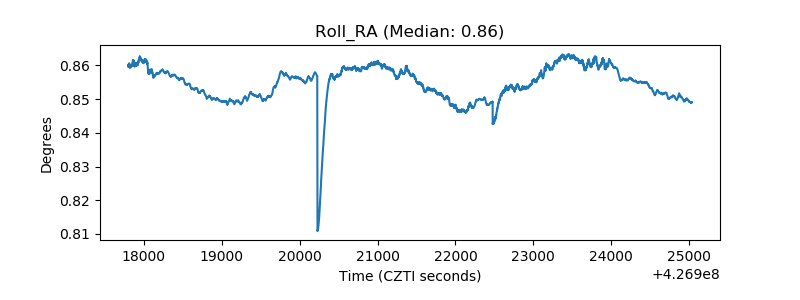 |
| Veto Counter | 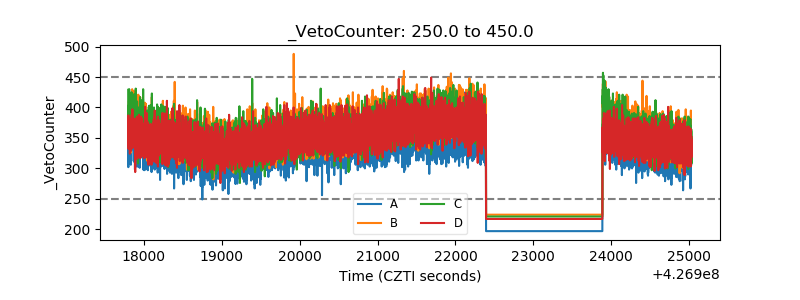 |