| Param | Original file | Final file |
|---|---|---|
| Filename | modeM0/AS1A12_044T22_9000005750_42117cztM0_level2.fits | modeM0/AS1A12_044T22_9000005750_42117cztM0_level2_quad_clean.evt |
| Size (bytes) | 345,228,480 | 90,694,080 |
| Size | 329.2 MB | 86.5 MB |
| Events in quadrant A | 3,612,291 | 603,519 |
| Events in quadrant B | 2,446,322 | 623,743 |
| Events in quadrant C | 2,676,925 | 595,526 |
| Events in quadrant D | 3,605,563 | 530,039 |
| Mode M0 | |||
|---|---|---|---|
| Quadrant | BADHDUFLAG | Total packets | Discarded packets |
| A | 0 | 14503 | 1 |
| B | 0 | 11282 | 1 |
| C | 0 | 11428 | 1 |
| D | 0 | 14709 | 1 |
| Mode M9 | |||
|---|---|---|---|
| Quadrant | BADHDUFLAG | Total packets | Discarded packets |
| A | 0 | 13 | 0 |
| B | 0 | 13 | 0 |
| C | 0 | 13 | 0 |
| D | 0 | 13 | 0 |
| Mode SS | |||
|---|---|---|---|
| Quadrant | BADHDUFLAG | Total packets | Discarded packets |
| A | 0 | 114 | 0 |
| B | 0 | 114 | 0 |
| C | 0 | 114 | 0 |
| D | 0 | 114 | 0 |
| Quadrant | Total seconds | Saturated seconds | Saturation percentage |
|---|---|---|---|
| A | 5624 | 23 | 0.408962% |
| B | 5624 | 6 | 0.106686% |
| C | 5625 | 3 | 0.053333% |
| D | 5625 | 244 | 4.337778% |
Noise dominated data is calculated using 1-second bins in cleaned event files. If a bin has >2000 counts, and if more than 50% of those come from <1% of pixels, then it is considered to be noise-dominated and hence unusable.
| Quadrant | # 1 sec bins | Bins with >0 counts | Bins with >2000 counts | High rate bins dominated by noise | Noise dominated (total time) | Noise dominated (detector-on time) | Marked lightcurve |
|---|---|---|---|---|---|---|---|
| A | 6936 | 5625 | 7 | 7 | 0.10% | 0.12% | 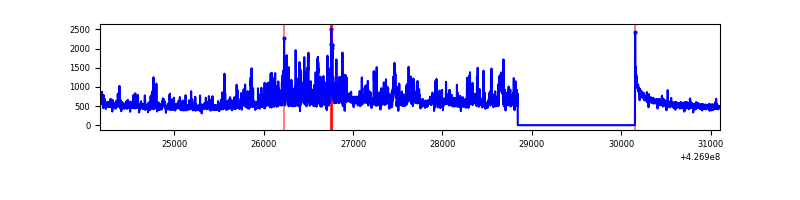 |
| B | 6936 | 5625 | 0 | 0 | 0.00% | 0.00% | 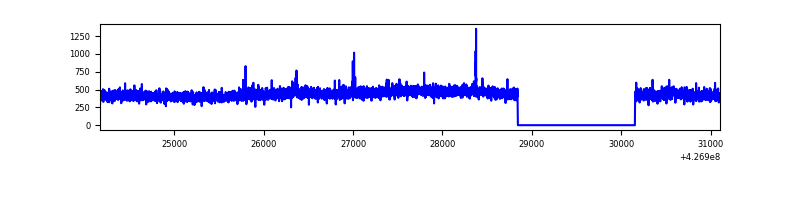 |
| C | 6937 | 5626 | 0 | 0 | 0.00% | 0.00% | 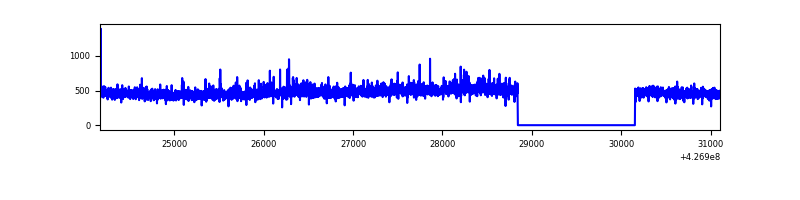 |
| D | 6937 | 5626 | 222 | 222 | 3.20% | 3.95% | 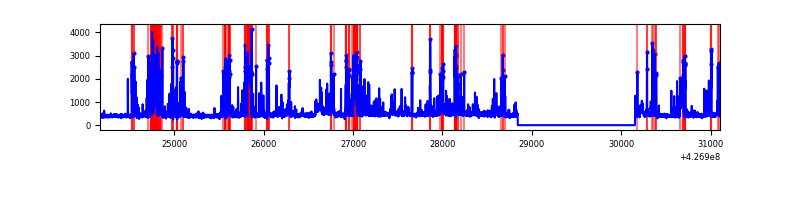 |
Top three noisy pixels from each quadrant. If the there are fewer than three noisy pixels in the level2.evt file, extra rows are filled as -1
| Pixel properties | Quadrant properties | ||||||
|---|---|---|---|---|---|---|---|
| Quadrant | DetID | PixID | Counts | Sigma | Mean | Median | Sigma |
| A | 15 | 222 | 742601 | 5776.21 | 621 | 607 | 128.5 |
| A | 10 | 83 | 462019 | 3591.96 | 621 | 607 | 128.5 |
| A | 3 | 137 | 7231 | 51.57 | 621 | 607 | 128.5 |
| B | 12 | 111 | 15881 | 125.32 | 616 | 598 | 122.0 |
| B | 11 | 111 | 14647 | 115.2 | 616 | 598 | 122.0 |
| B | 14 | 111 | 14103 | 110.74 | 616 | 598 | 122.0 |
| C | 15 | 214 | 230284 | 1604.26 | 607 | 611 | 143.2 |
| C | 8 | 79 | 77024 | 533.74 | 607 | 611 | 143.2 |
| C | 13 | 61 | 4081 | 24.24 | 607 | 611 | 143.2 |
| D | 13 | 249 | 518844 | 3486.72 | 596 | 578 | 148.6 |
| D | 12 | 233 | 441664 | 2967.48 | 596 | 578 | 148.6 |
| D | 1 | 52 | 146570 | 982.18 | 596 | 578 | 148.6 |
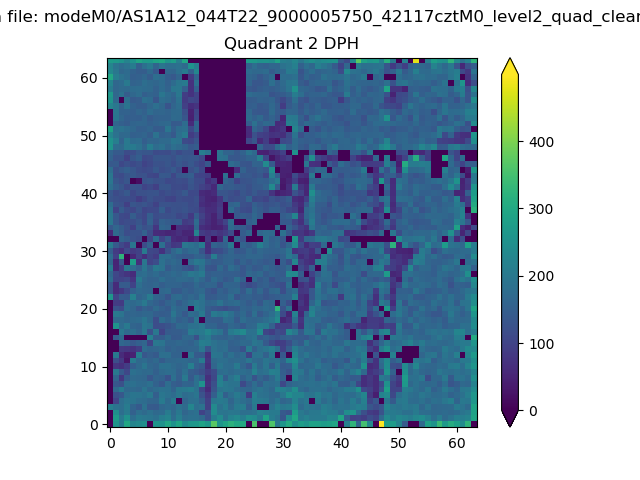
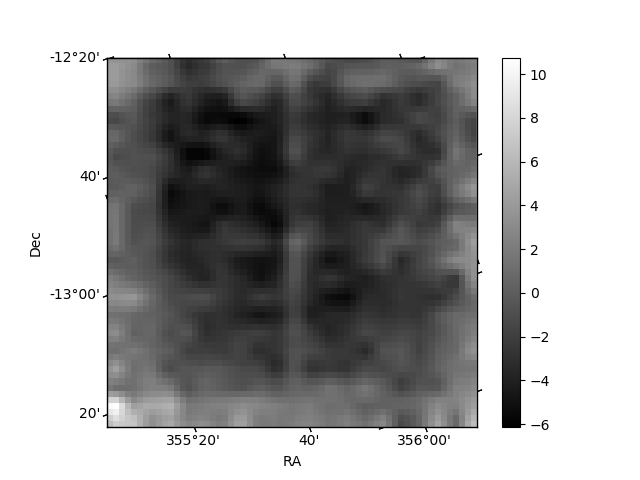
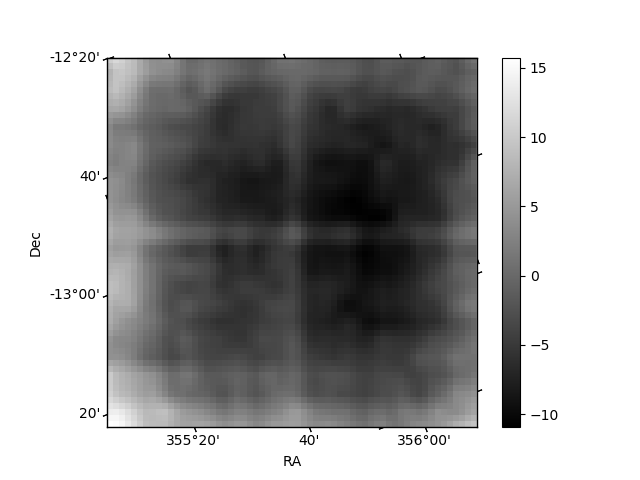
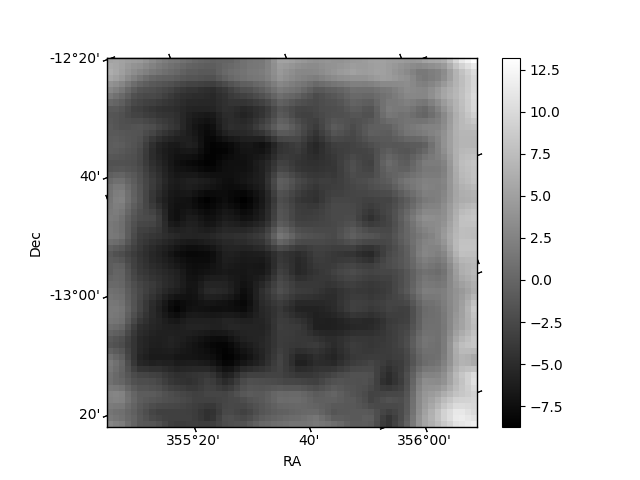
Histogram calculated using DETX and DETY for each event in the final _common_clean file
| Quadrant A |  |
 |
Quadrant B |
|---|---|---|---|
| Quadrant D | 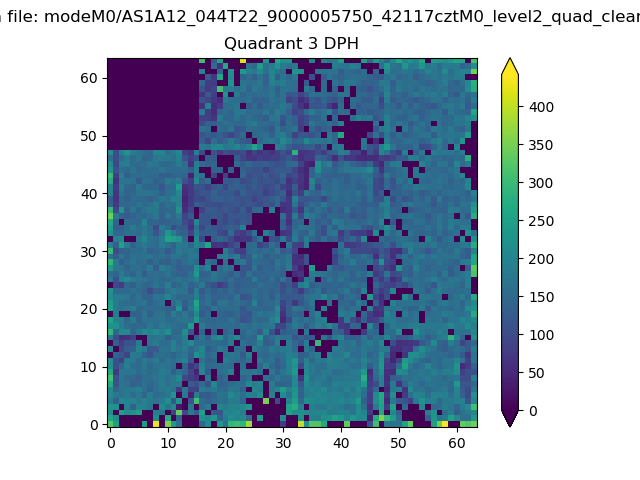 |
 |
Quadrant C |
| Plot type | Count rate plots | Images |
|---|---|---|
| Comparison with Poisson distribution Blue bars denote a histogram of data divided into 1 sec bins. Red curve is a Poisson curve with rate = median count rate of data. |
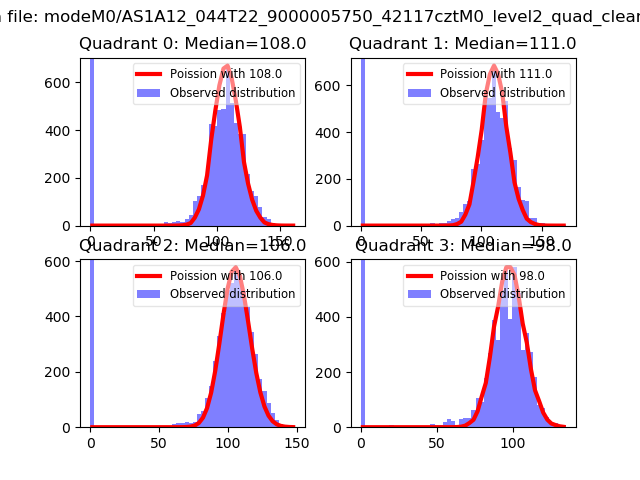 |
 |
| Quadrant-wise count rates Data is divided into 100 sec bins |
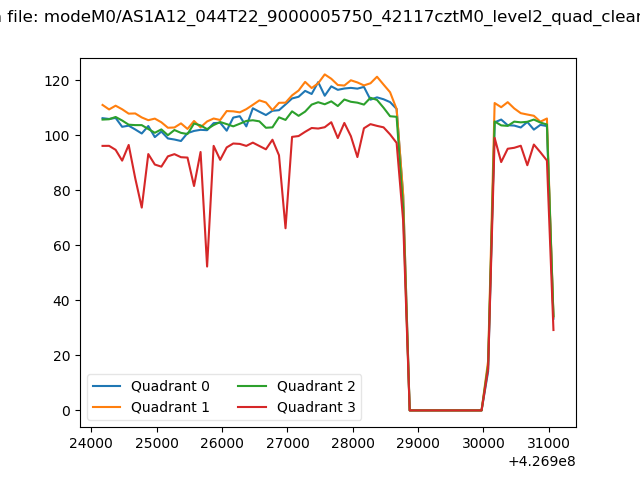 |
|
| Module-wise count rates for Quadrant A Data is divided into 100 sec bins |
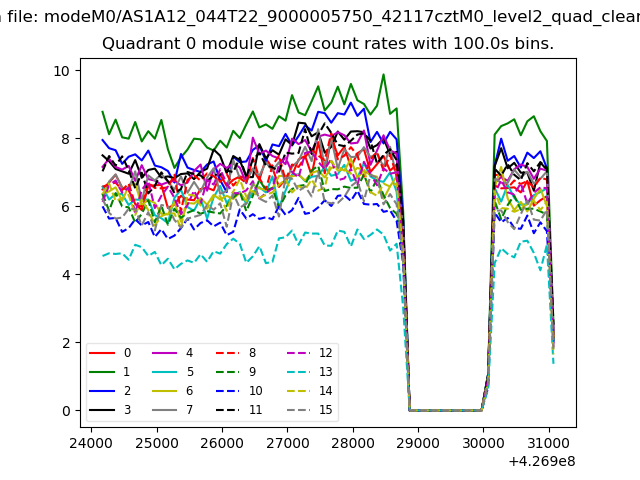 |
 |
| Module-wise count rates for Quadrant B Data is divided into 100 sec bins |
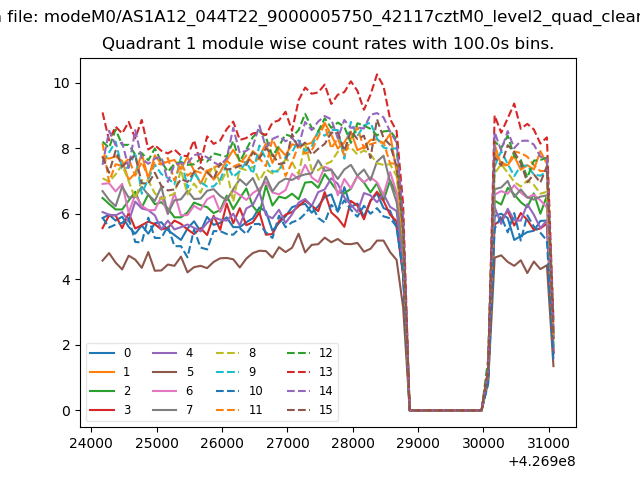 |
 |
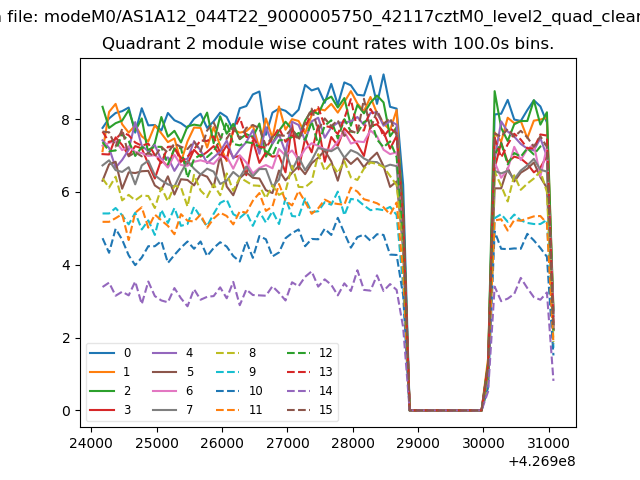
| Module-wise count rates for Quadrant C Data is divided into 100 sec bins |
 |
 |
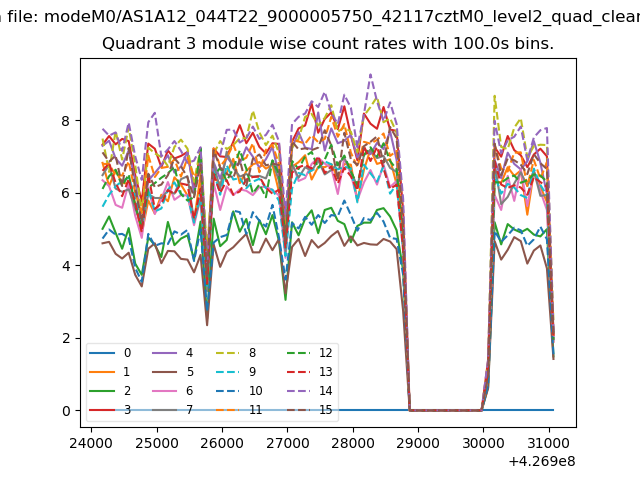
| Module-wise count rates for Quadrant D Data is divided into 100 sec bins |
 |
 |
| Parameter | Plot |
|---|---|
| CZT HV Monitor | 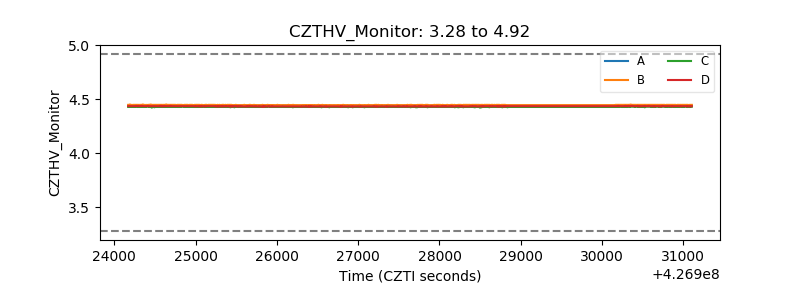 |
| D_VDD | 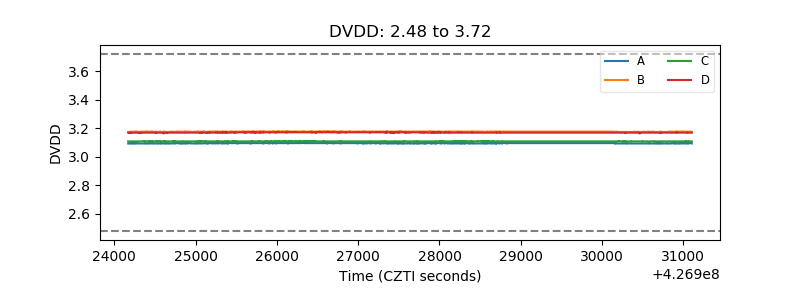 |
| Temperature 1 | 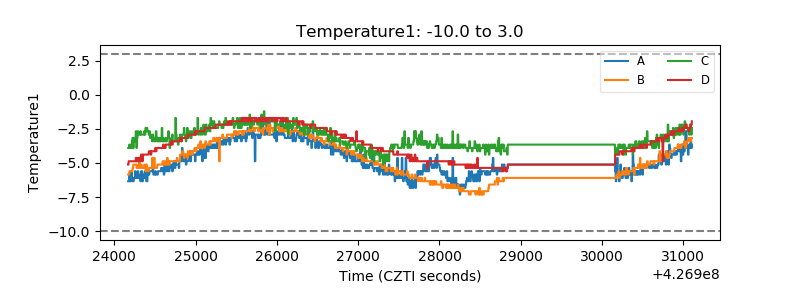 |
| Veto HV Monitor | 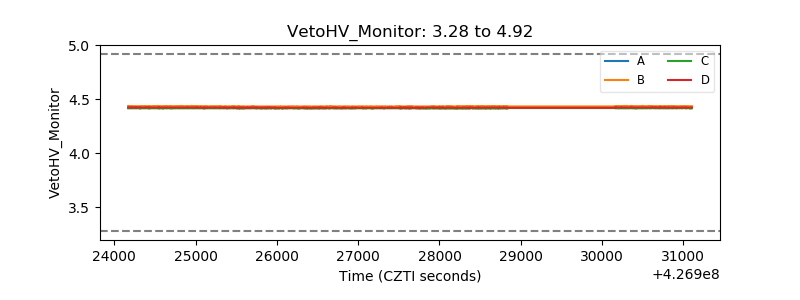 |
| Veto LLD | 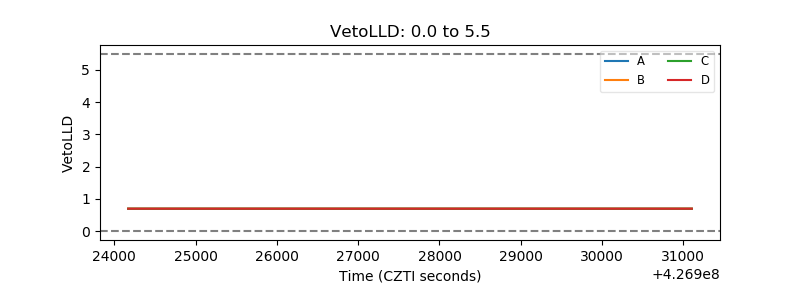 |
| Alpha Counter | 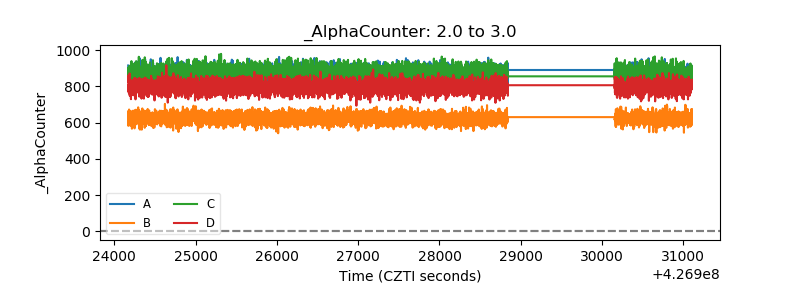 |
| _CPM_Rate | 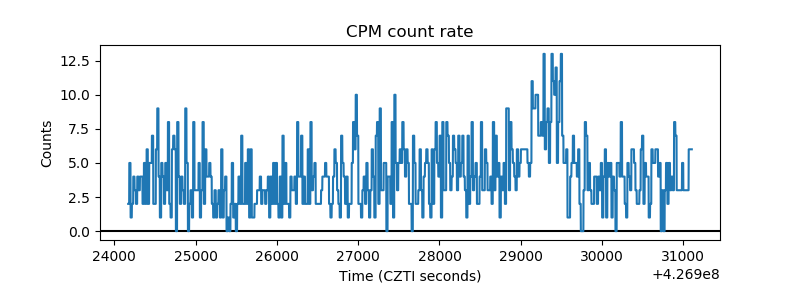 |
| CZT Counter | 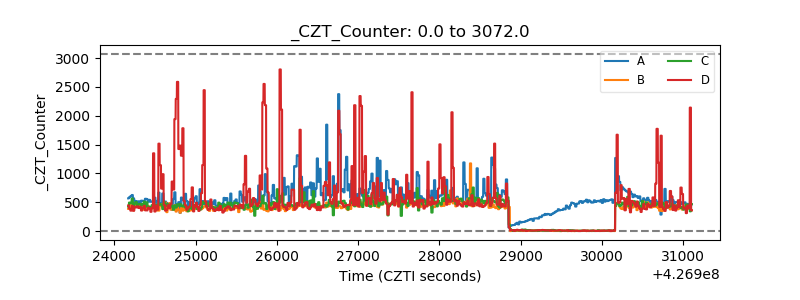 |
| +2.5 Volts monitor | 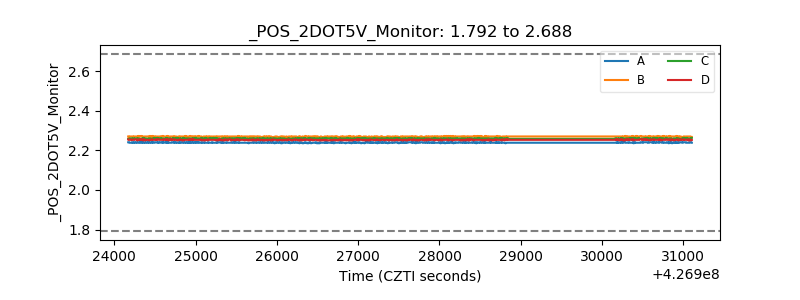 |
| +5 Volts monitor | 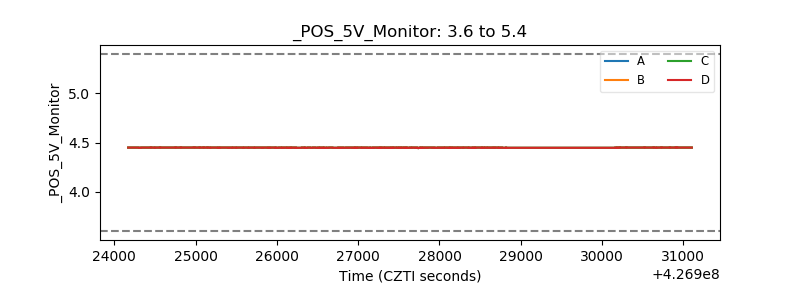 |
| _ROLL_ROT | 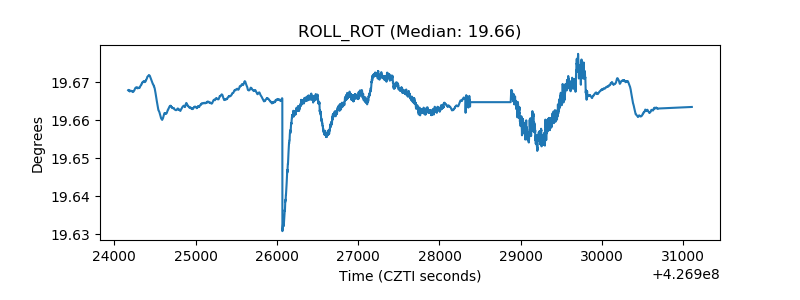 |
| _Roll_DEC | 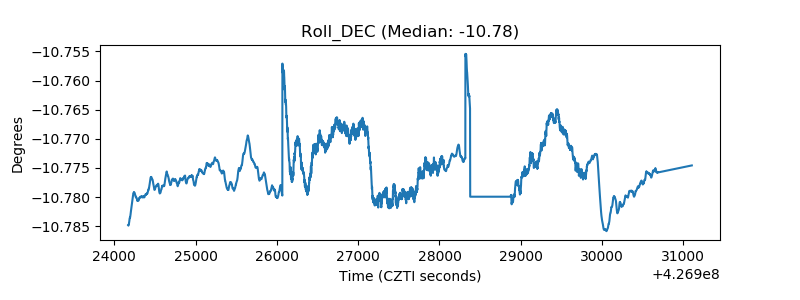 |
| _Roll_RA | 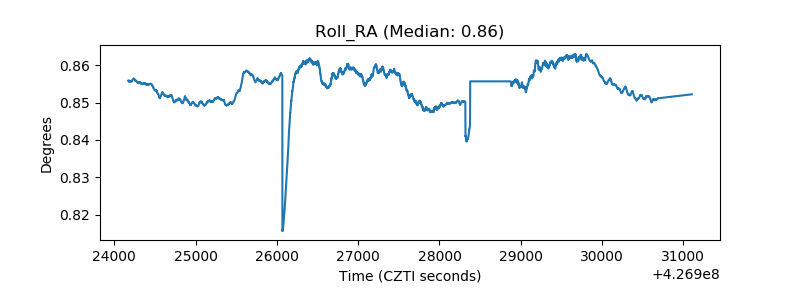 |
| Veto Counter | 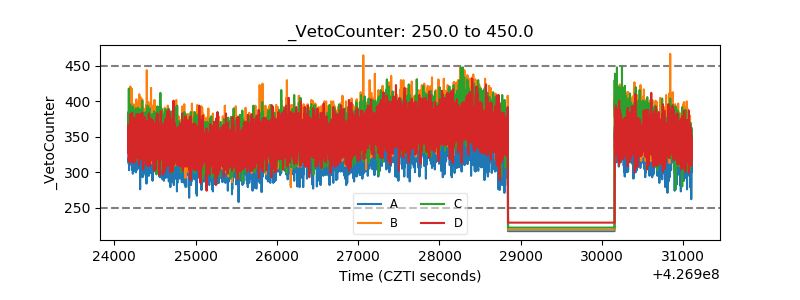 |