| Param | Original file | Final file |
|---|---|---|
| Filename | modeM0/AS1A12_044T22_9000005750_42120cztM0_level2.fits | modeM0/AS1A12_044T22_9000005750_42120cztM0_level2_quad_clean.evt |
| Size (bytes) | 671,754,240 | 169,462,080 |
| Size | 640.6 MB | 161.6 MB |
| Events in quadrant A | 5,980,972 | 1,138,270 |
| Events in quadrant B | 5,405,766 | 1,157,181 |
| Events in quadrant C | 5,047,317 | 1,115,710 |
| Events in quadrant D | 7,599,003 | 976,126 |
| Mode M0 | |||
|---|---|---|---|
| Quadrant | BADHDUFLAG | Total packets | Discarded packets |
| A | 0 | 24210 | 23 |
| B | 0 | 23518 | 11 |
| C | 0 | 21688 | 18 |
| D | 0 | 30011 | 20 |
| Mode M9 | |||
|---|---|---|---|
| Quadrant | BADHDUFLAG | Total packets | Discarded packets |
| A | 0 | 35 | 0 |
| B | 0 | 36 | 0 |
| C | 0 | 36 | 0 |
| D | 0 | 36 | 0 |
| Mode SS | |||
|---|---|---|---|
| Quadrant | BADHDUFLAG | Total packets | Discarded packets |
| A | 0 | 218 | 0 |
| B | 0 | 218 | 0 |
| C | 0 | 218 | 0 |
| D | 0 | 218 | 0 |
| Quadrant | Total seconds | Saturated seconds | Saturation percentage |
|---|---|---|---|
| A | 10737 | 30 | 0.279408% |
| B | 10742 | 147 | 1.368460% |
| C | 10737 | 4 | 0.037254% |
| D | 10742 | 678 | 6.311674% |
Noise dominated data is calculated using 1-second bins in cleaned event files. If a bin has >2000 counts, and if more than 50% of those come from <1% of pixels, then it is considered to be noise-dominated and hence unusable.
| Quadrant | # 1 sec bins | Bins with >0 counts | Bins with >2000 counts | High rate bins dominated by noise | Noise dominated (total time) | Noise dominated (detector-on time) | Marked lightcurve |
|---|---|---|---|---|---|---|---|
| A | 13554 | 10747 | 2 | 2 | 0.01% | 0.02% | 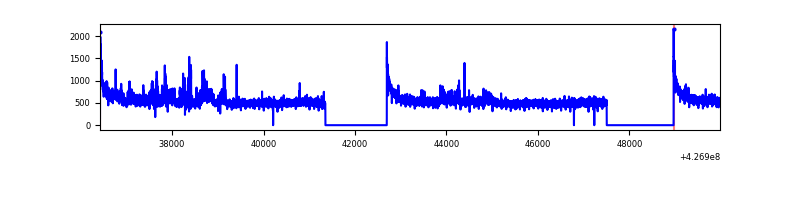 |
| B | 13554 | 10748 | 105 | 105 | 0.77% | 0.98% | 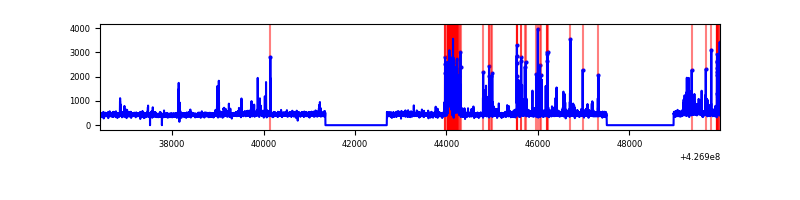 |
| C | 13554 | 10746 | 1 | 1 | 0.01% | 0.01% | 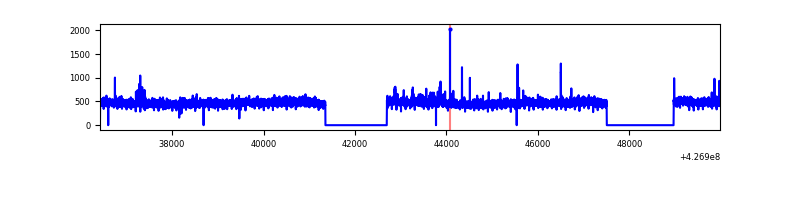 |
| D | 13554 | 10748 | 556 | 556 | 4.10% | 5.17% | 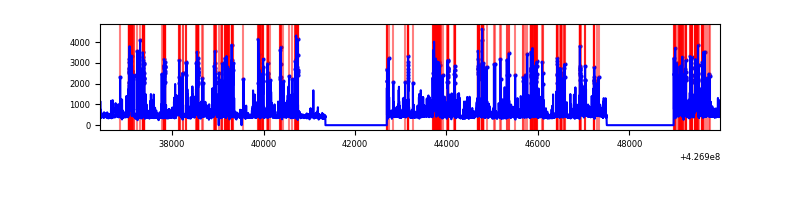 |
Top three noisy pixels from each quadrant. If the there are fewer than three noisy pixels in the level2.evt file, extra rows are filled as -1
| Pixel properties | Quadrant properties | ||||||
|---|---|---|---|---|---|---|---|
| Quadrant | DetID | PixID | Counts | Sigma | Mean | Median | Sigma |
| A | 10 | 83 | 1004051 | 4115.39 | 1188 | 1160 | 243.7 |
| A | 15 | 222 | 276745 | 1130.87 | 1188 | 1160 | 243.7 |
| A | 14 | 24 | 69135 | 278.94 | 1188 | 1160 | 243.7 |
| B | 5 | 255 | 396972 | 1719.51 | 1178 | 1142 | 230.2 |
| B | 3 | 112 | 263644 | 1140.32 | 1178 | 1142 | 230.2 |
| B | 0 | 229 | 89447 | 383.6 | 1178 | 1142 | 230.2 |
| C | 15 | 214 | 440278 | 1615.34 | 1163 | 1169 | 271.8 |
| C | 8 | 79 | 62584 | 225.93 | 1163 | 1169 | 271.8 |
| C | 12 | 249 | 11933 | 39.6 | 1163 | 1169 | 271.8 |
| D | 13 | 249 | 1388080 | 5021.71 | 1131 | 1097 | 276.2 |
| D | 12 | 233 | 703996 | 2544.91 | 1131 | 1097 | 276.2 |
| D | 1 | 52 | 367929 | 1328.15 | 1131 | 1097 | 276.2 |
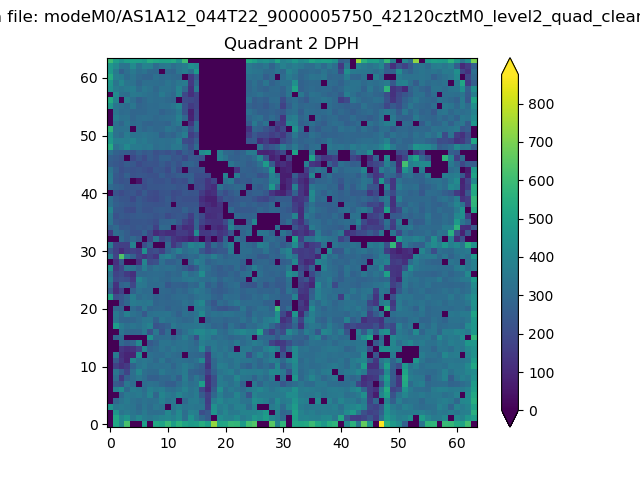
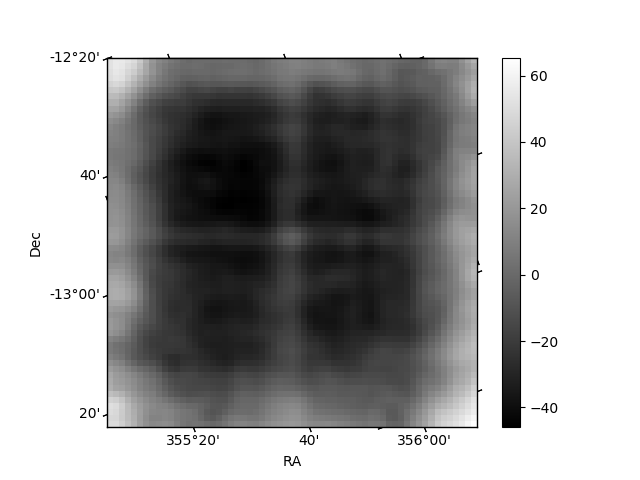
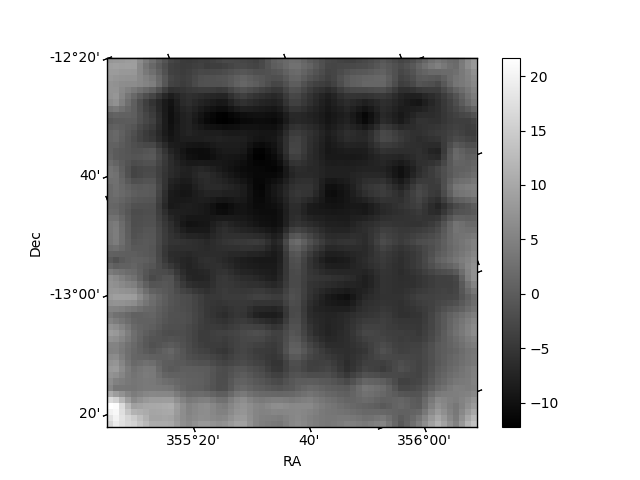
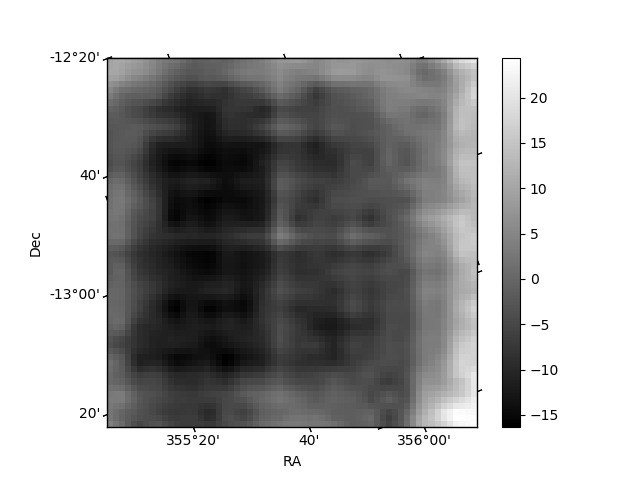
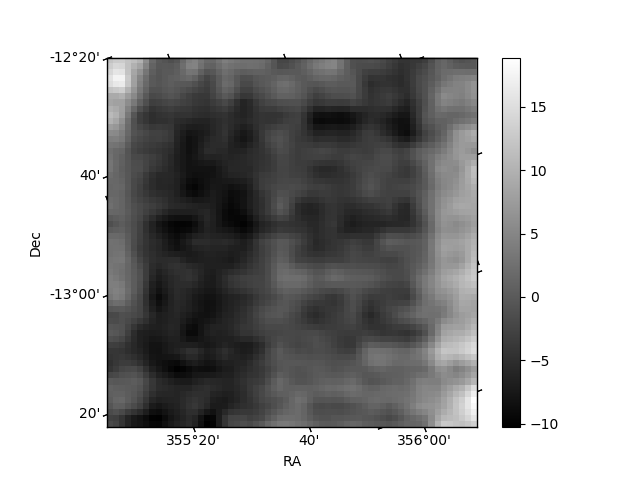
Histogram calculated using DETX and DETY for each event in the final _common_clean file
| Quadrant A | 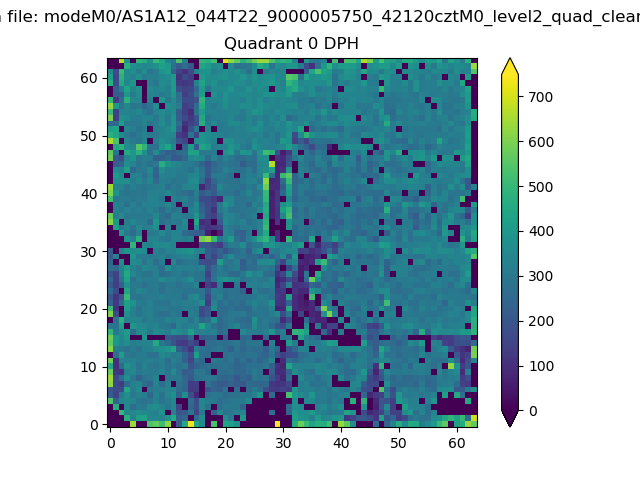 |
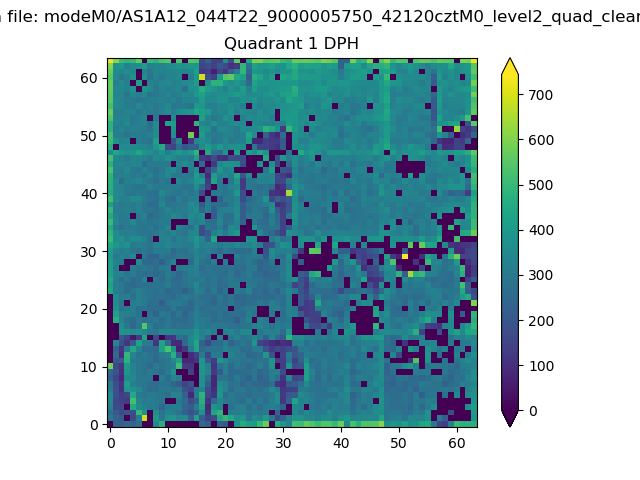 |
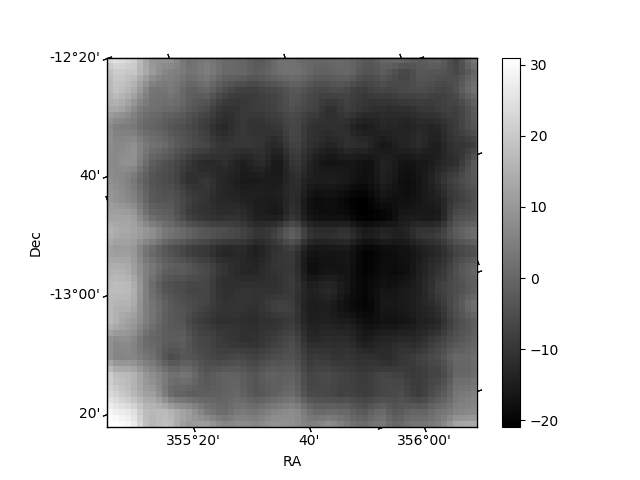
Quadrant B |
|---|---|---|---|
| Quadrant D | 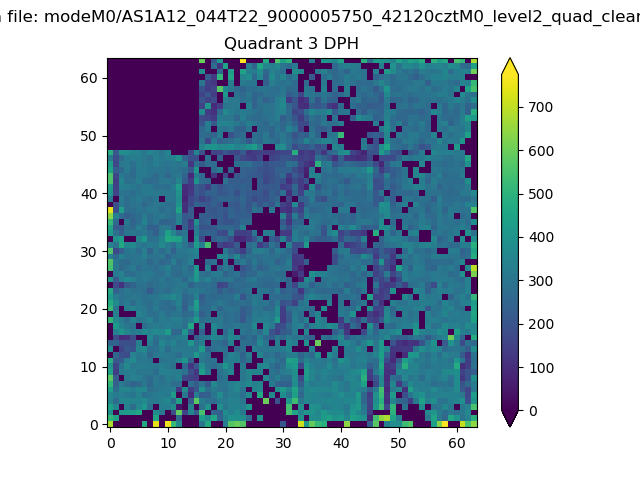 |
 |
Quadrant C |
| Plot type | Count rate plots | Images |
|---|---|---|
| Comparison with Poisson distribution Blue bars denote a histogram of data divided into 1 sec bins. Red curve is a Poisson curve with rate = median count rate of data. |
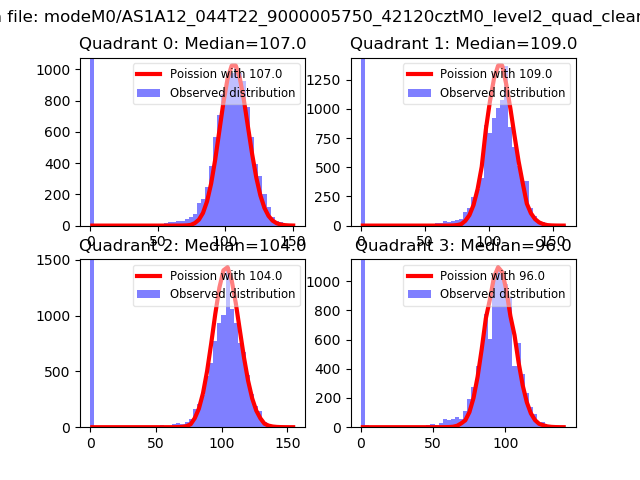 |
 |
| Quadrant-wise count rates Data is divided into 100 sec bins |
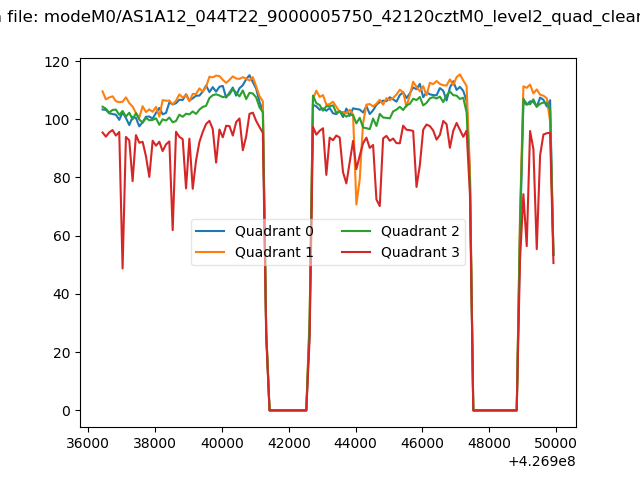 |
|
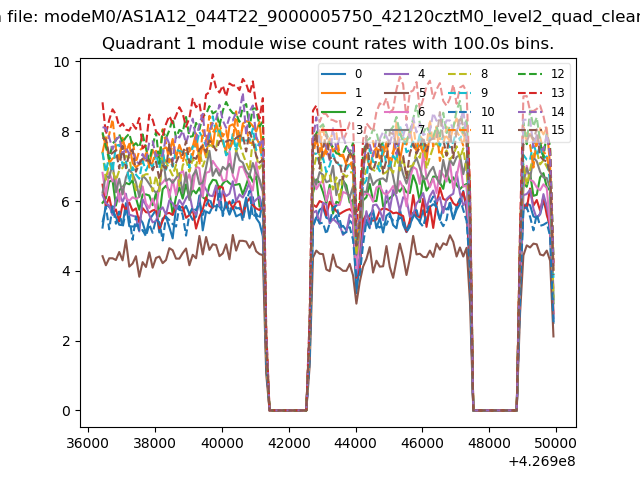
| Module-wise count rates for Quadrant A Data is divided into 100 sec bins |
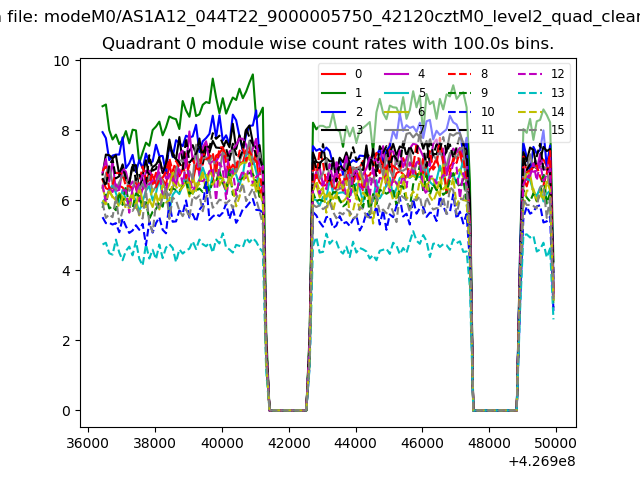 |
 |
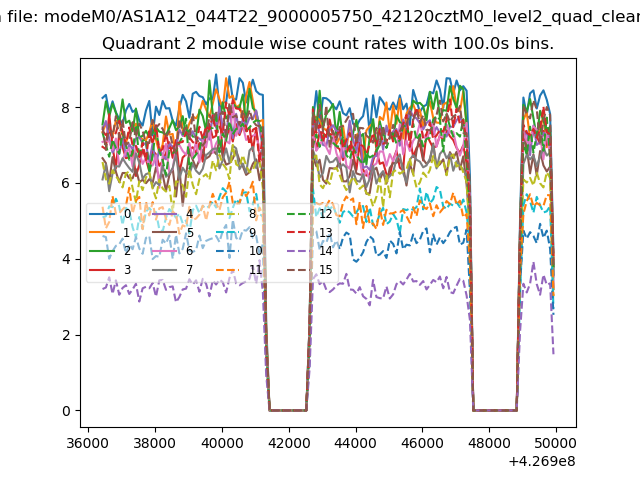
| Module-wise count rates for Quadrant B Data is divided into 100 sec bins |
 |
 |
| Module-wise count rates for Quadrant C Data is divided into 100 sec bins |
 |
 |
| Module-wise count rates for Quadrant D Data is divided into 100 sec bins |
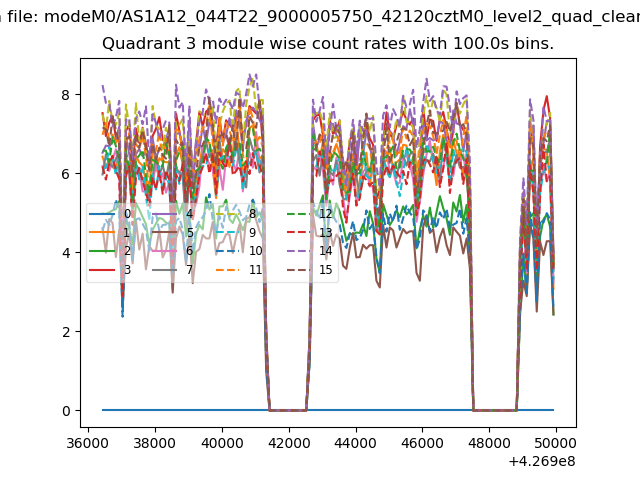 |
 |
| Parameter | Plot |
|---|---|
| CZT HV Monitor |  |
| D_VDD | 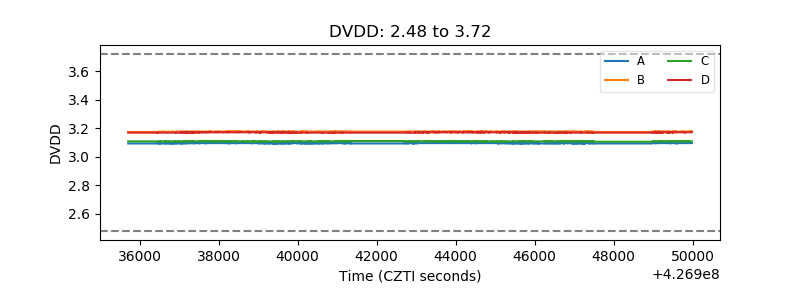 |
| Temperature 1 | 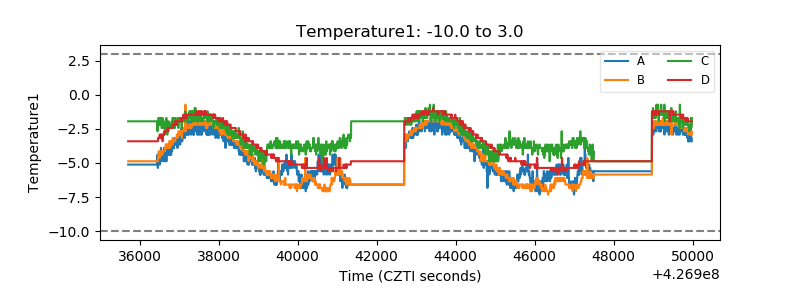 |
| Veto HV Monitor | 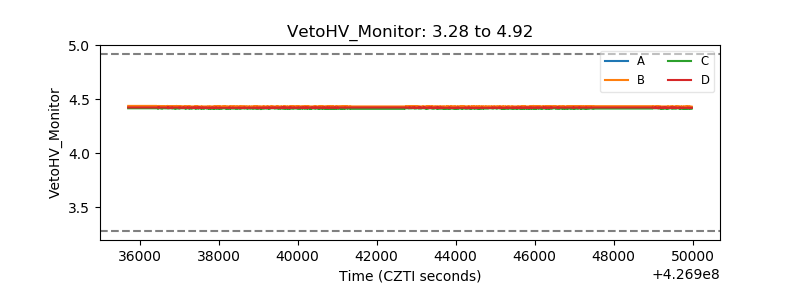 |
| Veto LLD | 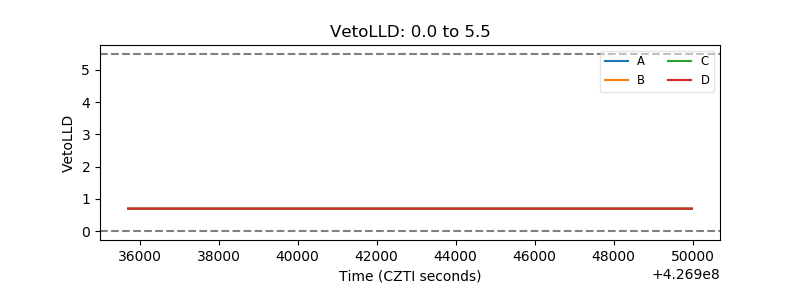 |
| Alpha Counter | 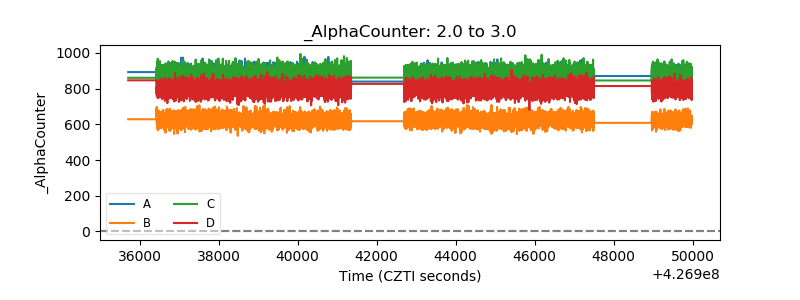 |
| _CPM_Rate | 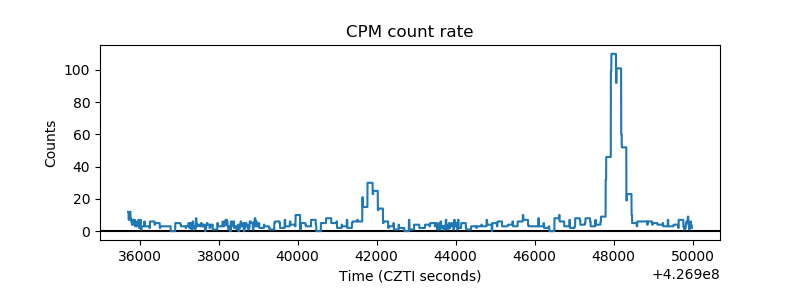 |
| CZT Counter | 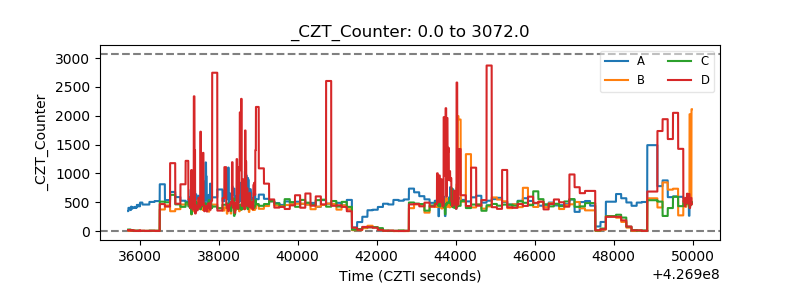 |
| +2.5 Volts monitor | 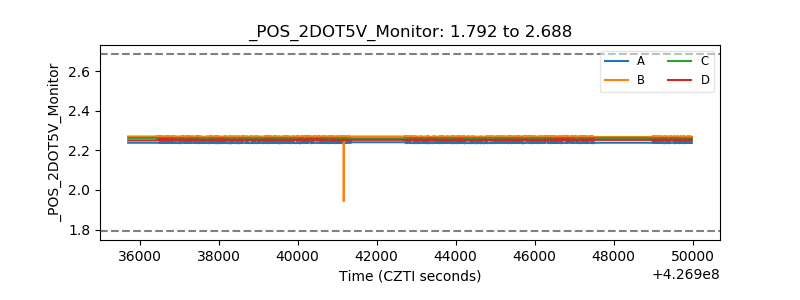 |
| +5 Volts monitor | 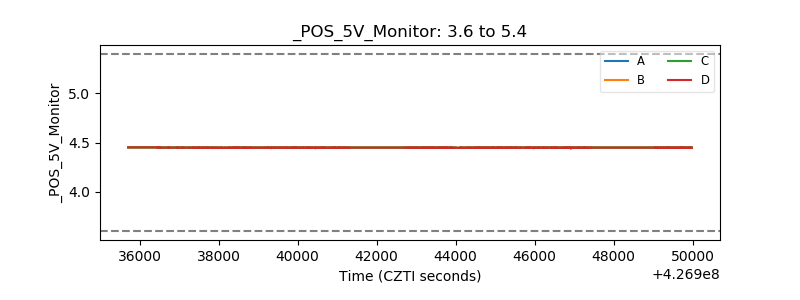 |
| _ROLL_ROT | 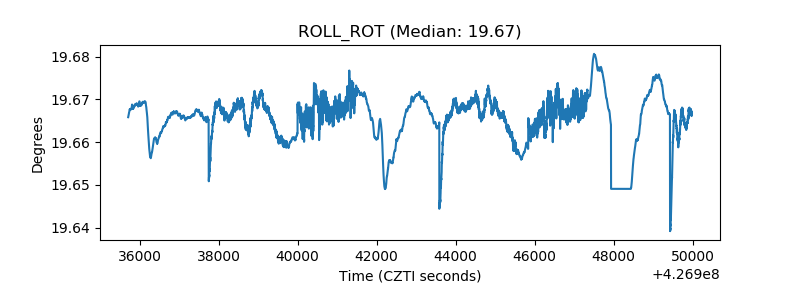 |
| _Roll_DEC | 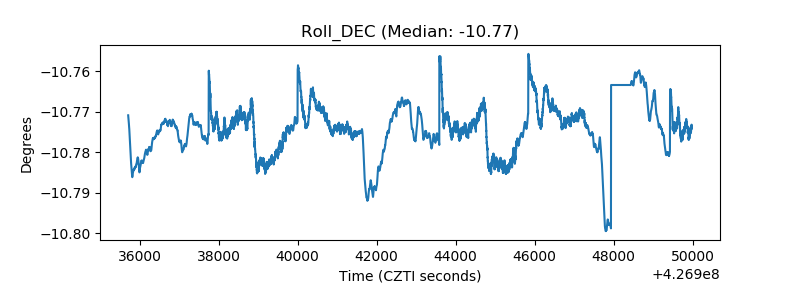 |
| _Roll_RA | 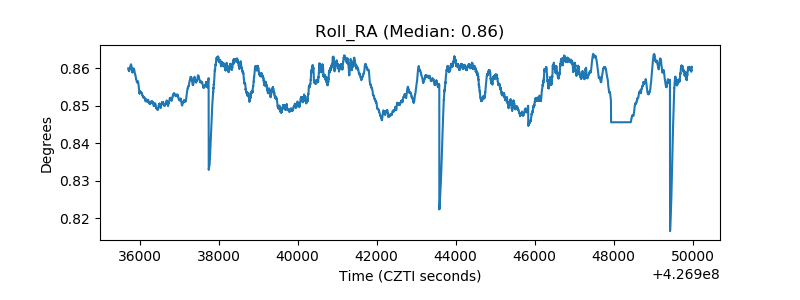 |
| Veto Counter | 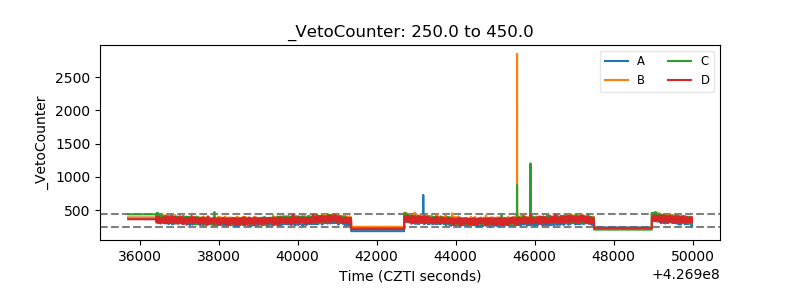 |