| Param | Original file | Final file |
|---|---|---|
| Filename | modeM0/AS1A12_044T22_9000005750_42121cztM0_level2.fits | modeM0/AS1A12_044T22_9000005750_42121cztM0_level2_quad_clean.evt |
| Size (bytes) | 212,440,320 | 48,372,480 |
| Size | 202.6 MB | 46.1 MB |
| Events in quadrant A | 1,628,841 | 331,899 |
| Events in quadrant B | 1,596,855 | 336,616 |
| Events in quadrant C | 1,458,805 | 320,719 |
| Events in quadrant D | 2,937,221 | 255,771 |
| Mode M0 | |||
|---|---|---|---|
| Quadrant | BADHDUFLAG | Total packets | Discarded packets |
| A | 0 | 6698 | 1 |
| B | 0 | 6803 | 1 |
| C | 0 | 6264 | 1 |
| D | 0 | 10876 | 1 |
| Mode M9 | |||
|---|---|---|---|
| Quadrant | BADHDUFLAG | Total packets | Discarded packets |
| A | 0 | 7 | 0 |
| B | 0 | 8 | 0 |
| C | 0 | 8 | 0 |
| D | 0 | 8 | 0 |
| Mode SS | |||
|---|---|---|---|
| Quadrant | BADHDUFLAG | Total packets | Discarded packets |
| A | 0 | 62 | 0 |
| B | 0 | 62 | 0 |
| C | 0 | 62 | 0 |
| D | 0 | 62 | 0 |
| Quadrant | Total seconds | Saturated seconds | Saturation percentage |
|---|---|---|---|
| A | 3086 | 9 | 0.291640% |
| B | 3086 | 31 | 1.004537% |
| C | 3086 | 1 | 0.032404% |
| D | 3086 | 504 | 16.331821% |
Noise dominated data is calculated using 1-second bins in cleaned event files. If a bin has >2000 counts, and if more than 50% of those come from <1% of pixels, then it is considered to be noise-dominated and hence unusable.
| Quadrant | # 1 sec bins | Bins with >0 counts | Bins with >2000 counts | High rate bins dominated by noise | Noise dominated (total time) | Noise dominated (detector-on time) | Marked lightcurve |
|---|---|---|---|---|---|---|---|
| A | 3086 | 3086 | 1 | 1 | 0.03% | 0.03% | 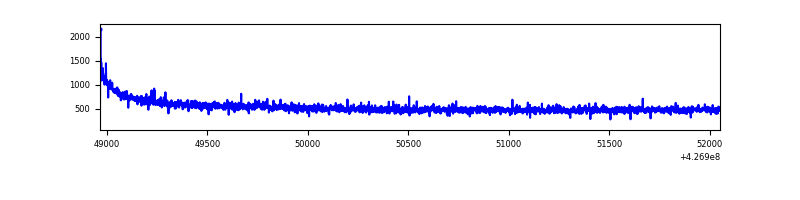 |
| B | 3086 | 3086 | 22 | 22 | 0.71% | 0.71% | 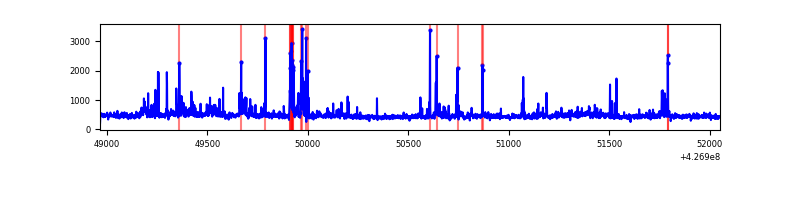 |
| C | 3086 | 3086 | 0 | 0 | 0.00% | 0.00% | 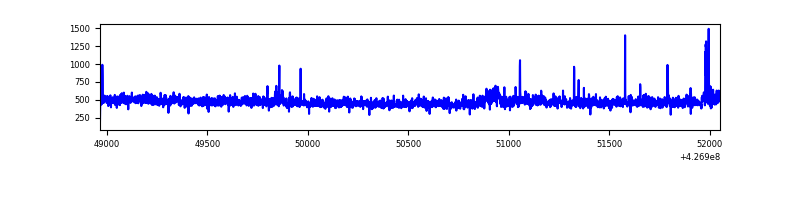 |
| D | 3086 | 3086 | 372 | 372 | 12.05% | 12.05% | 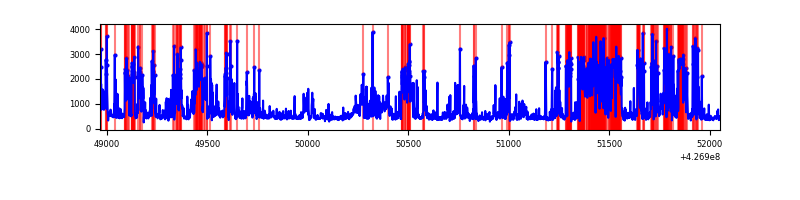 |
Top three noisy pixels from each quadrant. If the there are fewer than three noisy pixels in the level2.evt file, extra rows are filled as -1
| Pixel properties | Quadrant properties | ||||||
|---|---|---|---|---|---|---|---|
| Quadrant | DetID | PixID | Counts | Sigma | Mean | Median | Sigma |
| A | 10 | 83 | 306823 | 4279.5 | 339 | 332 | 71.6 |
| A | 12 | 189 | 8278 | 110.95 | 339 | 332 | 71.6 |
| A | 3 | 137 | 3923 | 50.14 | 339 | 332 | 71.6 |
| B | 3 | 112 | 117253 | 1743.96 | 335 | 325 | 67.0 |
| B | 0 | 229 | 95242 | 1415.67 | 335 | 325 | 67.0 |
| B | 5 | 255 | 63595 | 943.66 | 335 | 325 | 67.0 |
| C | 15 | 214 | 126319 | 1607.41 | 330 | 330 | 78.4 |
| C | 8 | 79 | 44549 | 564.16 | 330 | 330 | 78.4 |
| C | 13 | 61 | 2227 | 24.2 | 330 | 330 | 78.4 |
| D | 13 | 249 | 1464916 | 19347.99 | 297 | 286 | 75.7 |
| D | 2 | 249 | 85495 | 1125.62 | 297 | 286 | 75.7 |
| D | 12 | 6 | 73971 | 973.39 | 297 | 286 | 75.7 |
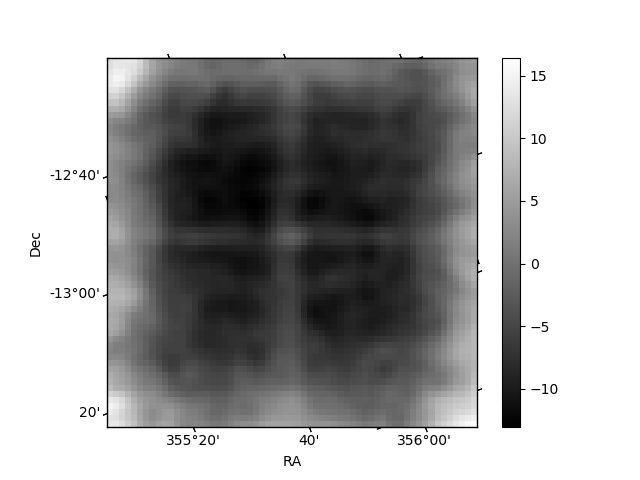
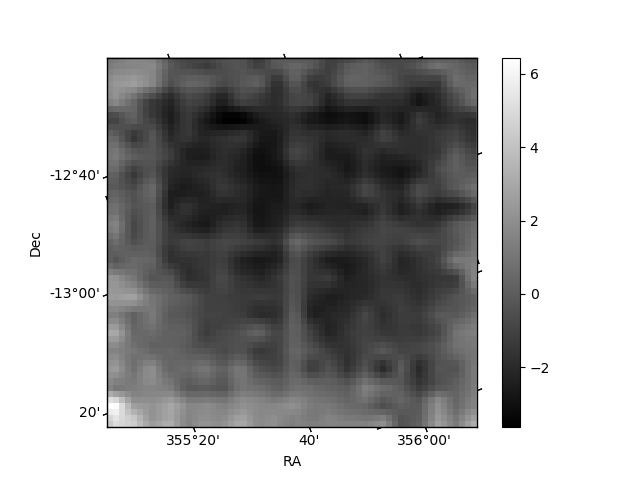
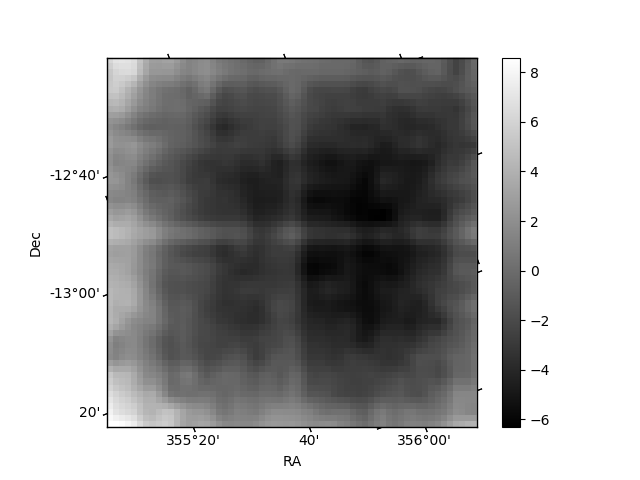
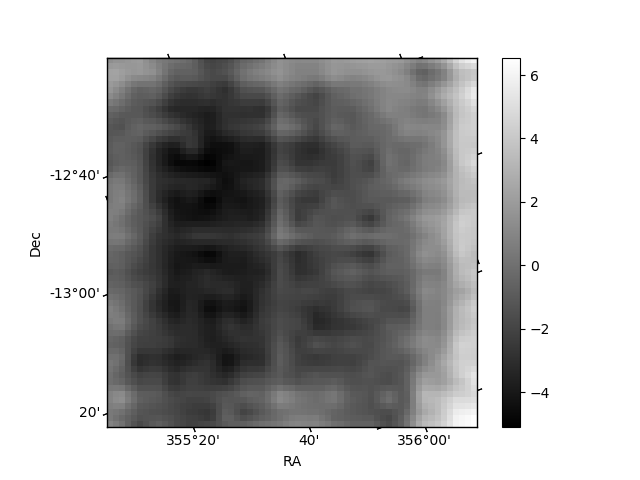
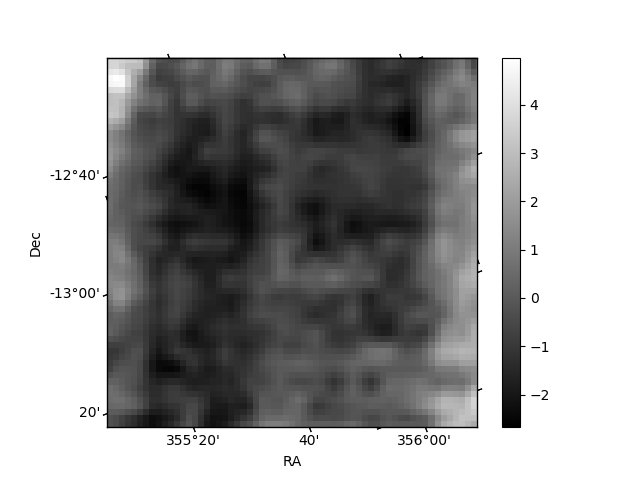
Histogram calculated using DETX and DETY for each event in the final _common_clean file
| Quadrant A | 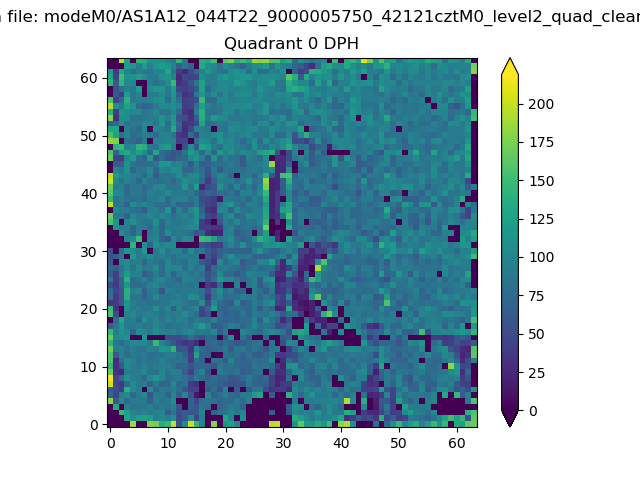 |
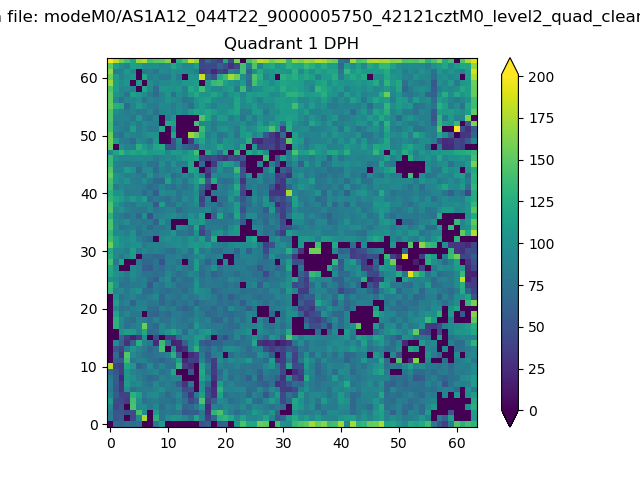 |
Quadrant B |
|---|---|---|---|
| Quadrant D | 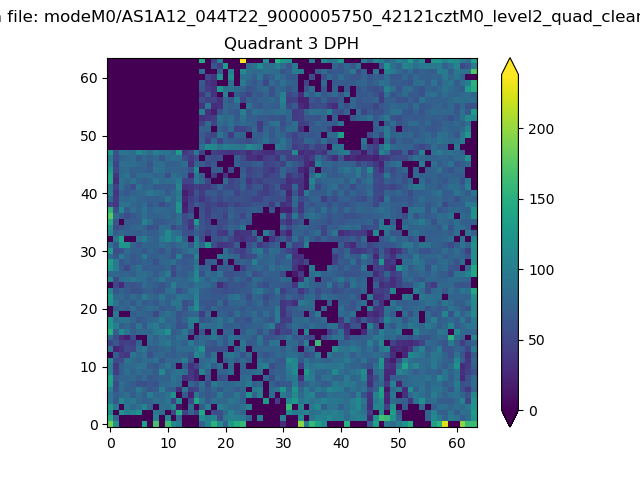 |
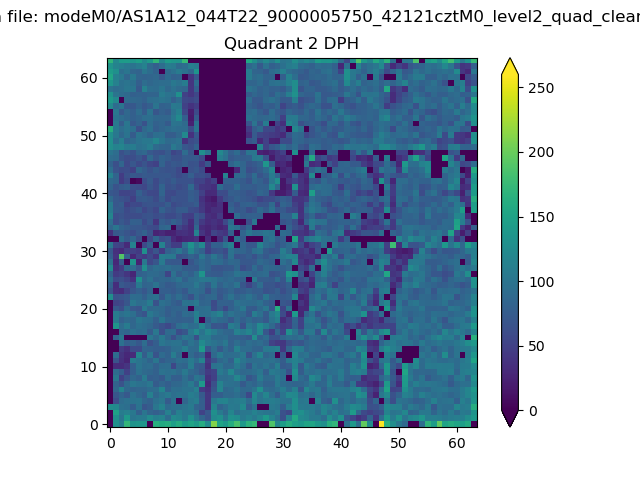 |
Quadrant C |
| Plot type | Count rate plots | Images |
|---|---|---|
| Comparison with Poisson distribution Blue bars denote a histogram of data divided into 1 sec bins. Red curve is a Poisson curve with rate = median count rate of data. |
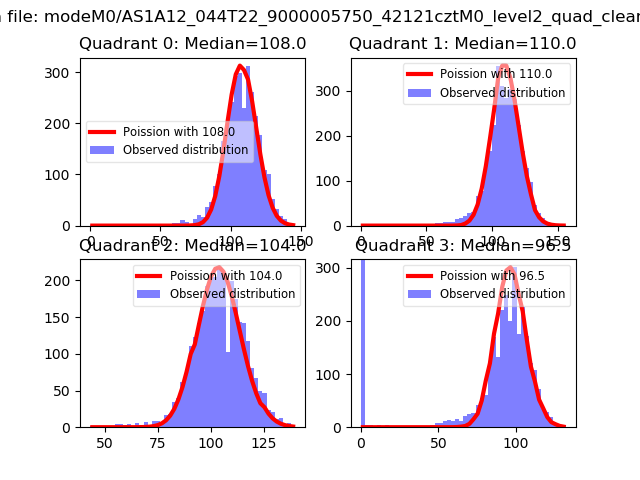 |
 |
| Quadrant-wise count rates Data is divided into 100 sec bins |
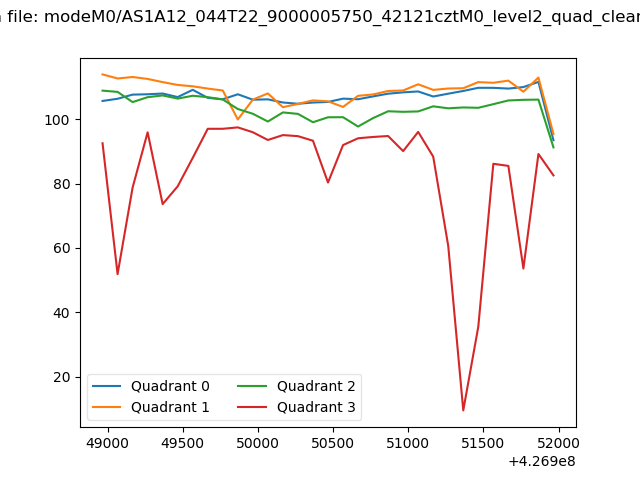 |
|
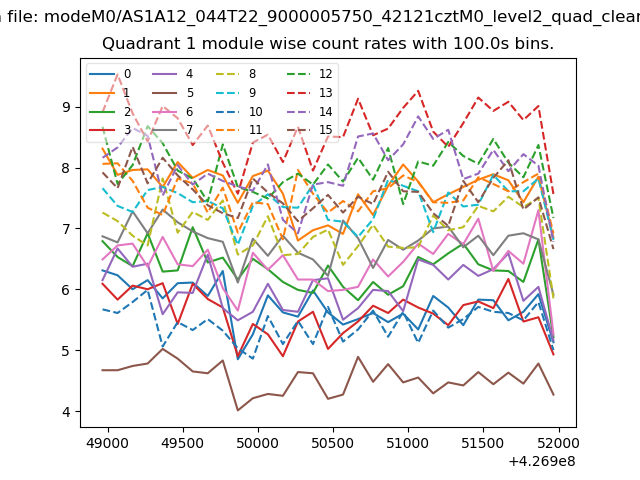
| Module-wise count rates for Quadrant A Data is divided into 100 sec bins |
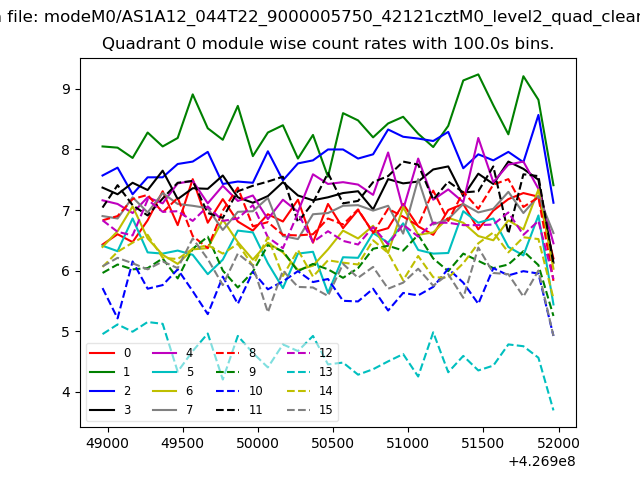 |
 |
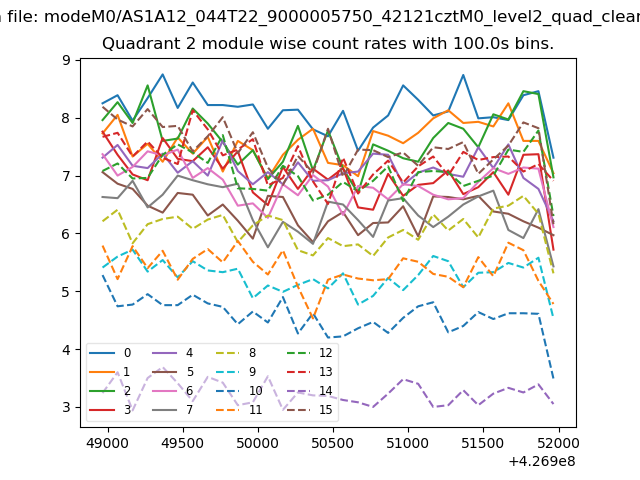
| Module-wise count rates for Quadrant B Data is divided into 100 sec bins |
 |
 |
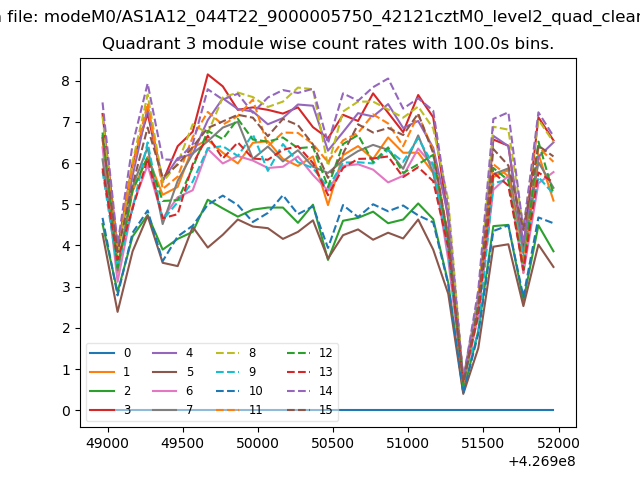
| Module-wise count rates for Quadrant C Data is divided into 100 sec bins |
 |
 |
| Module-wise count rates for Quadrant D Data is divided into 100 sec bins |
 |
 |
| Parameter | Plot |
|---|---|
| CZT HV Monitor | 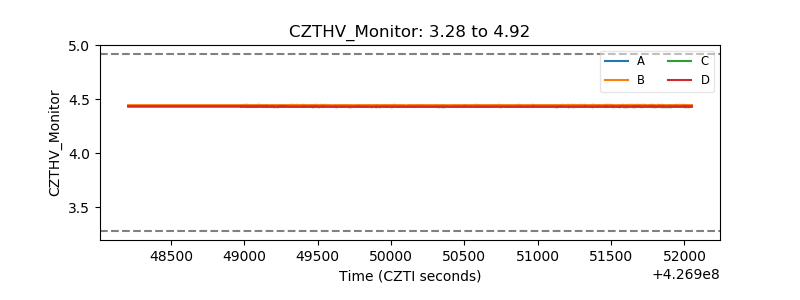 |
| D_VDD | 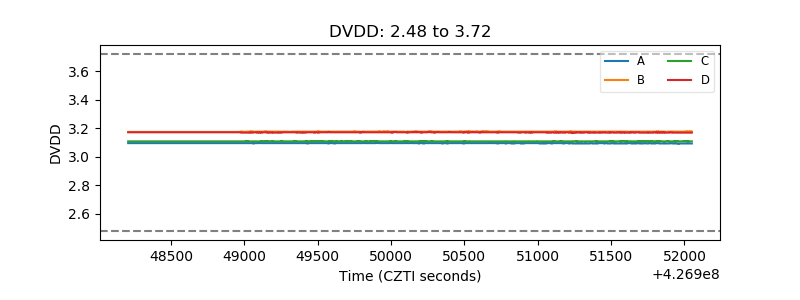 |
| Temperature 1 | 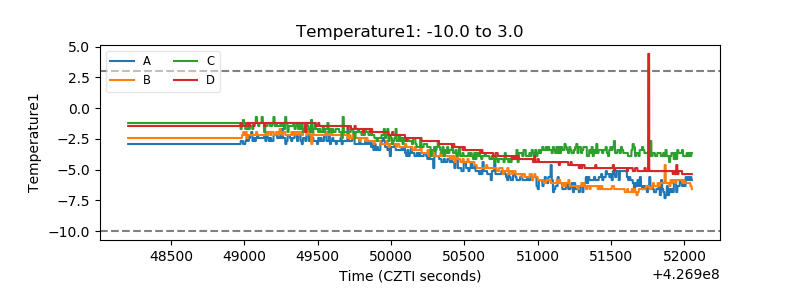 |
| Veto HV Monitor | 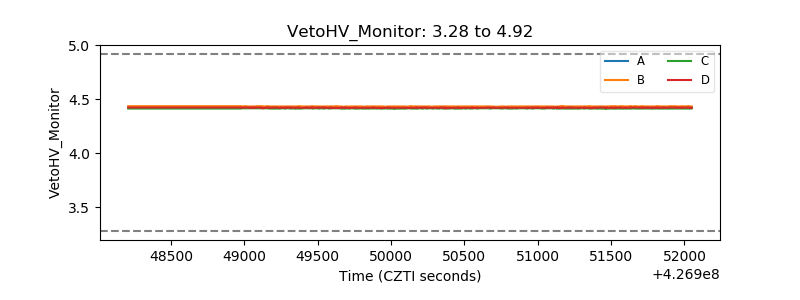 |
| Veto LLD | 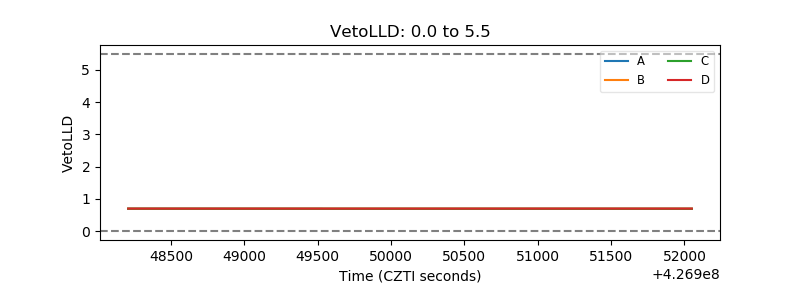 |
| Alpha Counter | 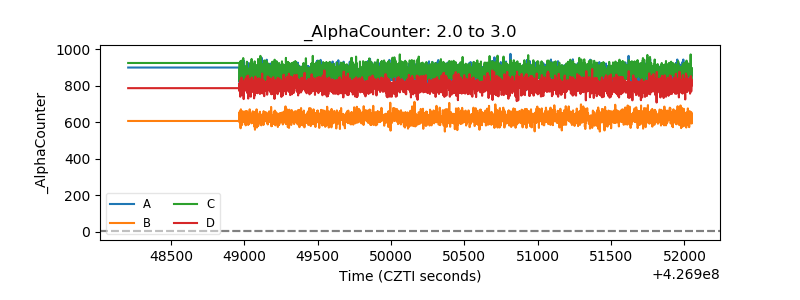 |
| _CPM_Rate | 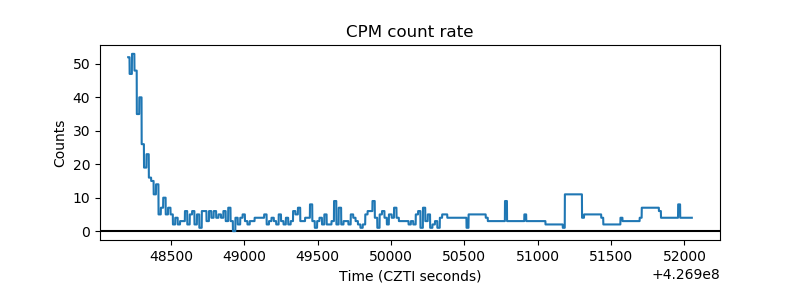 |
| CZT Counter | 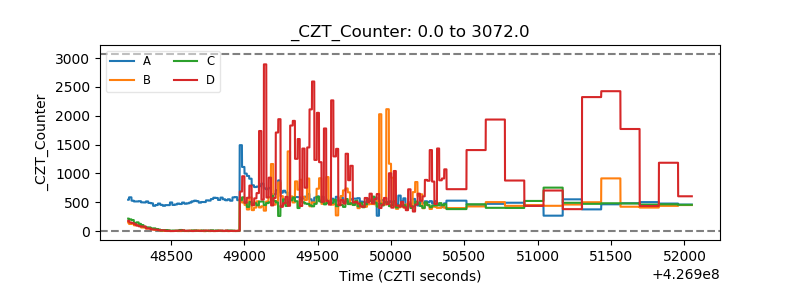 |
| +2.5 Volts monitor | 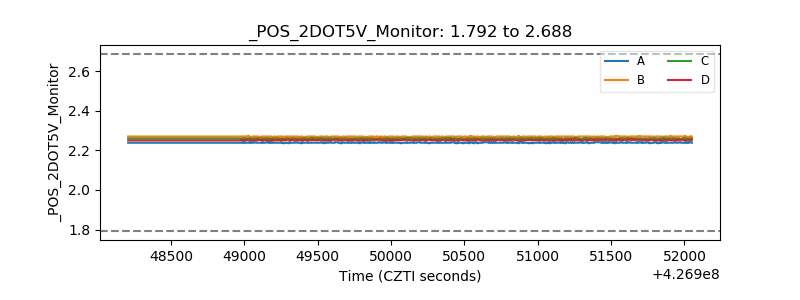 |
| +5 Volts monitor | 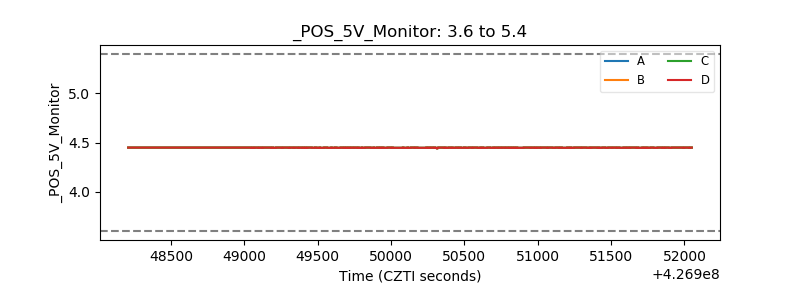 |
| _ROLL_ROT | 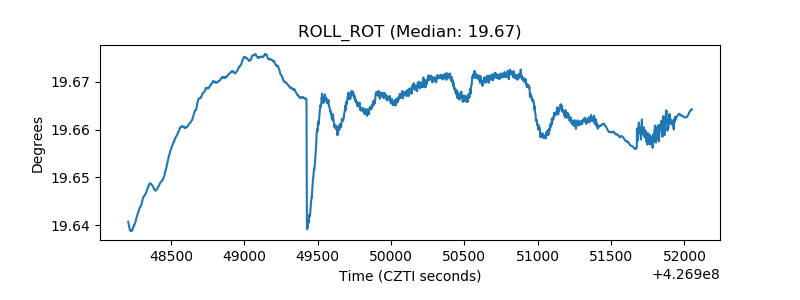 |
| _Roll_DEC | 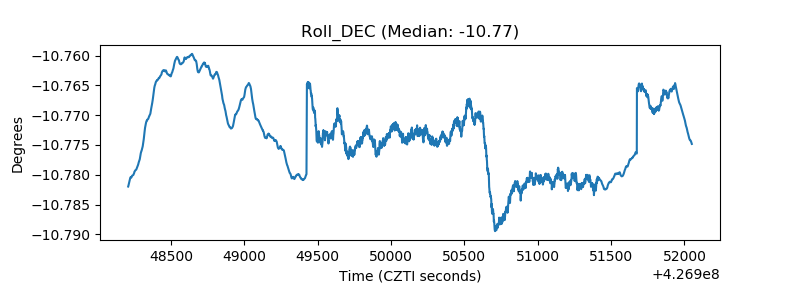 |
| _Roll_RA | 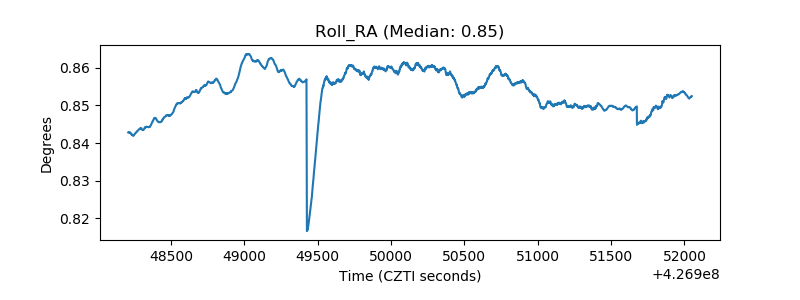 |
| Veto Counter | 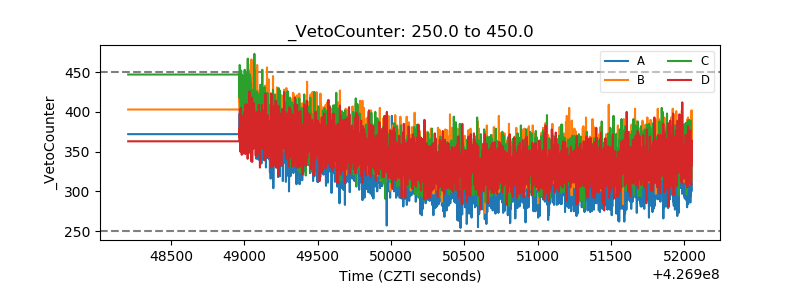 |