| Param | Original file | Final file |
|---|---|---|
| Filename | modeM0/AS1A12_044T22_9000005750_42124cztM0_level2.fits | modeM0/AS1A12_044T22_9000005750_42124cztM0_level2_quad_clean.evt |
| Size (bytes) | 1,096,836,480 | 276,482,880 |
| Size | 1.0 GB | 263.7 MB |
| Events in quadrant A | 9,578,811 | 1,871,384 |
| Events in quadrant B | 8,493,496 | 1,906,669 |
| Events in quadrant C | 8,238,750 | 1,827,148 |
| Events in quadrant D | 12,932,610 | 1,557,189 |
| Mode M0 | |||
|---|---|---|---|
| Quadrant | BADHDUFLAG | Total packets | Discarded packets |
| A | 0 | 38799 | 3 |
| B | 0 | 37395 | 3 |
| C | 0 | 35440 | 3 |
| D | 0 | 50654 | 3 |
| Mode M9 | |||
|---|---|---|---|
| Quadrant | BADHDUFLAG | Total packets | Discarded packets |
| A | 0 | 41 | 0 |
| B | 0 | 41 | 0 |
| C | 0 | 41 | 0 |
| D | 0 | 41 | 0 |
| Mode SS | |||
|---|---|---|---|
| Quadrant | BADHDUFLAG | Total packets | Discarded packets |
| A | 0 | 358 | 0 |
| B | 0 | 358 | 0 |
| C | 0 | 358 | 0 |
| D | 0 | 358 | 0 |
| Quadrant | Total seconds | Saturated seconds | Saturation percentage |
|---|---|---|---|
| A | 17528 | 38 | 0.216796% |
| B | 17529 | 159 | 0.907068% |
| C | 17529 | 5 | 0.028524% |
| D | 17529 | 1366 | 7.792801% |
Noise dominated data is calculated using 1-second bins in cleaned event files. If a bin has >2000 counts, and if more than 50% of those come from <1% of pixels, then it is considered to be noise-dominated and hence unusable.
| Quadrant | # 1 sec bins | Bins with >0 counts | Bins with >2000 counts | High rate bins dominated by noise | Noise dominated (total time) | Noise dominated (detector-on time) | Marked lightcurve |
|---|---|---|---|---|---|---|---|
| A | 21647 | 17531 | 2 | 2 | 0.01% | 0.01% | 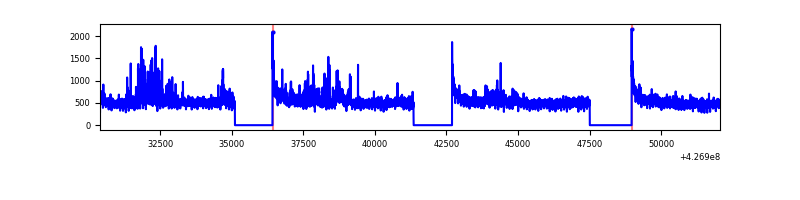 |
| B | 21648 | 17532 | 114 | 114 | 0.53% | 0.65% | 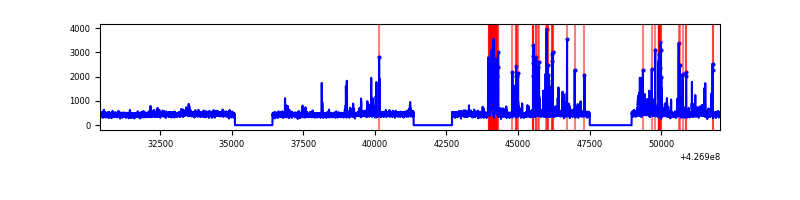 |
| C | 21648 | 17532 | 1 | 1 | 0.00% | 0.01% | 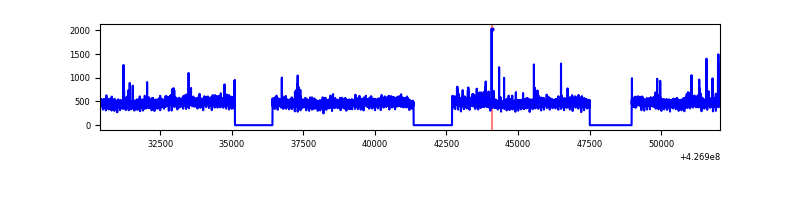 |
| D | 21648 | 17532 | 1137 | 1137 | 5.25% | 6.49% | 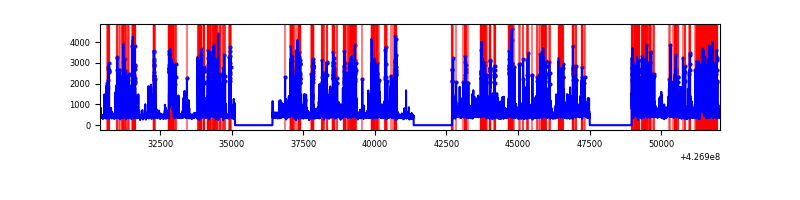 |
Top three noisy pixels from each quadrant. If the there are fewer than three noisy pixels in the level2.evt file, extra rows are filled as -1
| Pixel properties | Quadrant properties | ||||||
|---|---|---|---|---|---|---|---|
| Quadrant | DetID | PixID | Counts | Sigma | Mean | Median | Sigma |
| A | 10 | 83 | 1462625 | 3713.11 | 1931 | 1888 | 393.4 |
| A | 15 | 222 | 539879 | 1367.54 | 1931 | 1888 | 393.4 |
| A | 14 | 24 | 69984 | 173.1 | 1931 | 1888 | 393.4 |
| B | 5 | 255 | 423644 | 1132.46 | 1917 | 1859 | 372.5 |
| B | 3 | 112 | 321784 | 858.97 | 1917 | 1859 | 372.5 |
| B | 0 | 229 | 175646 | 466.6 | 1917 | 1859 | 372.5 |
| C | 15 | 214 | 709019 | 1601.86 | 1893 | 1899 | 441.4 |
| C | 8 | 79 | 140015 | 312.88 | 1893 | 1899 | 441.4 |
| C | 12 | 249 | 14233 | 27.94 | 1893 | 1899 | 441.4 |
| D | 13 | 249 | 3003638 | 6700.37 | 1824 | 1771 | 448.0 |
| D | 12 | 233 | 1144675 | 2551.04 | 1824 | 1771 | 448.0 |
| D | 12 | 6 | 611083 | 1360.02 | 1824 | 1771 | 448.0 |
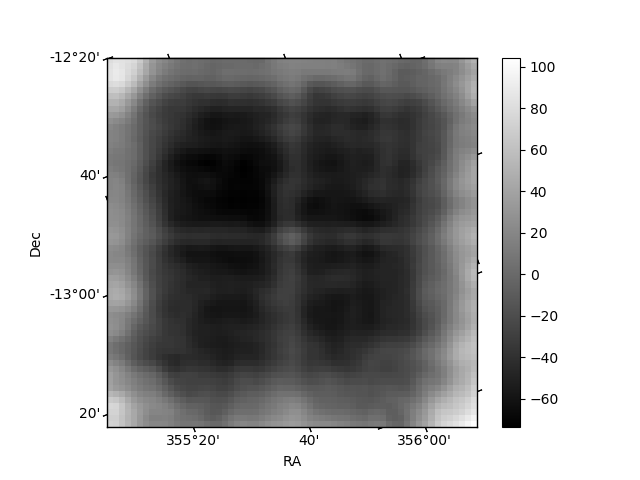
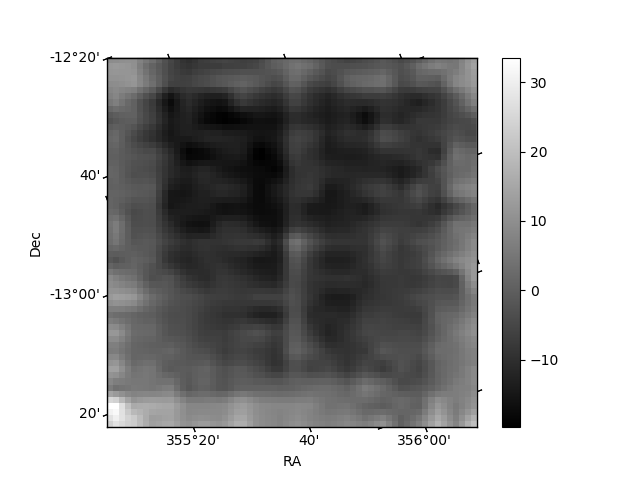
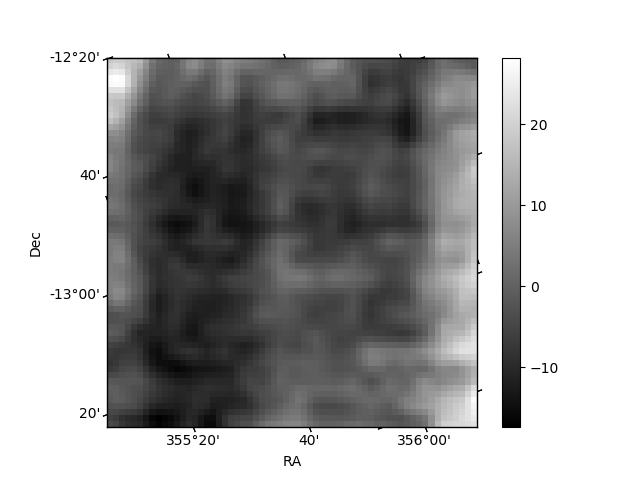
Histogram calculated using DETX and DETY for each event in the final _common_clean file
| Quadrant A | 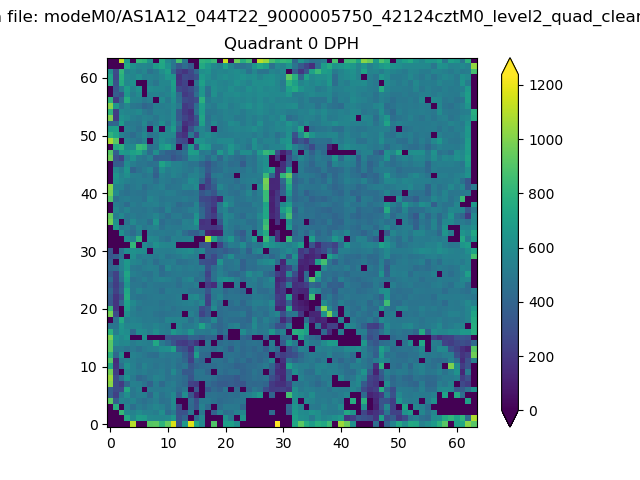 |
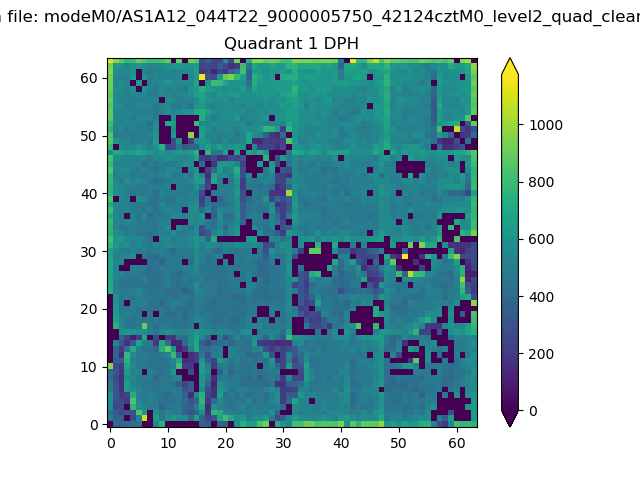 |
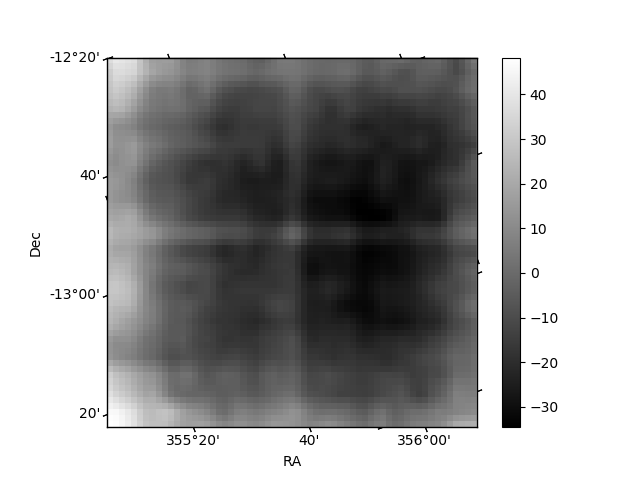
Quadrant B |
|---|---|---|---|
| Quadrant D | 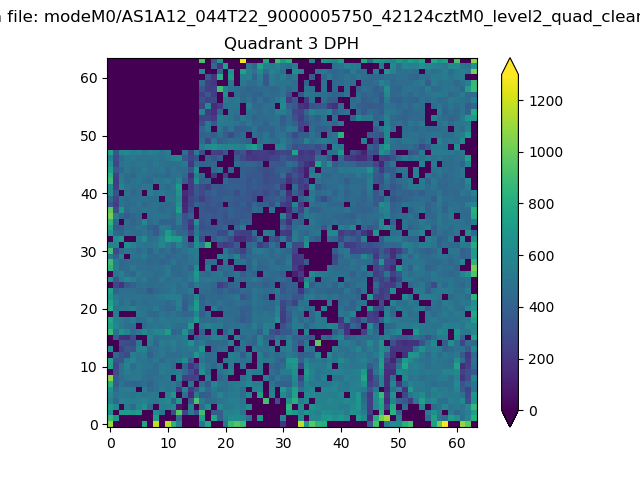 |
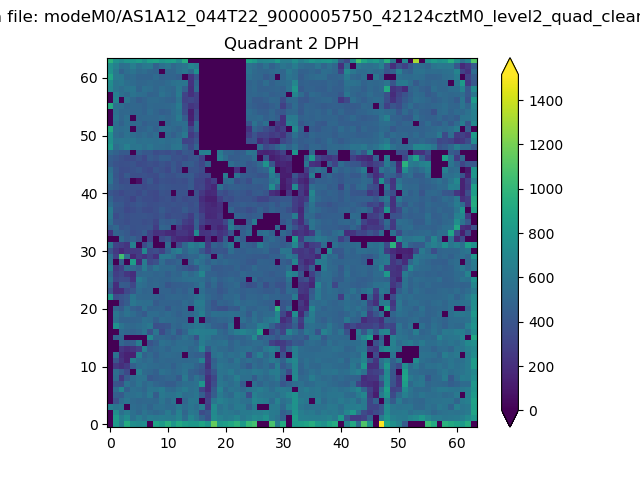 |
Quadrant C |
| Plot type | Count rate plots | Images |
|---|---|---|
| Comparison with Poisson distribution Blue bars denote a histogram of data divided into 1 sec bins. Red curve is a Poisson curve with rate = median count rate of data. |
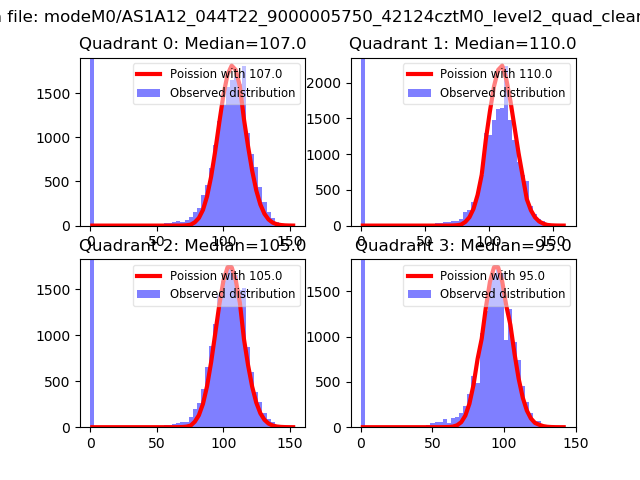 |
 |
| Quadrant-wise count rates Data is divided into 100 sec bins |
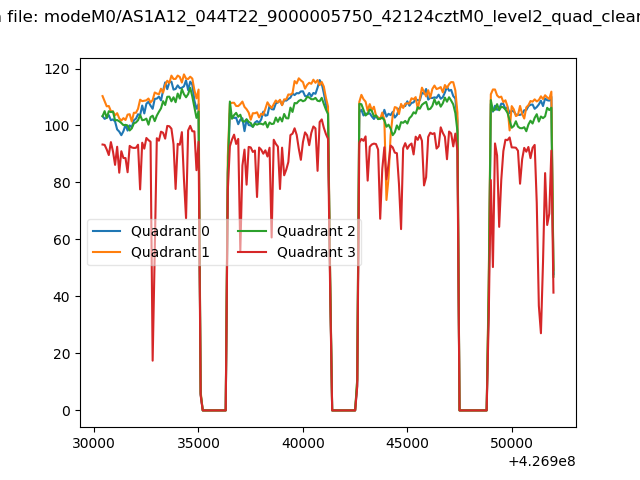 |
|
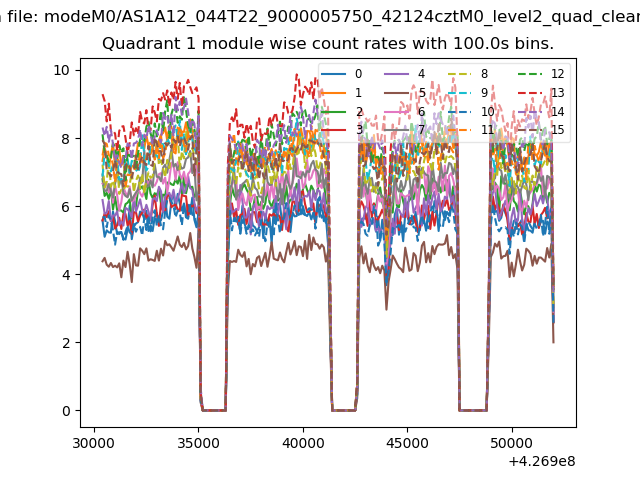
| Module-wise count rates for Quadrant A Data is divided into 100 sec bins |
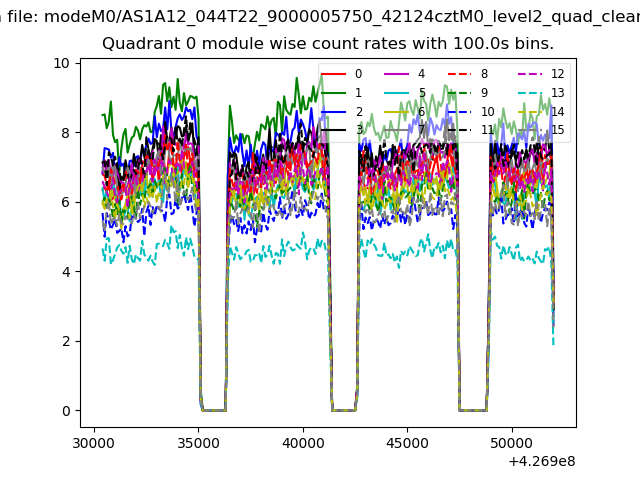 |
 |
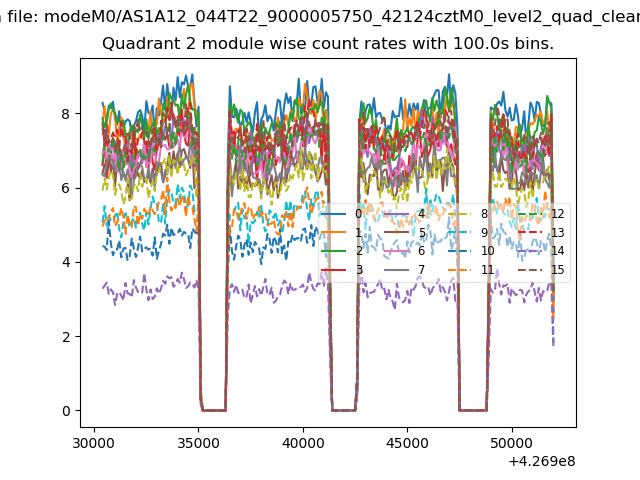
| Module-wise count rates for Quadrant B Data is divided into 100 sec bins |
 |
 |
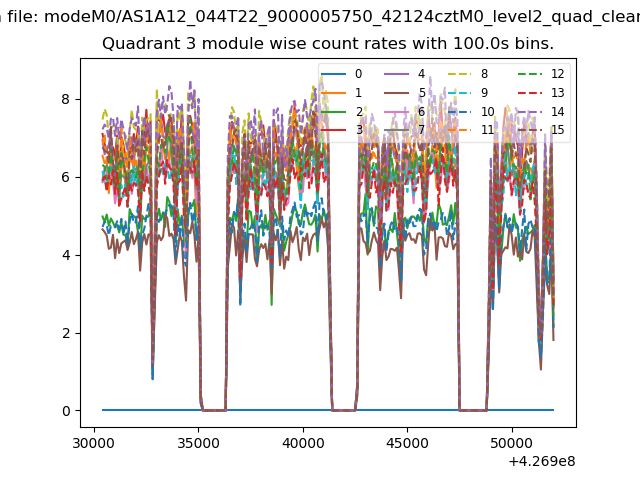
| Module-wise count rates for Quadrant C Data is divided into 100 sec bins |
 |
 |
| Module-wise count rates for Quadrant D Data is divided into 100 sec bins |
 |
 |
| Parameter | Plot |
|---|---|
| CZT HV Monitor | 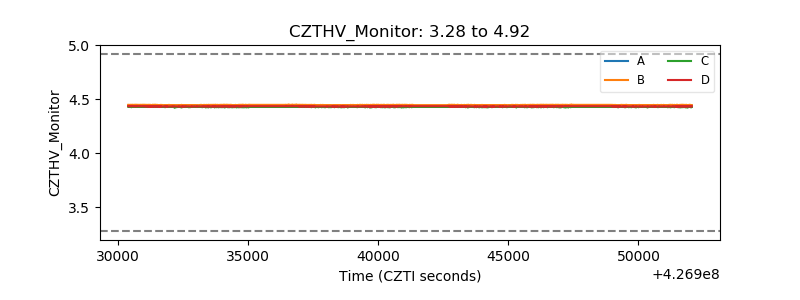 |
| D_VDD | 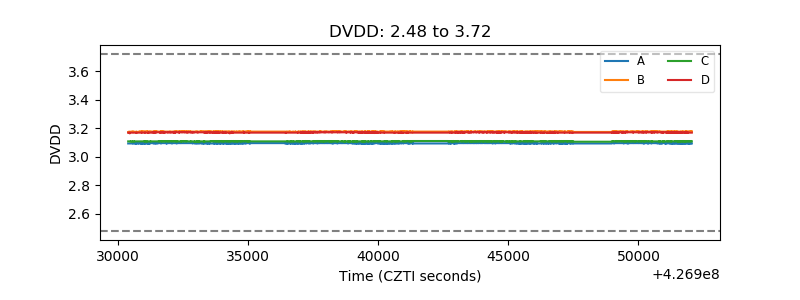 |
| Temperature 1 | 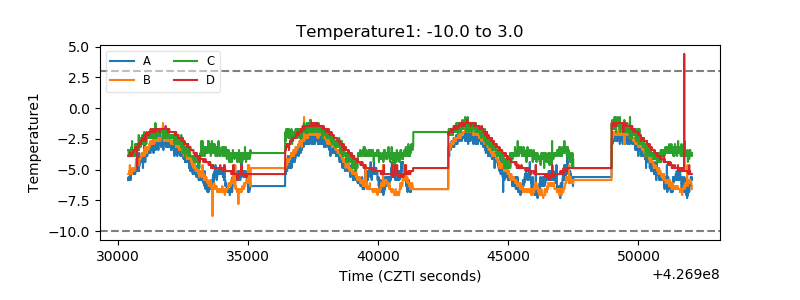 |
| Veto HV Monitor | 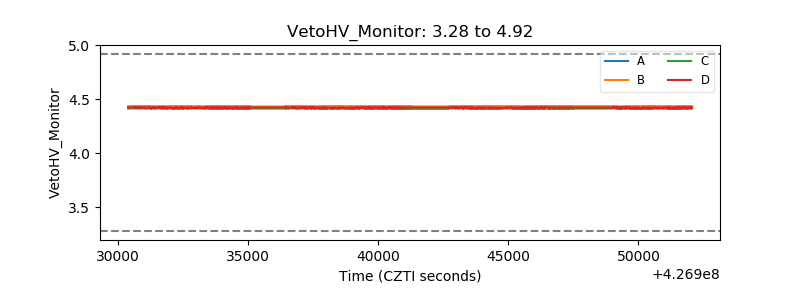 |
| Veto LLD | 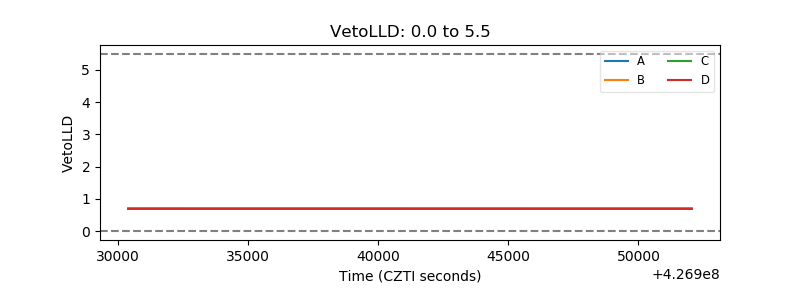 |
| Alpha Counter | 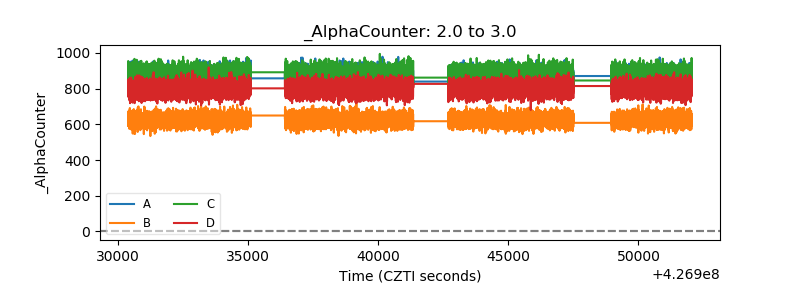 |
| _CPM_Rate |  |
| CZT Counter | 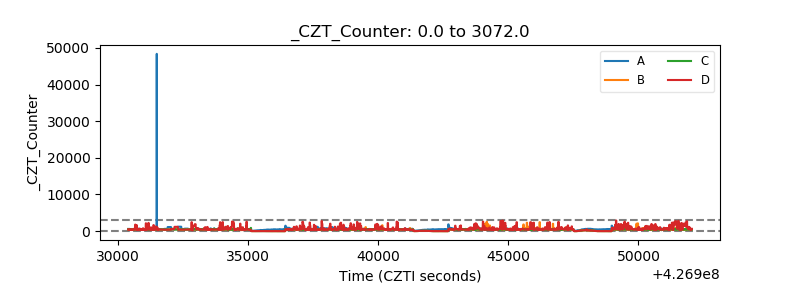 |
| +2.5 Volts monitor | 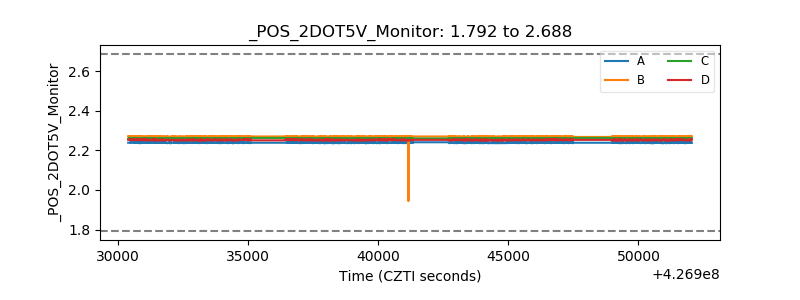 |
| +5 Volts monitor | 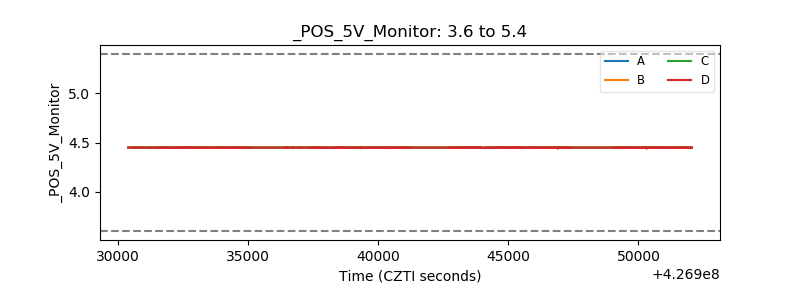 |
| _ROLL_ROT | 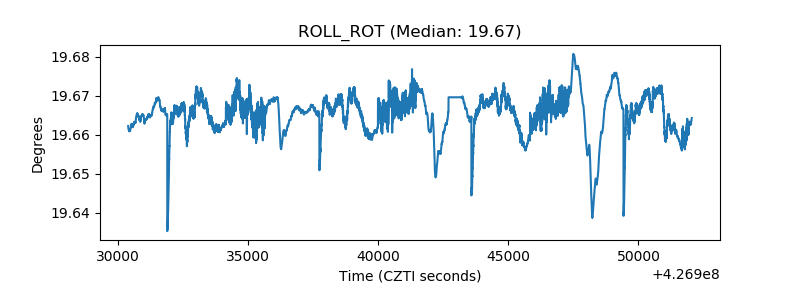 |
| _Roll_DEC | 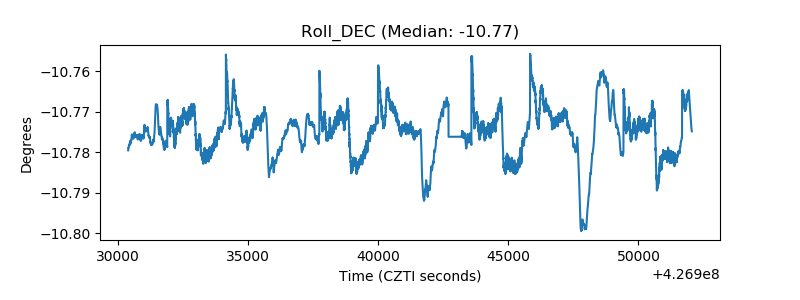 |
| _Roll_RA | 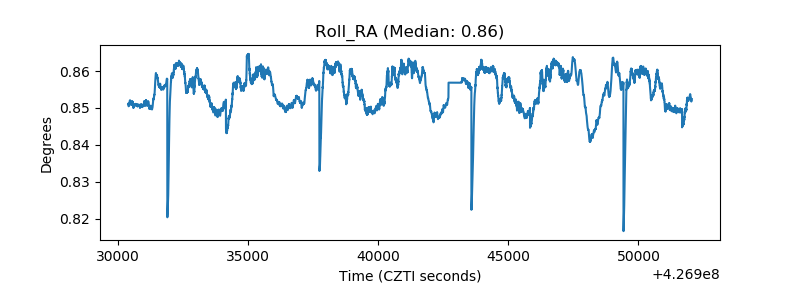 |
| Veto Counter | 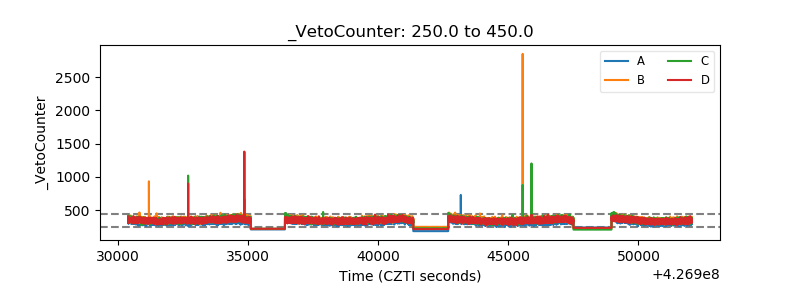 |