| Param | Original file | Final file |
|---|---|---|
| Filename | modeM0/AS1A12_061T07_9000005752_42121cztM0_level2.fits | modeM0/AS1A12_061T07_9000005752_42121cztM0_level2_quad_clean.evt |
| Size (bytes) | 102,692,160 | 28,730,880 |
| Size | 97.9 MB | 27.4 MB |
| Events in quadrant A | 965,261 | 190,640 |
| Events in quadrant B | 912,489 | 194,544 |
| Events in quadrant C | 864,450 | 187,746 |
| Events in quadrant D | 923,901 | 172,329 |
| Mode M0 | |||
|---|---|---|---|
| Quadrant | BADHDUFLAG | Total packets | Discarded packets |
| A | 0 | 3868 | 1 |
| B | 0 | 3821 | 1 |
| C | 0 | 3542 | 1 |
| D | 0 | 3887 | 2 |
| Mode SS | |||
|---|---|---|---|
| Quadrant | BADHDUFLAG | Total packets | Discarded packets |
| A | 0 | 36 | 0 |
| B | 0 | 36 | 0 |
| C | 0 | 36 | 0 |
| D | 0 | 36 | 0 |
| Mode M9 | |||
|---|---|---|---|
| Quadrant | BADHDUFLAG | Total packets | Discarded packets |
| A | 0 | 16 | 0 |
| B | 0 | 16 | 0 |
| C | 0 | 16 | 0 |
| D | 0 | 16 | 0 |
| Quadrant | Total seconds | Saturated seconds | Saturation percentage |
|---|---|---|---|
| A | 1701 | 4 | 0.235156% |
| B | 1701 | 8 | 0.470312% |
| C | 1701 | 1 | 0.058789% |
| D | 1700 | 35 | 2.058824% |
Noise dominated data is calculated using 1-second bins in cleaned event files. If a bin has >2000 counts, and if more than 50% of those come from <1% of pixels, then it is considered to be noise-dominated and hence unusable.
| Quadrant | # 1 sec bins | Bins with >0 counts | Bins with >2000 counts | High rate bins dominated by noise | Noise dominated (total time) | Noise dominated (detector-on time) | Marked lightcurve |
|---|---|---|---|---|---|---|---|
| A | 3284 | 1702 | 1 | 1 | 0.03% | 0.06% | 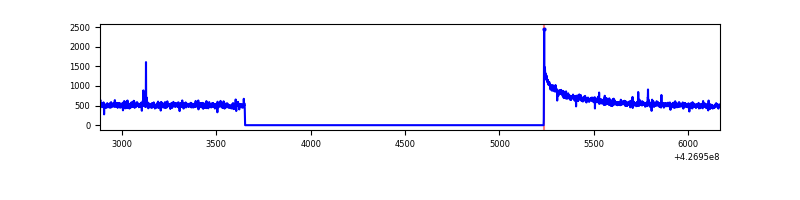 |
| B | 3284 | 1702 | 1 | 1 | 0.03% | 0.06% |  |
| C | 3284 | 1702 | 0 | 0 | 0.00% | 0.00% | 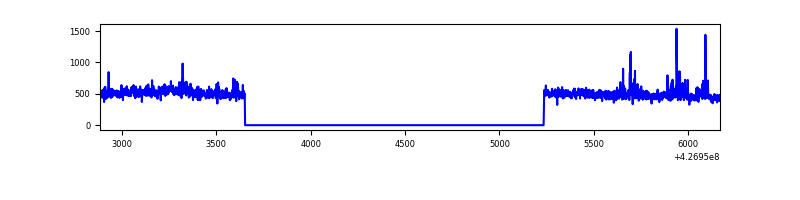 |
| D | 3283 | 1701 | 22 | 22 | 0.67% | 1.29% | 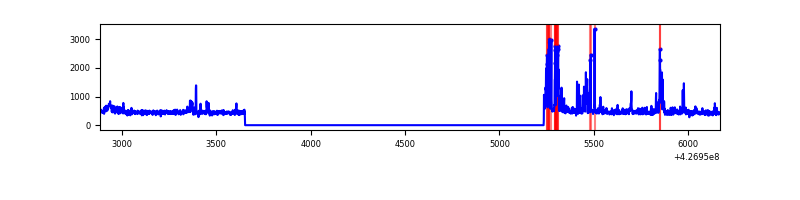 |
Top three noisy pixels from each quadrant. If the there are fewer than three noisy pixels in the level2.evt file, extra rows are filled as -1
| Pixel properties | Quadrant properties | ||||||
|---|---|---|---|---|---|---|---|
| Quadrant | DetID | PixID | Counts | Sigma | Mean | Median | Sigma |
| A | 10 | 83 | 202882 | 4777.95 | 195 | 190 | 42.4 |
| A | 13 | 248 | 3513 | 78.33 | 195 | 190 | 42.4 |
| A | 3 | 137 | 2165 | 46.56 | 195 | 190 | 42.4 |
| B | 4 | 81 | 84305 | 2143.36 | 193 | 188 | 39.2 |
| B | 5 | 255 | 34135 | 864.99 | 193 | 188 | 39.2 |
| B | 3 | 112 | 23171 | 585.62 | 193 | 188 | 39.2 |
| C | 15 | 214 | 73934 | 1583.56 | 191 | 191 | 46.6 |
| C | 8 | 79 | 43032 | 919.97 | 191 | 191 | 46.6 |
| C | 12 | 249 | 1334 | 24.54 | 191 | 191 | 46.6 |
| D | 13 | 249 | 64124 | 1346.59 | 190 | 184 | 47.5 |
| D | 2 | 249 | 48124 | 1009.62 | 190 | 184 | 47.5 |
| D | 10 | 199 | 27913 | 583.98 | 190 | 184 | 47.5 |
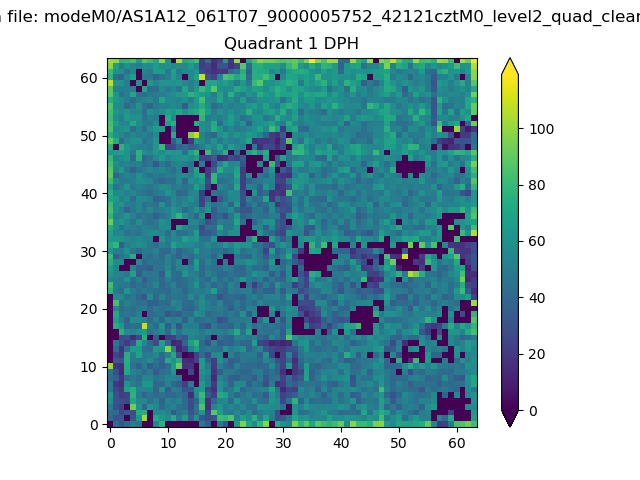
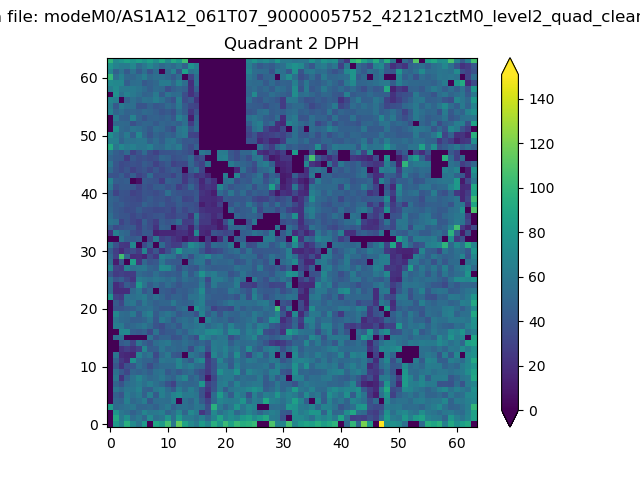
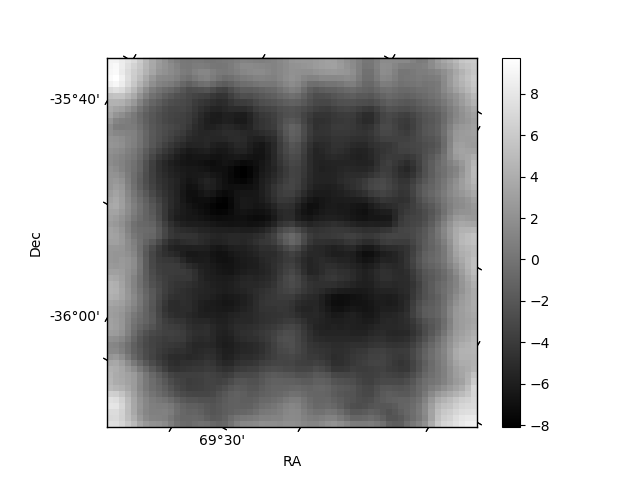
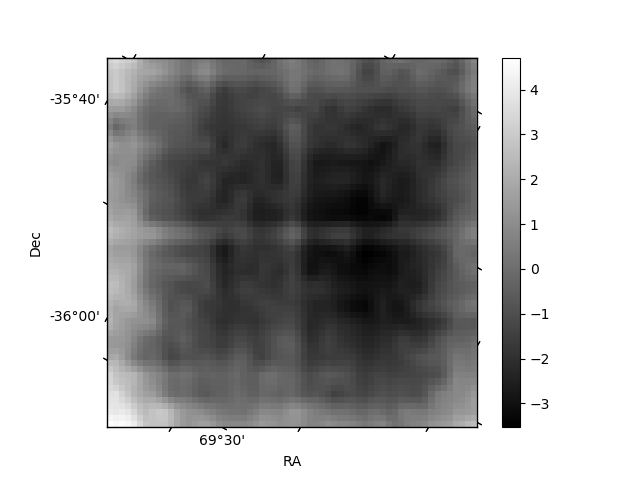
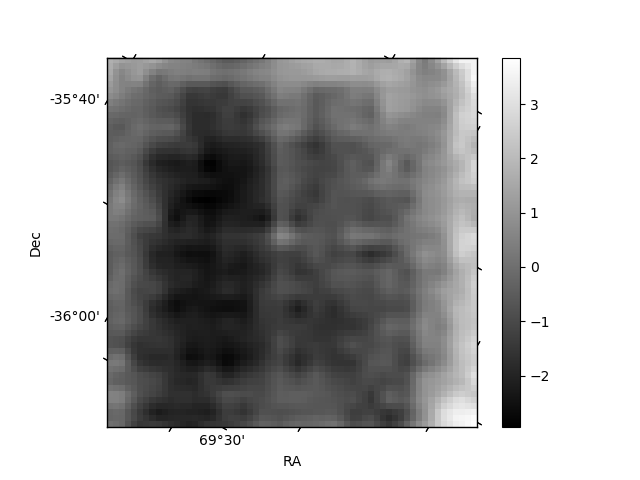
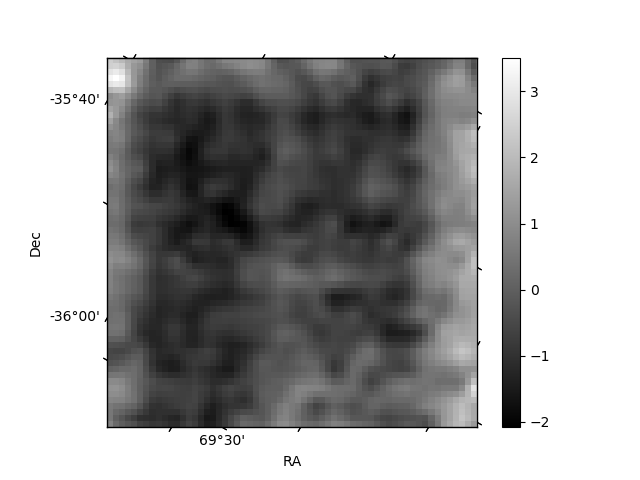
Histogram calculated using DETX and DETY for each event in the final _common_clean file
| Quadrant A | 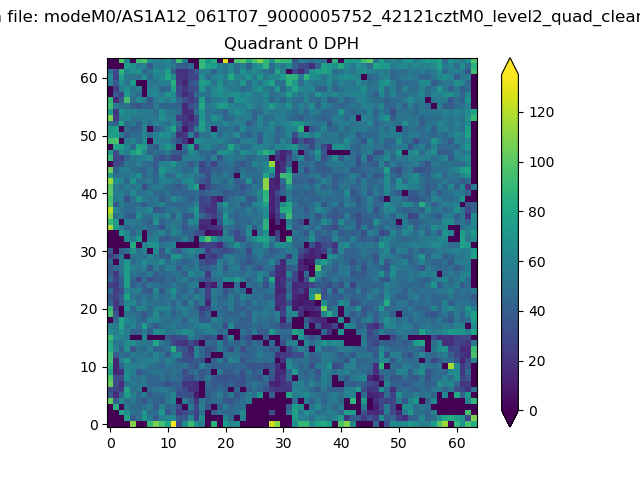 |
 |
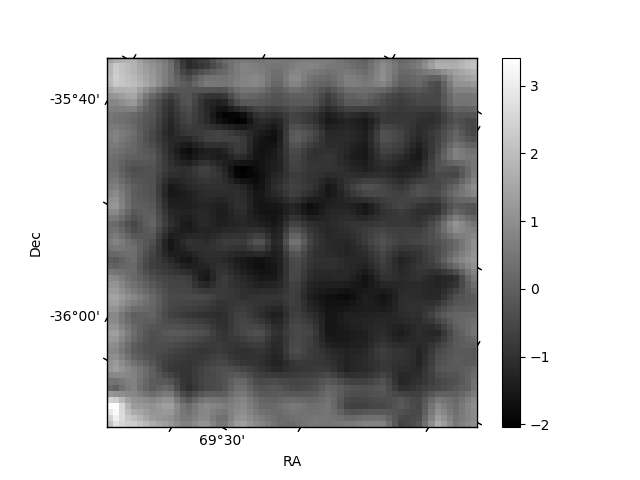
Quadrant B |
|---|---|---|---|
| Quadrant D | 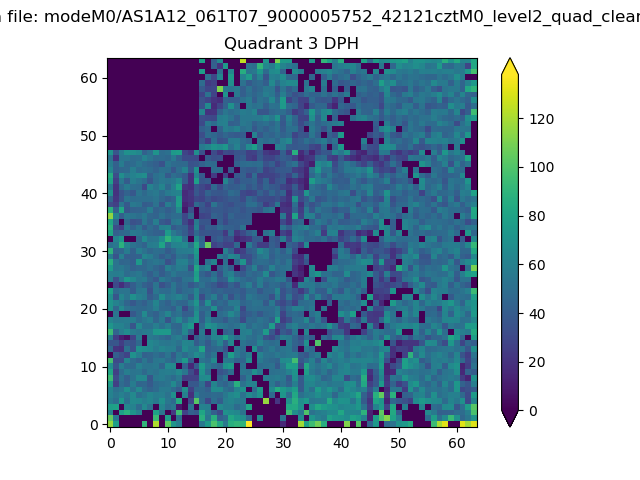 |
 |
Quadrant C |
| Plot type | Count rate plots | Images |
|---|---|---|
| Comparison with Poisson distribution Blue bars denote a histogram of data divided into 1 sec bins. Red curve is a Poisson curve with rate = median count rate of data. |
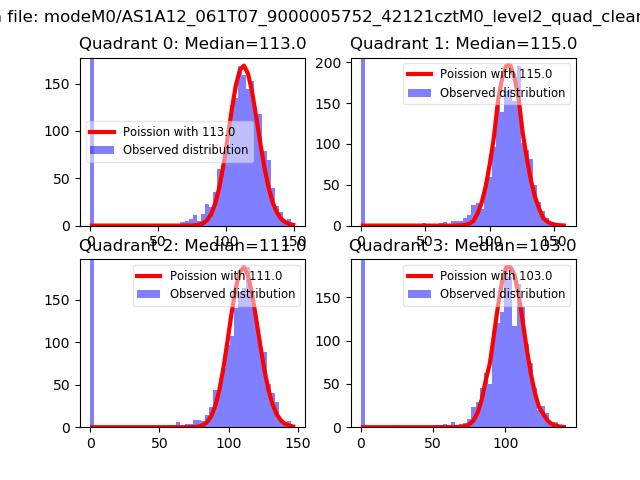 |
 |
| Quadrant-wise count rates Data is divided into 100 sec bins |
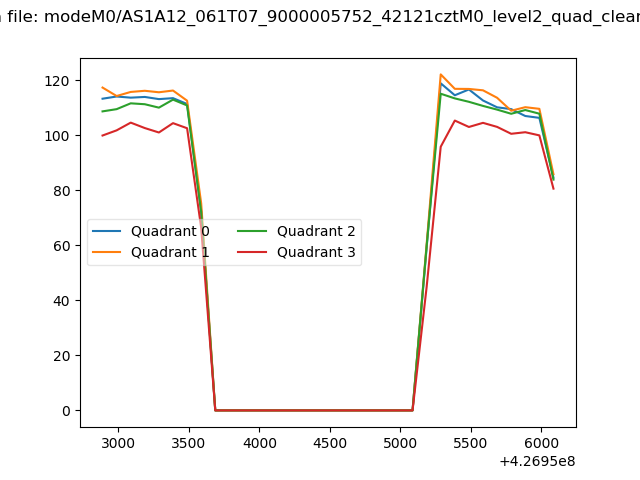 |
|
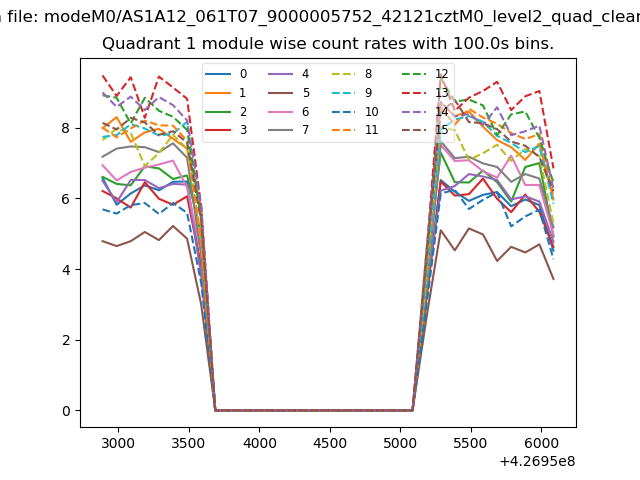
| Module-wise count rates for Quadrant A Data is divided into 100 sec bins |
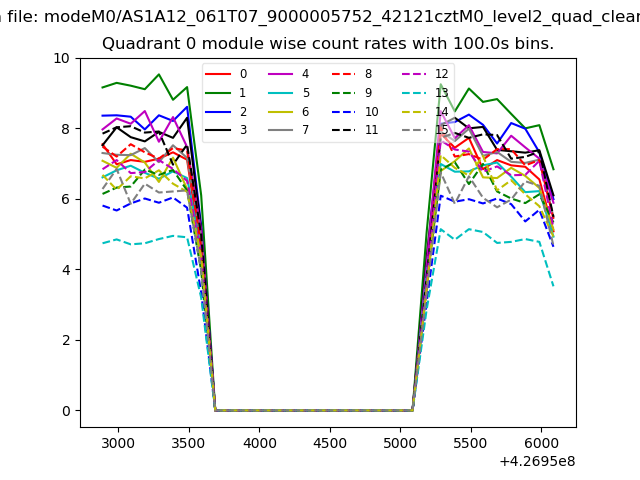 |
 |
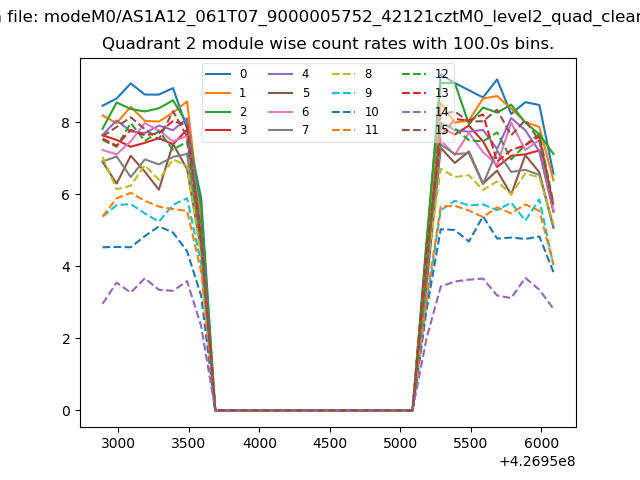
| Module-wise count rates for Quadrant B Data is divided into 100 sec bins |
 |
 |
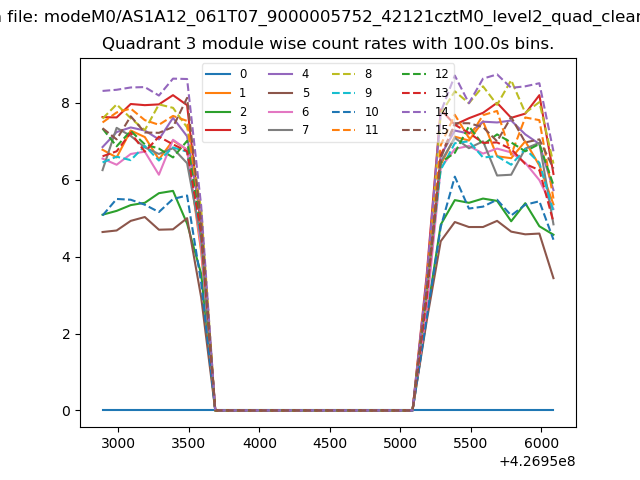
| Module-wise count rates for Quadrant C Data is divided into 100 sec bins |
 |
 |
| Module-wise count rates for Quadrant D Data is divided into 100 sec bins |
 |
 |
| Parameter | Plot |
|---|---|
| CZT HV Monitor |  |
| D_VDD | 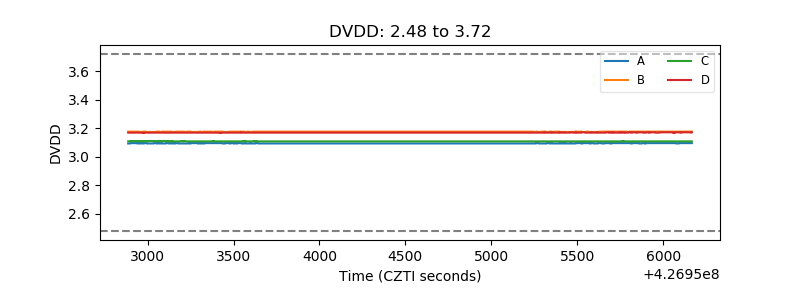 |
| Temperature 1 | 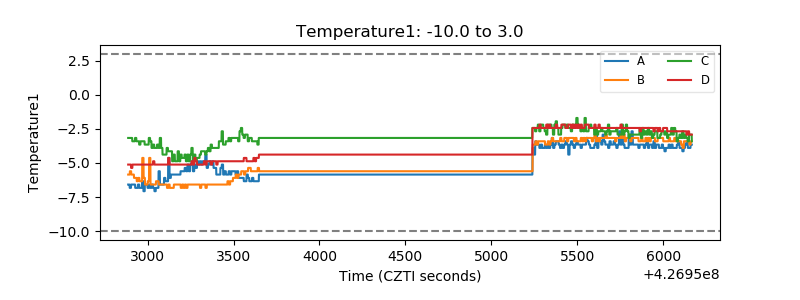 |
| Veto HV Monitor | 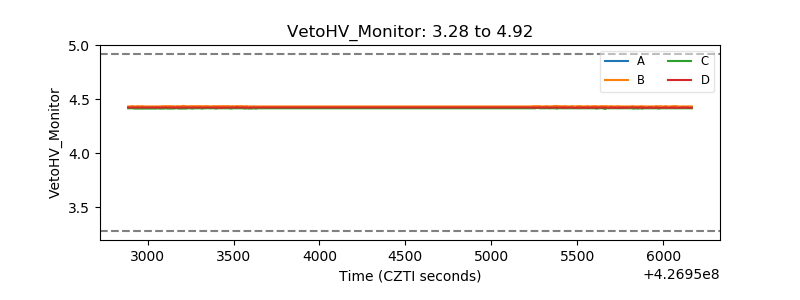 |
| Veto LLD | 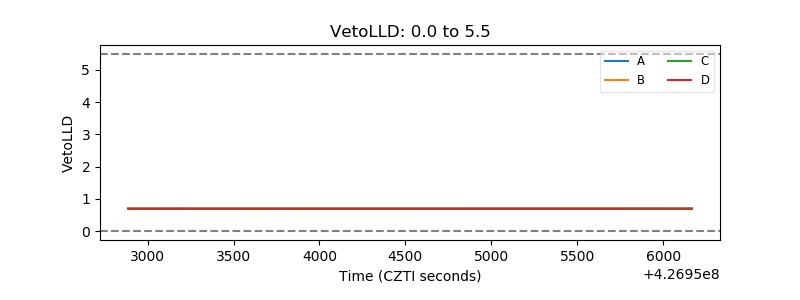 |
| Alpha Counter | 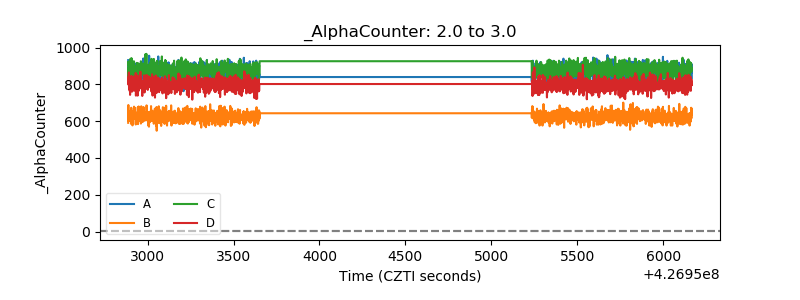 |
| _CPM_Rate | 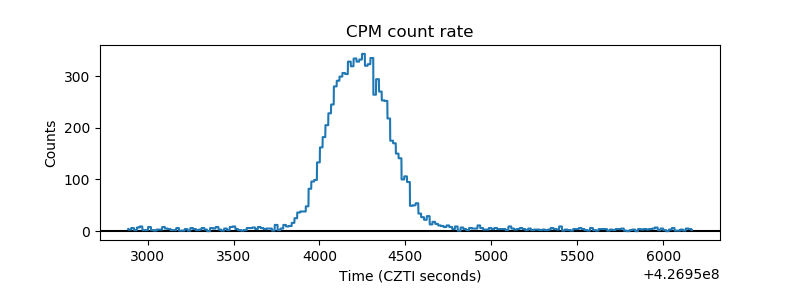 |
| CZT Counter | 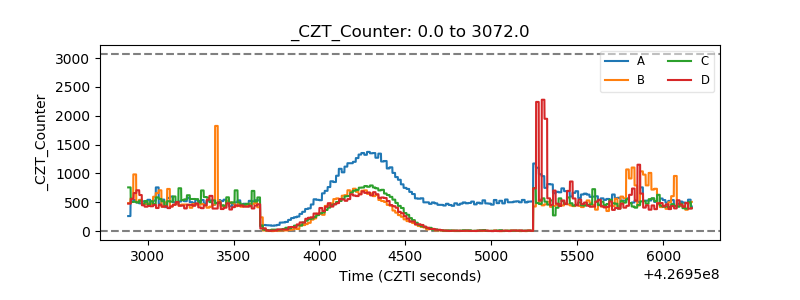 |
| +2.5 Volts monitor | 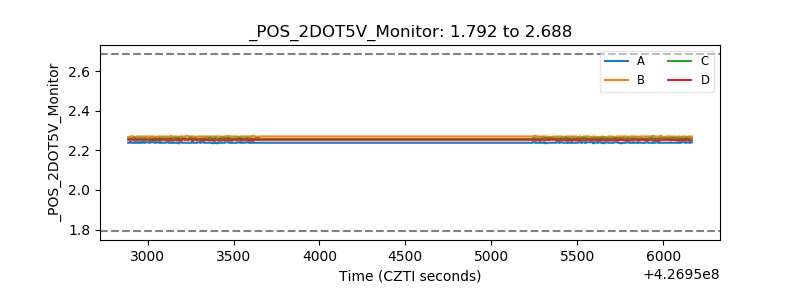 |
| +5 Volts monitor | 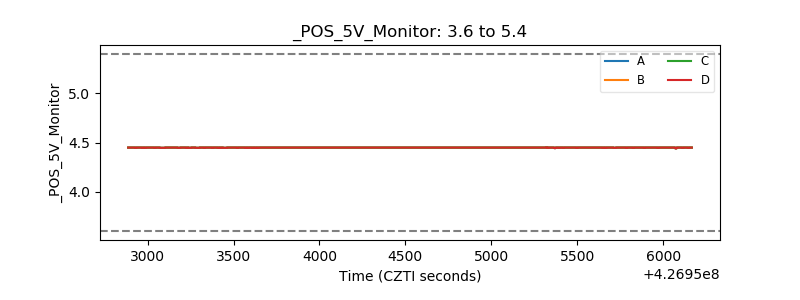 |
| _ROLL_ROT | 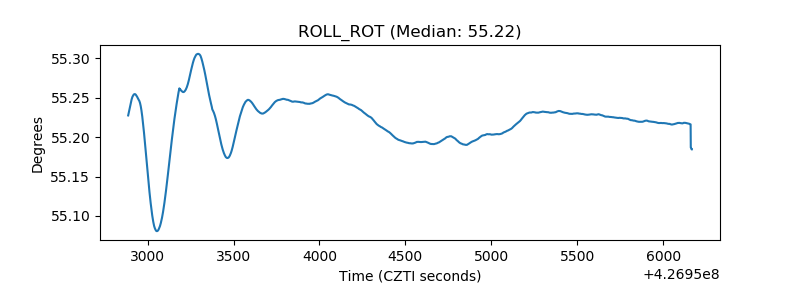 |
| _Roll_DEC | 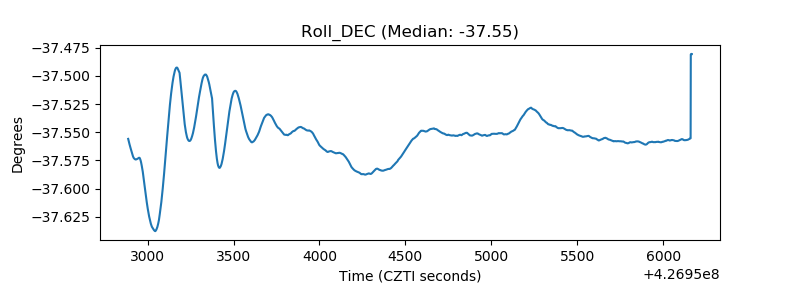 |
| _Roll_RA | 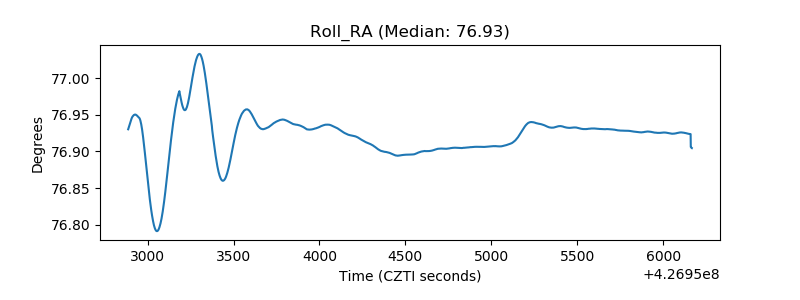 |
| Veto Counter | 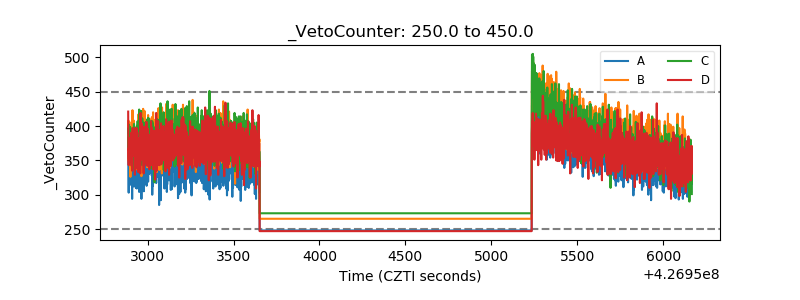 |