| Param | Original file | Final file |
|---|---|---|
| Filename | modeM0/AS1A12_061T07_9000005752_42122cztM0_level2.fits | modeM0/AS1A12_061T07_9000005752_42122cztM0_level2_quad_clean.evt |
| Size (bytes) | 314,519,040 | 87,096,960 |
| Size | 299.9 MB | 83.1 MB |
| Events in quadrant A | 2,821,141 | 583,673 |
| Events in quadrant B | 2,959,623 | 592,068 |
| Events in quadrant C | 2,465,787 | 568,027 |
| Events in quadrant D | 2,983,602 | 523,059 |
| Mode M0 | |||
|---|---|---|---|
| Quadrant | BADHDUFLAG | Total packets | Discarded packets |
| A | 0 | 11572 | 2 |
| B | 0 | 12395 | 3 |
| C | 0 | 10659 | 2 |
| D | 0 | 12563 | 2 |
| Mode SS | |||
|---|---|---|---|
| Quadrant | BADHDUFLAG | Total packets | Discarded packets |
| A | 0 | 108 | 0 |
| B | 0 | 108 | 0 |
| C | 0 | 108 | 0 |
| D | 0 | 108 | 0 |
| Mode M9 | |||
|---|---|---|---|
| Quadrant | BADHDUFLAG | Total packets | Discarded packets |
| A | 0 | 18 | 0 |
| B | 0 | 19 | 0 |
| C | 0 | 19 | 0 |
| D | 0 | 19 | 0 |
| Quadrant | Total seconds | Saturated seconds | Saturation percentage |
|---|---|---|---|
| A | 5291 | 9 | 0.170100% |
| B | 5290 | 76 | 1.436673% |
| C | 5290 | 3 | 0.056711% |
| D | 5290 | 98 | 1.852552% |
Noise dominated data is calculated using 1-second bins in cleaned event files. If a bin has >2000 counts, and if more than 50% of those come from <1% of pixels, then it is considered to be noise-dominated and hence unusable.
| Quadrant | # 1 sec bins | Bins with >0 counts | Bins with >2000 counts | High rate bins dominated by noise | Noise dominated (total time) | Noise dominated (detector-on time) | Marked lightcurve |
|---|---|---|---|---|---|---|---|
| A | 6994 | 5292 | 2 | 2 | 0.03% | 0.04% | 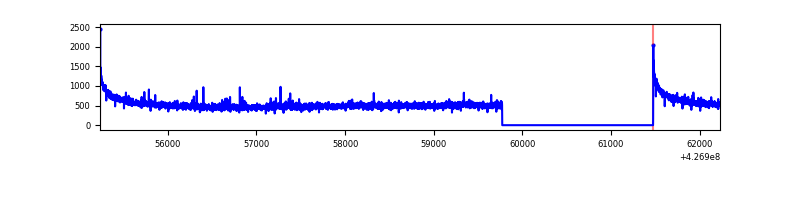 |
| B | 6993 | 5291 | 41 | 41 | 0.59% | 0.77% | 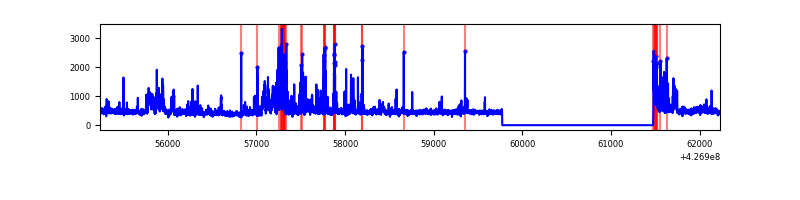 |
| C | 6993 | 5291 | 0 | 0 | 0.00% | 0.00% | 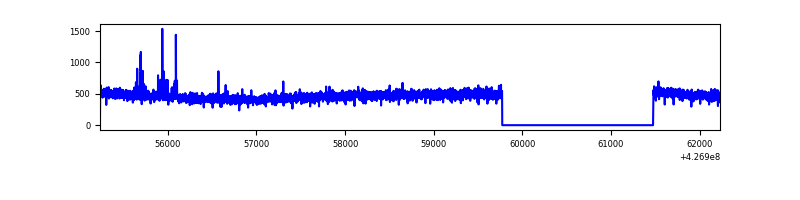 |
| D | 6993 | 5291 | 85 | 85 | 1.22% | 1.61% | 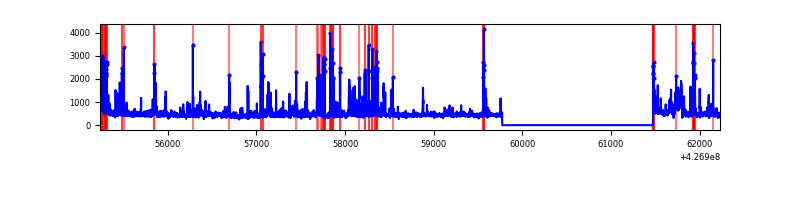 |
Top three noisy pixels from each quadrant. If the there are fewer than three noisy pixels in the level2.evt file, extra rows are filled as -1
| Pixel properties | Quadrant properties | ||||||
|---|---|---|---|---|---|---|---|
| Quadrant | DetID | PixID | Counts | Sigma | Mean | Median | Sigma |
| A | 10 | 83 | 518348 | 4268.82 | 587 | 574 | 121.3 |
| A | 12 | 189 | 19856 | 158.97 | 587 | 574 | 121.3 |
| A | 13 | 6 | 11405 | 89.3 | 587 | 574 | 121.3 |
| B | 5 | 255 | 421155 | 3741.0 | 578 | 562 | 112.4 |
| B | 4 | 81 | 212361 | 1883.86 | 578 | 562 | 112.4 |
| B | 3 | 112 | 29622 | 258.48 | 578 | 562 | 112.4 |
| C | 15 | 214 | 220659 | 1637.83 | 569 | 571 | 134.4 |
| C | 8 | 79 | 25670 | 186.78 | 569 | 571 | 134.4 |
| C | 13 | 61 | 3792 | 23.97 | 569 | 571 | 134.4 |
| D | 13 | 249 | 305599 | 2196.56 | 566 | 550 | 138.9 |
| D | 1 | 52 | 196512 | 1411.06 | 566 | 550 | 138.9 |
| D | 12 | 6 | 109080 | 781.49 | 566 | 550 | 138.9 |
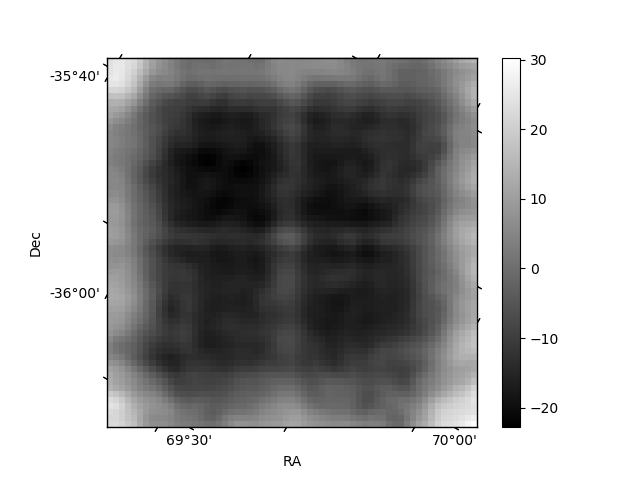
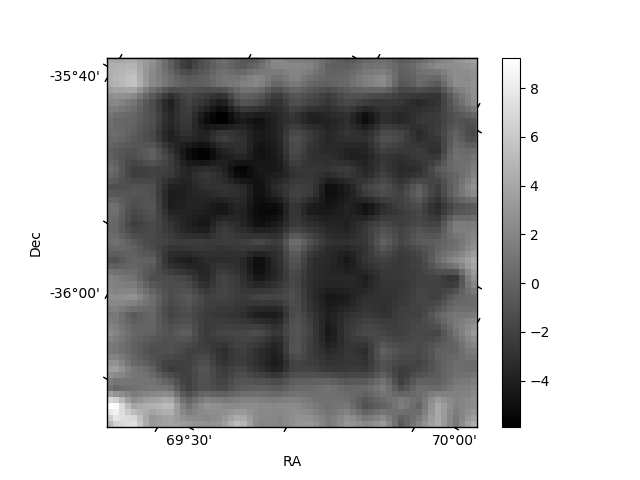
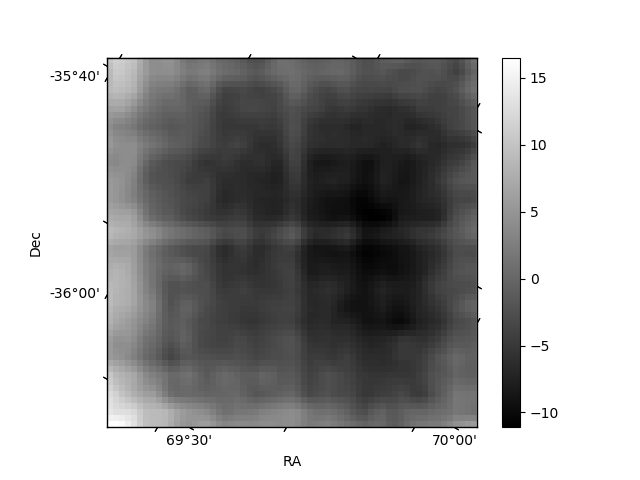
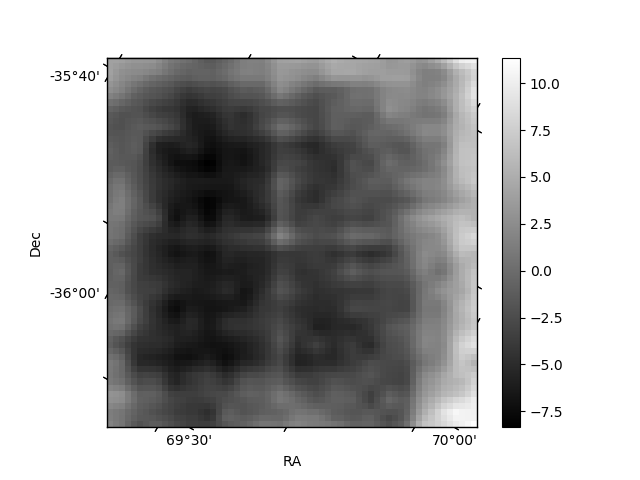
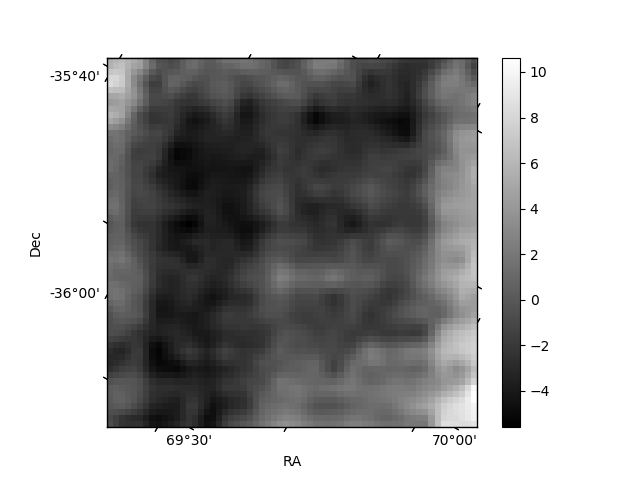
Histogram calculated using DETX and DETY for each event in the final _common_clean file
| Quadrant A | 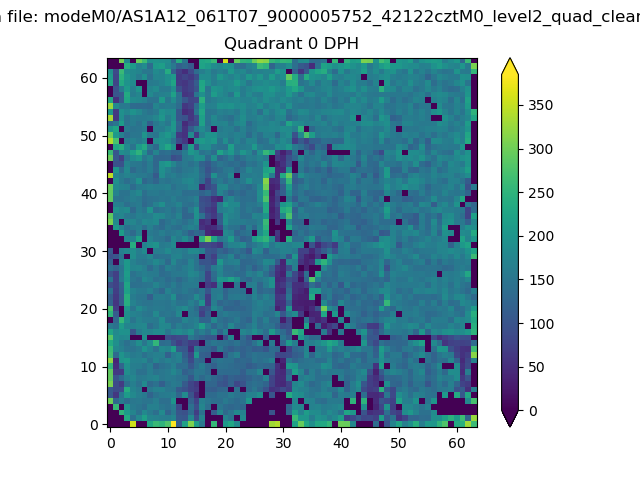 |
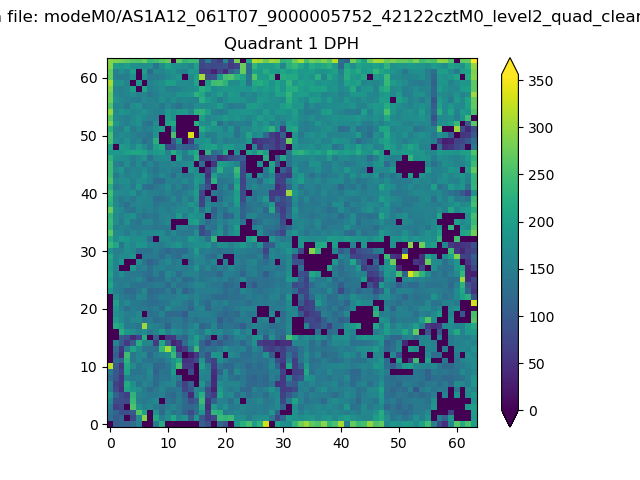 |
Quadrant B |
|---|---|---|---|
| Quadrant D | 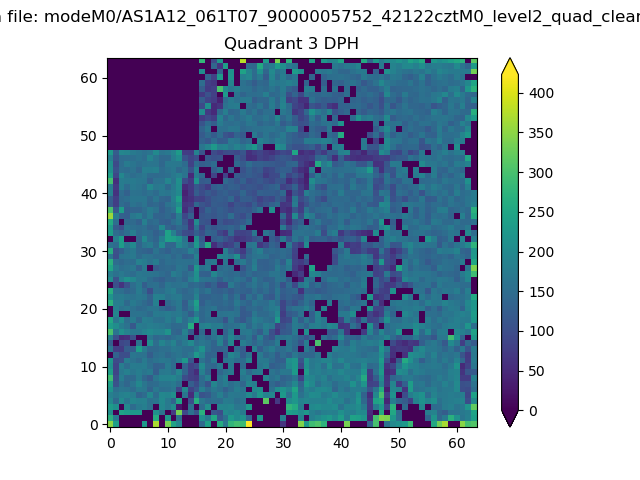 |
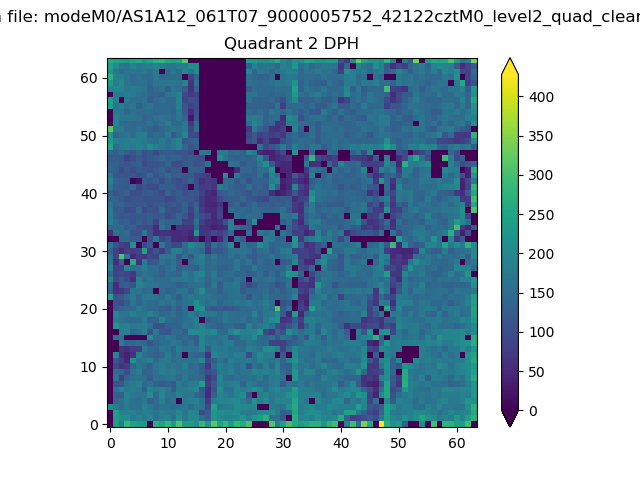 |
Quadrant C |
| Plot type | Count rate plots | Images |
|---|---|---|
| Comparison with Poisson distribution Blue bars denote a histogram of data divided into 1 sec bins. Red curve is a Poisson curve with rate = median count rate of data. |
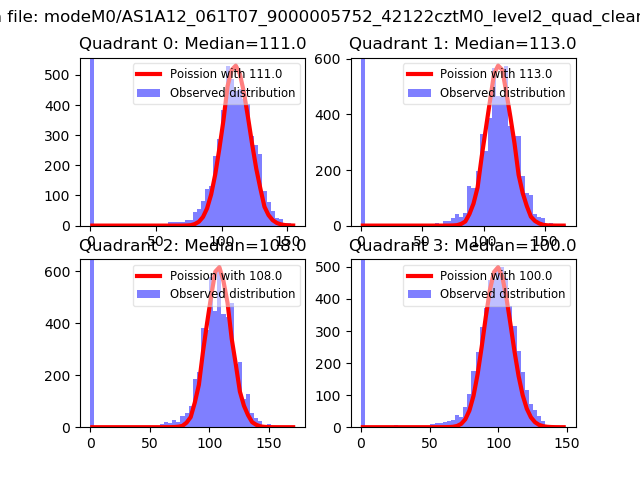 |
 |
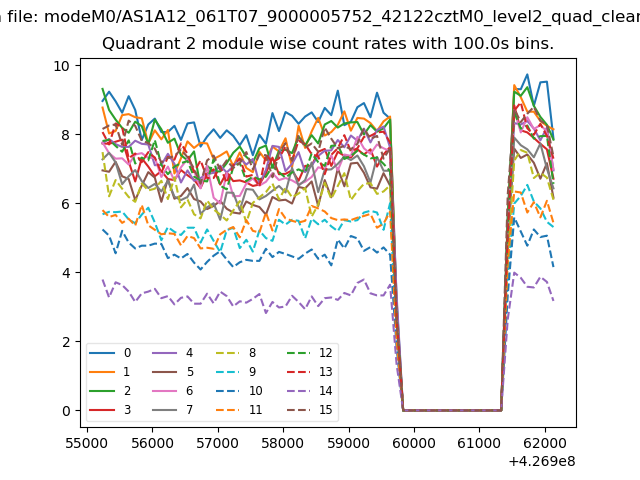
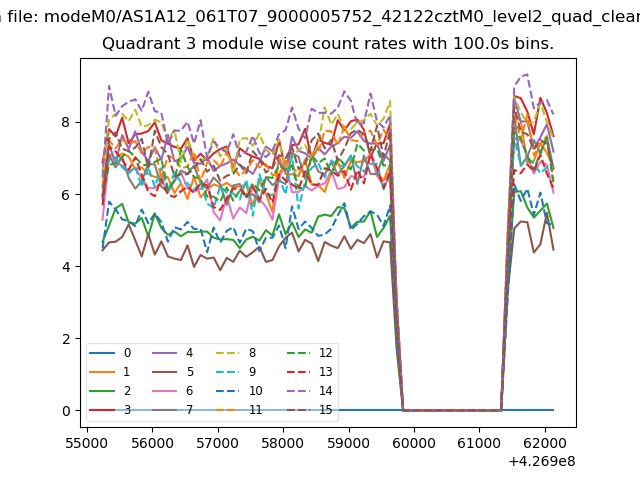
| Quadrant-wise count rates Data is divided into 100 sec bins |
 |
|
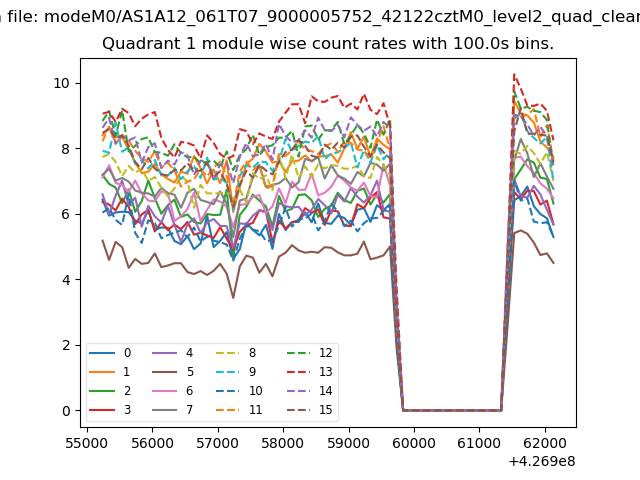
| Module-wise count rates for Quadrant A Data is divided into 100 sec bins |
 |
 |
| Module-wise count rates for Quadrant B Data is divided into 100 sec bins |
 |
 |
| Module-wise count rates for Quadrant C Data is divided into 100 sec bins |
 |
 |
| Module-wise count rates for Quadrant D Data is divided into 100 sec bins |
 |
 |
| Parameter | Plot |
|---|---|
| CZT HV Monitor | 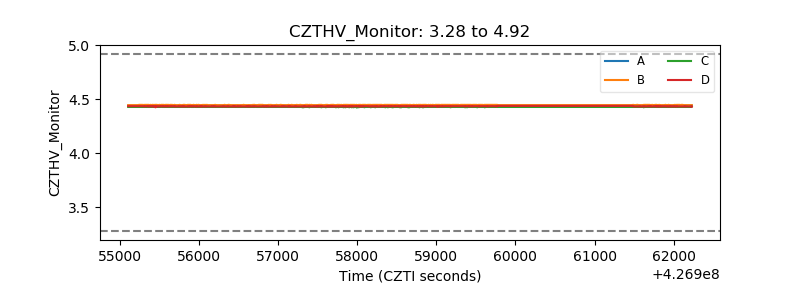 |
| D_VDD | 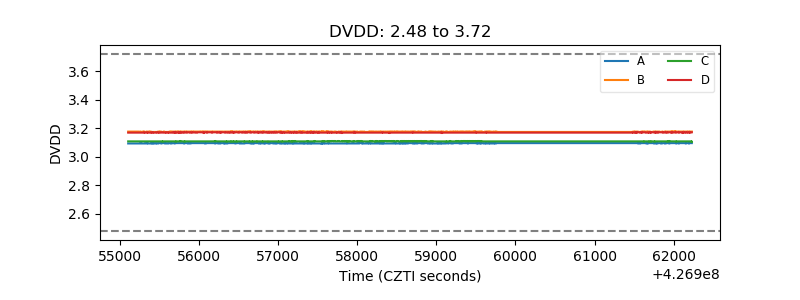 |
| Temperature 1 | 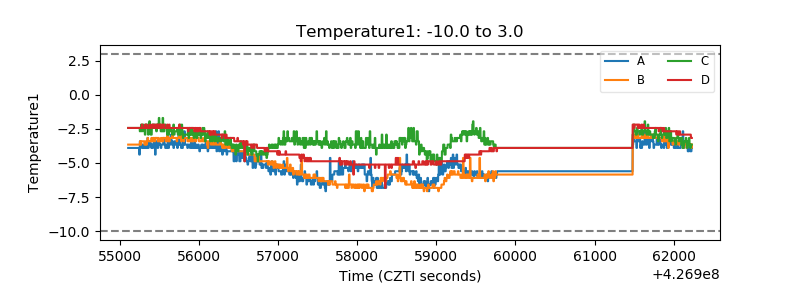 |
| Veto HV Monitor | 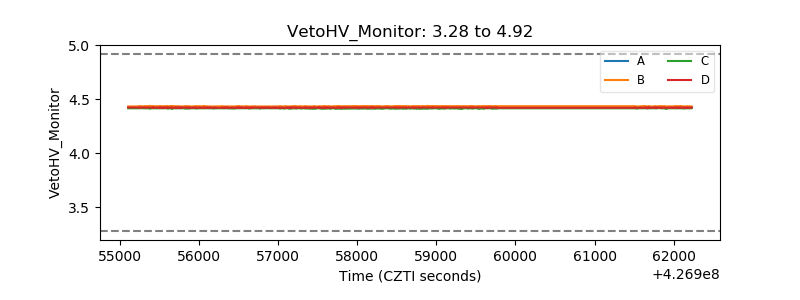 |
| Veto LLD | 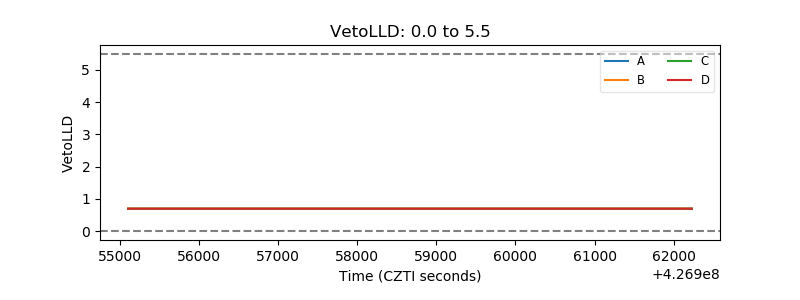 |
| Alpha Counter | 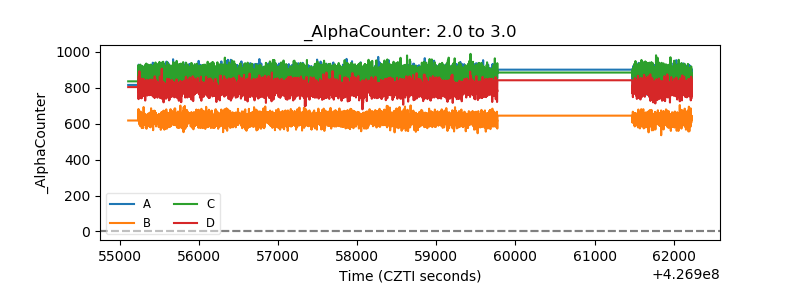 |
| _CPM_Rate | 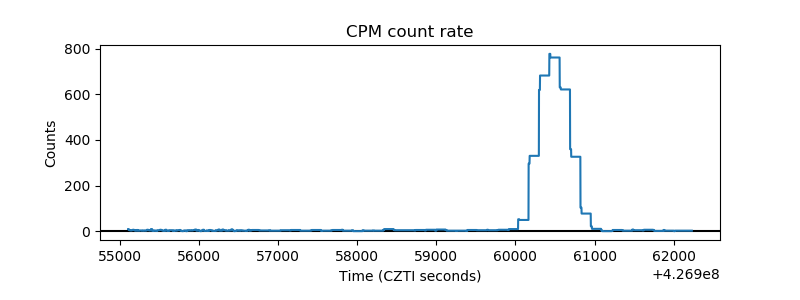 |
| CZT Counter | 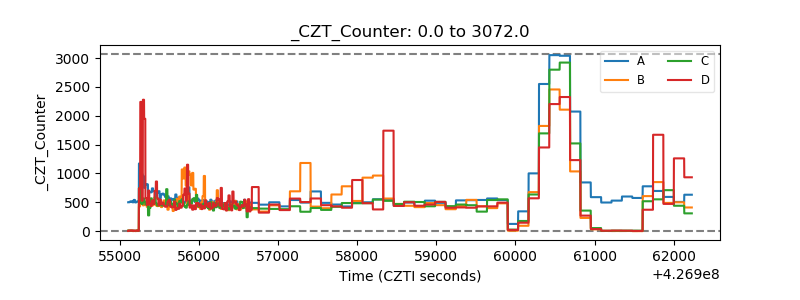 |
| +2.5 Volts monitor | 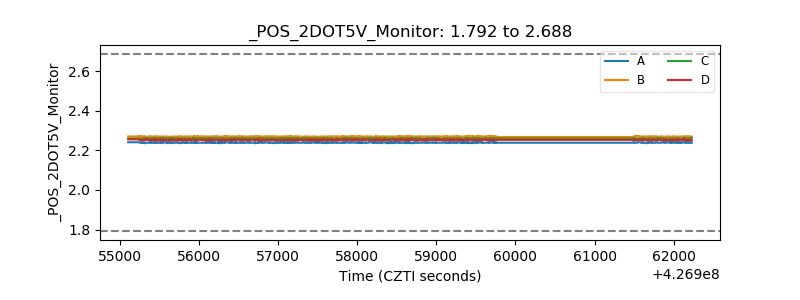 |
| +5 Volts monitor | 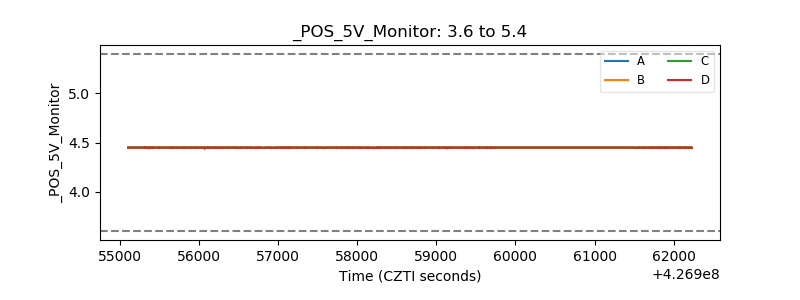 |
| _ROLL_ROT | 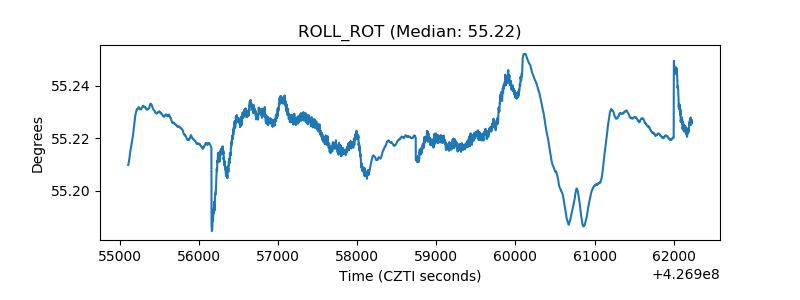 |
| _Roll_DEC | 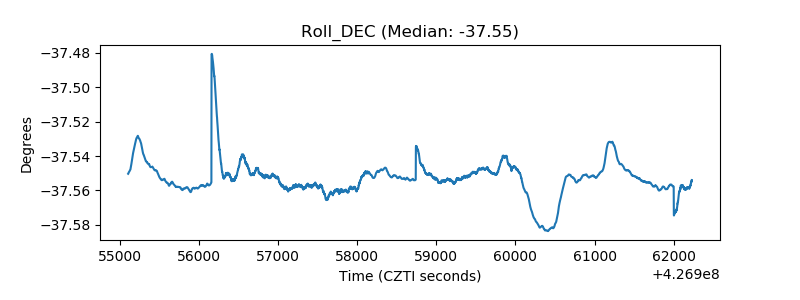 |
| _Roll_RA | 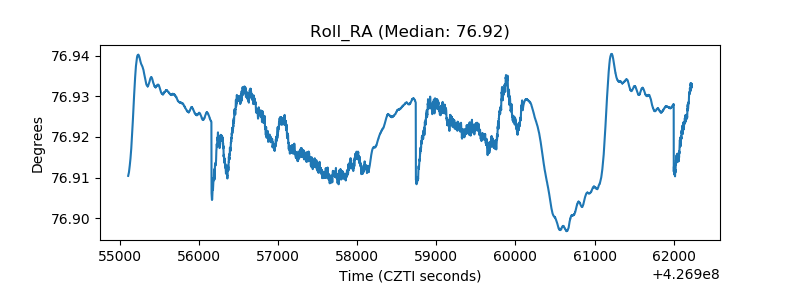 |
| Veto Counter | 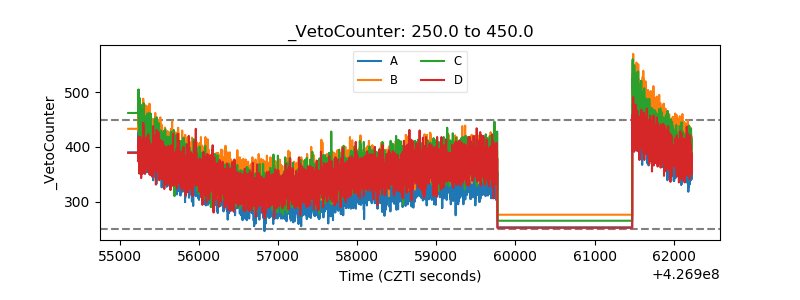 |