| Param | Original file | Final file |
|---|---|---|
| Filename | modeM0/AS1A12_061T07_9000005752_42124cztM0_level2.fits | modeM0/AS1A12_061T07_9000005752_42124cztM0_level2_quad_clean.evt |
| Size (bytes) | 622,658,880 | 176,235,840 |
| Size | 593.8 MB | 168.1 MB |
| Events in quadrant A | 5,573,879 | 1,188,254 |
| Events in quadrant B | 5,550,773 | 1,211,588 |
| Events in quadrant C | 5,080,726 | 1,154,033 |
| Events in quadrant D | 6,022,097 | 1,049,513 |
| Mode M0 | |||
|---|---|---|---|
| Quadrant | BADHDUFLAG | Total packets | Discarded packets |
| A | 0 | 22783 | 3 |
| B | 0 | 23590 | 3 |
| C | 0 | 21653 | 3 |
| D | 0 | 25318 | 4 |
| Mode SS | |||
|---|---|---|---|
| Quadrant | BADHDUFLAG | Total packets | Discarded packets |
| A | 0 | 218 | 0 |
| B | 0 | 218 | 0 |
| C | 0 | 218 | 0 |
| D | 0 | 218 | 0 |
| Mode M9 | |||
|---|---|---|---|
| Quadrant | BADHDUFLAG | Total packets | Discarded packets |
| A | 0 | 51 | 0 |
| B | 0 | 51 | 0 |
| C | 0 | 51 | 0 |
| D | 0 | 51 | 0 |
| Quadrant | Total seconds | Saturated seconds | Saturation percentage |
|---|---|---|---|
| A | 10585 | 19 | 0.179499% |
| B | 10585 | 95 | 0.897496% |
| C | 10585 | 10 | 0.094473% |
| D | 10584 | 248 | 2.343159% |
Noise dominated data is calculated using 1-second bins in cleaned event files. If a bin has >2000 counts, and if more than 50% of those come from <1% of pixels, then it is considered to be noise-dominated and hence unusable.
| Quadrant | # 1 sec bins | Bins with >0 counts | Bins with >2000 counts | High rate bins dominated by noise | Noise dominated (total time) | Noise dominated (detector-on time) | Marked lightcurve |
|---|---|---|---|---|---|---|---|
| A | 15695 | 10588 | 4 | 4 | 0.03% | 0.04% | 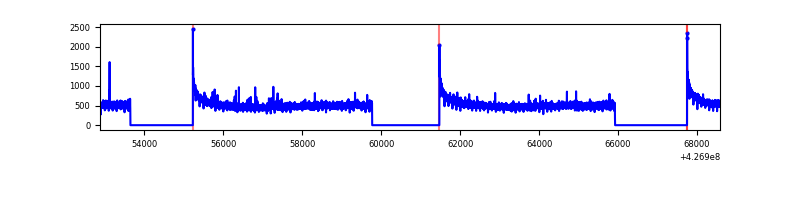 |
| B | 15695 | 10588 | 48 | 48 | 0.31% | 0.45% | 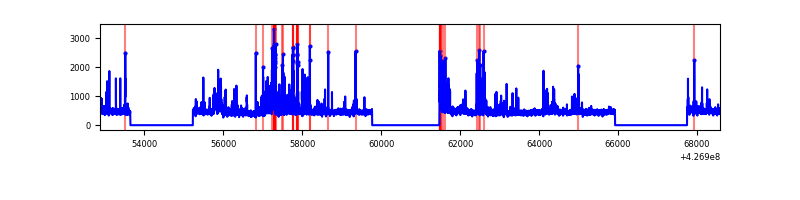 |
| C | 15695 | 10588 | 8 | 8 | 0.05% | 0.08% | 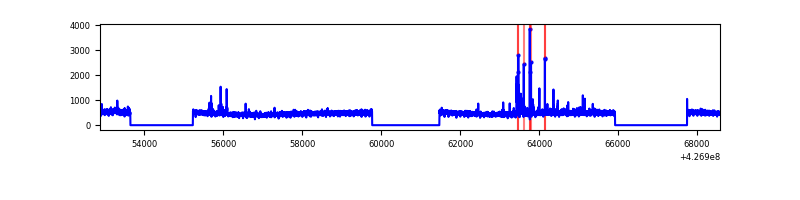 |
| D | 15694 | 10587 | 207 | 207 | 1.32% | 1.96% | 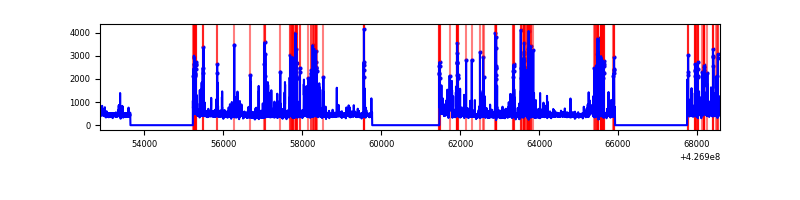 |
Top three noisy pixels from each quadrant. If the there are fewer than three noisy pixels in the level2.evt file, extra rows are filled as -1
| Pixel properties | Quadrant properties | ||||||
|---|---|---|---|---|---|---|---|
| Quadrant | DetID | PixID | Counts | Sigma | Mean | Median | Sigma |
| A | 10 | 83 | 947014 | 3906.99 | 1185 | 1161 | 242.1 |
| A | 12 | 189 | 25443 | 100.3 | 1185 | 1161 | 242.1 |
| A | 13 | 6 | 16843 | 64.78 | 1185 | 1161 | 242.1 |
| B | 5 | 255 | 633237 | 2822.67 | 1173 | 1142 | 223.9 |
| B | 4 | 81 | 214146 | 951.19 | 1173 | 1142 | 223.9 |
| B | 3 | 112 | 43770 | 190.36 | 1173 | 1142 | 223.9 |
| C | 15 | 214 | 436061 | 1613.42 | 1154 | 1159 | 269.6 |
| C | 8 | 79 | 117969 | 433.35 | 1154 | 1159 | 269.6 |
| C | 15 | 159 | 28346 | 100.86 | 1154 | 1159 | 269.6 |
| D | 13 | 249 | 469774 | 1696.44 | 1140 | 1107 | 276.3 |
| D | 1 | 52 | 468212 | 1690.78 | 1140 | 1107 | 276.3 |
| D | 12 | 6 | 444801 | 1606.04 | 1140 | 1107 | 276.3 |
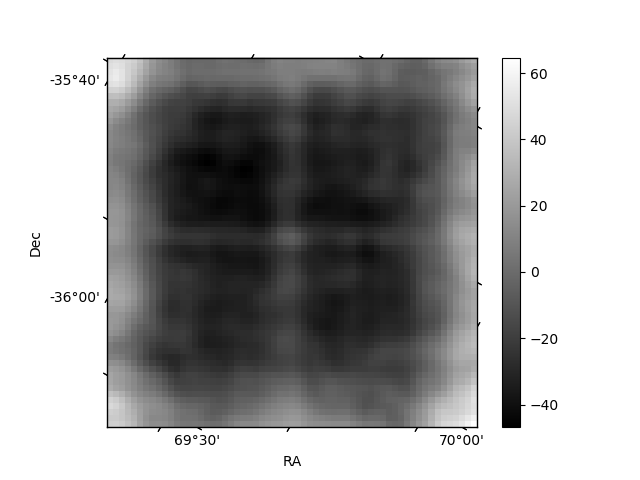
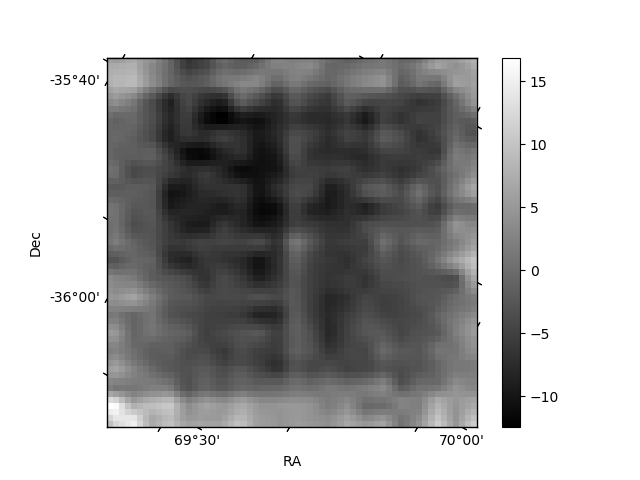
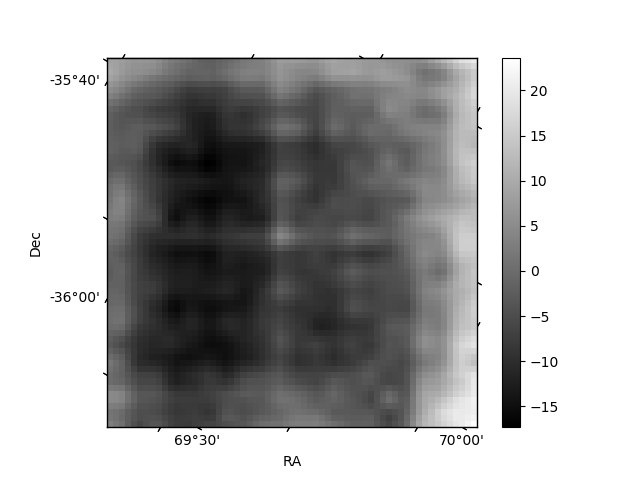
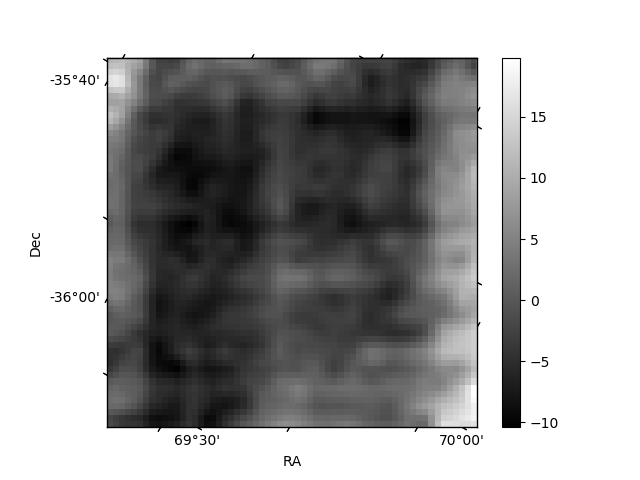
Histogram calculated using DETX and DETY for each event in the final _common_clean file
| Quadrant A | 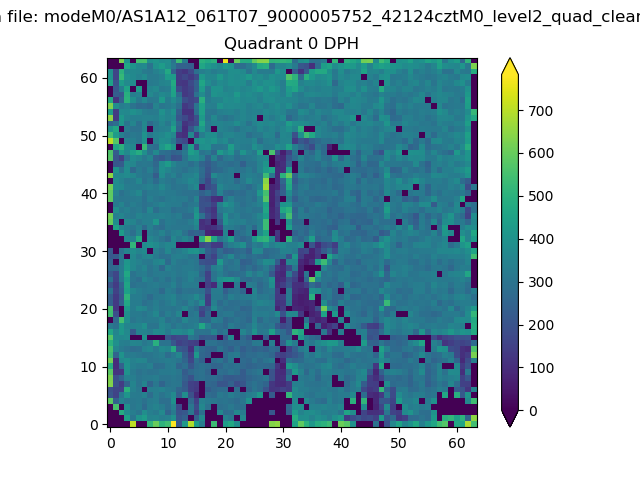 |
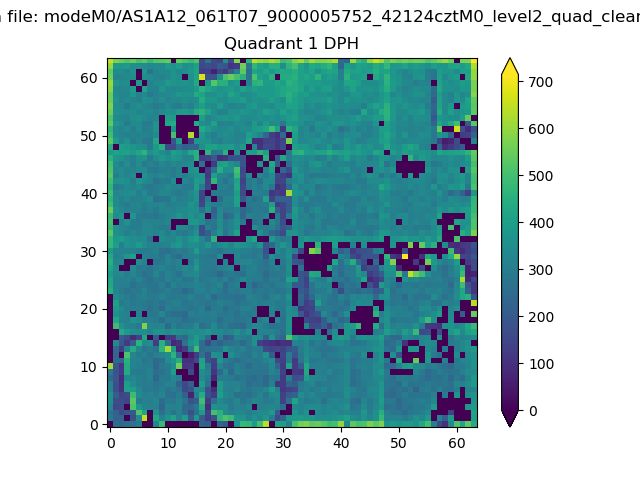 |
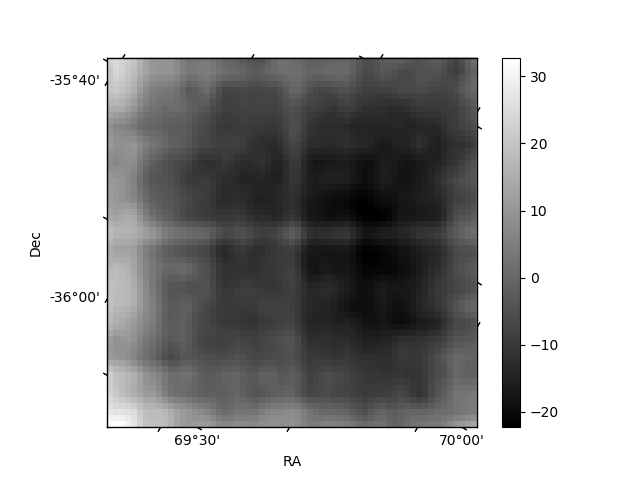
Quadrant B |
|---|---|---|---|
| Quadrant D | 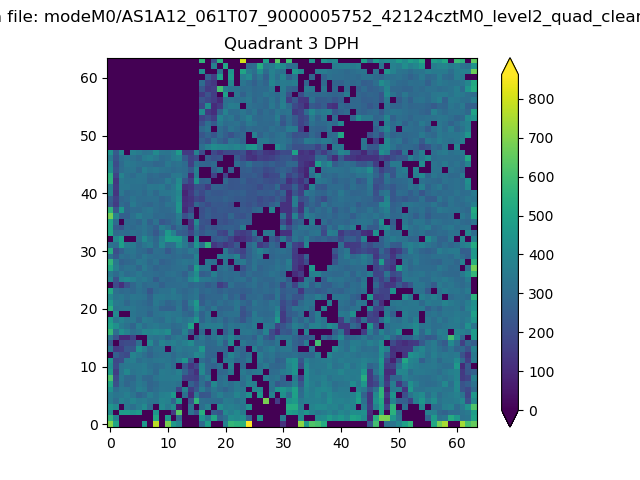 |
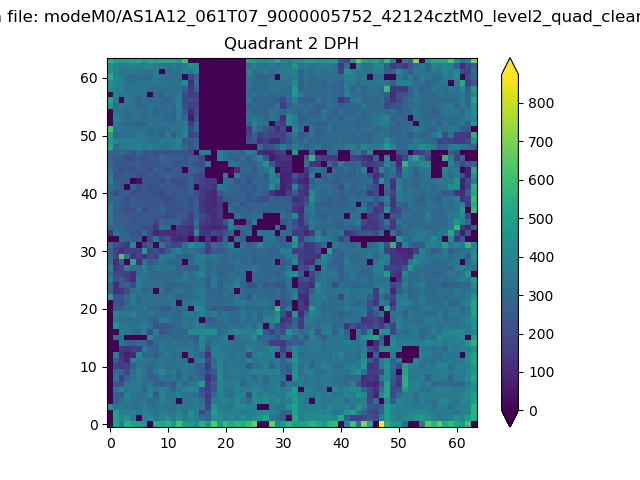 |
Quadrant C |
| Plot type | Count rate plots | Images |
|---|---|---|
| Comparison with Poisson distribution Blue bars denote a histogram of data divided into 1 sec bins. Red curve is a Poisson curve with rate = median count rate of data. |
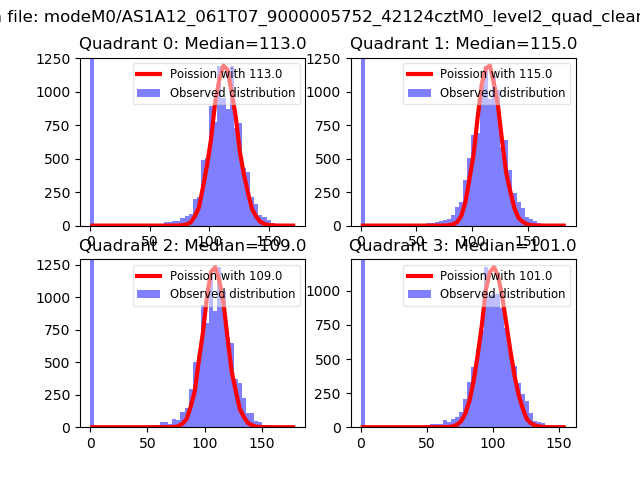 |
 |
| Quadrant-wise count rates Data is divided into 100 sec bins |
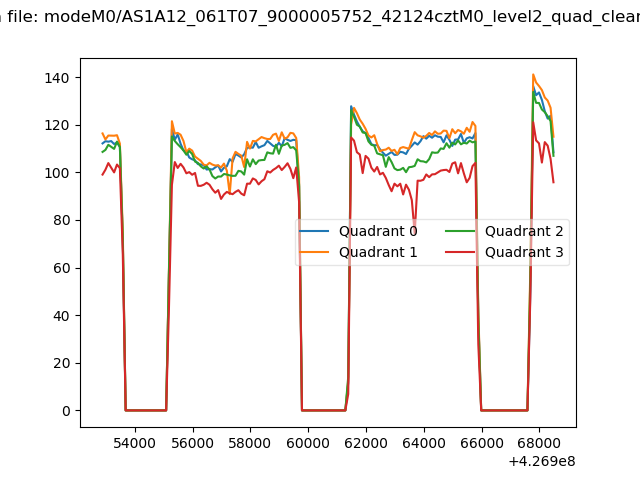 |
|
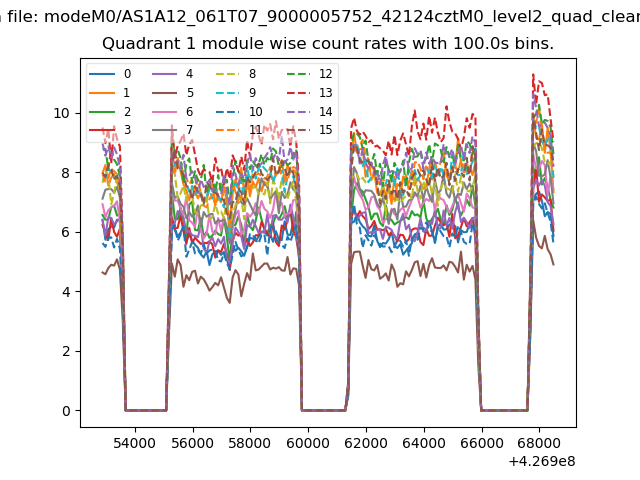
| Module-wise count rates for Quadrant A Data is divided into 100 sec bins |
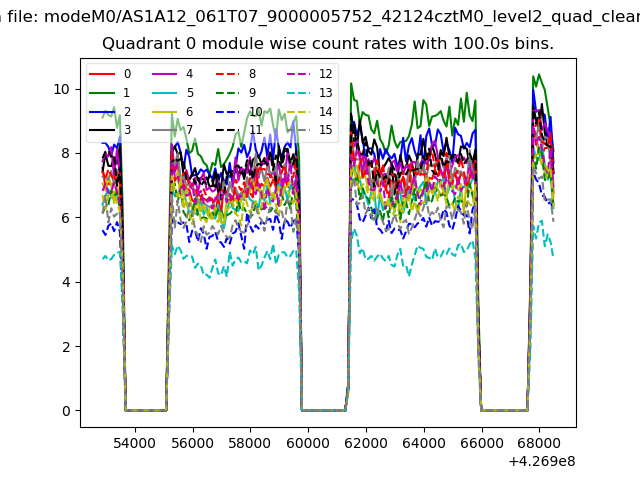 |
 |
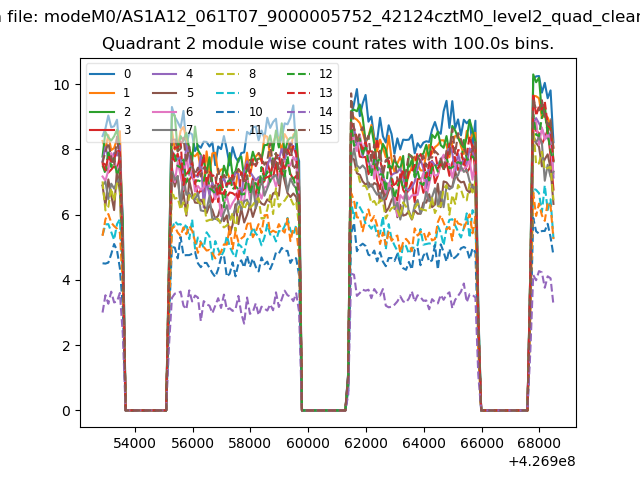
| Module-wise count rates for Quadrant B Data is divided into 100 sec bins |
 |
 |
| Module-wise count rates for Quadrant C Data is divided into 100 sec bins |
 |
 |
| Module-wise count rates for Quadrant D Data is divided into 100 sec bins |
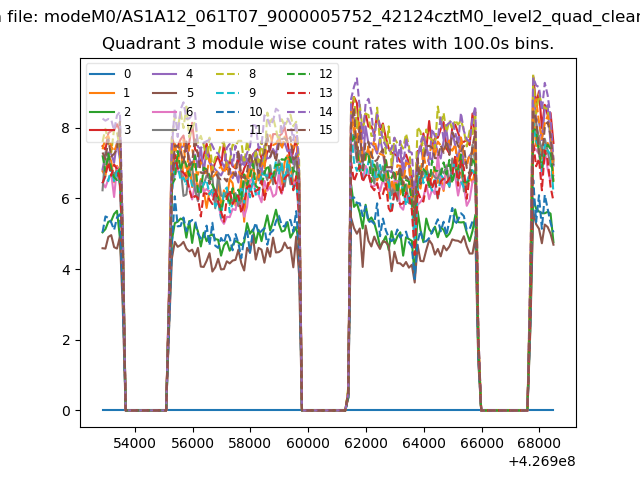 |
 |
| Parameter | Plot |
|---|---|
| CZT HV Monitor | 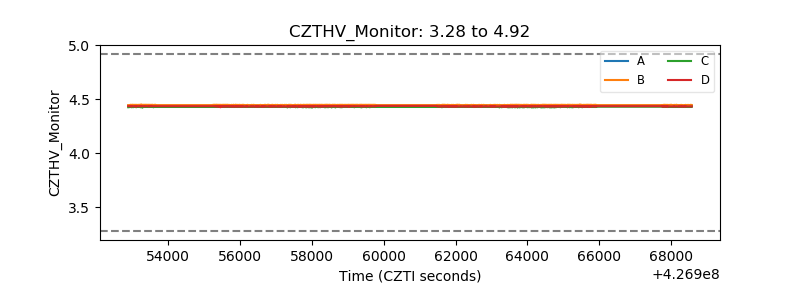 |
| D_VDD | 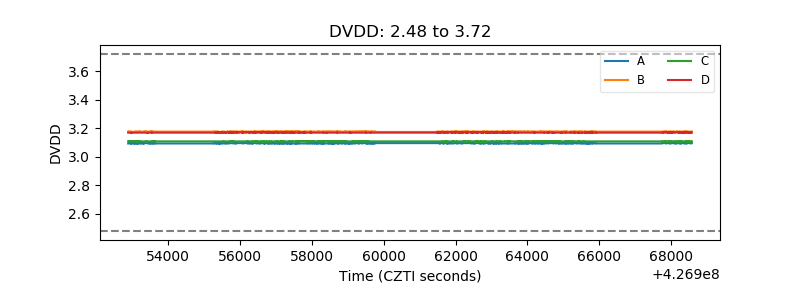 |
| Temperature 1 | 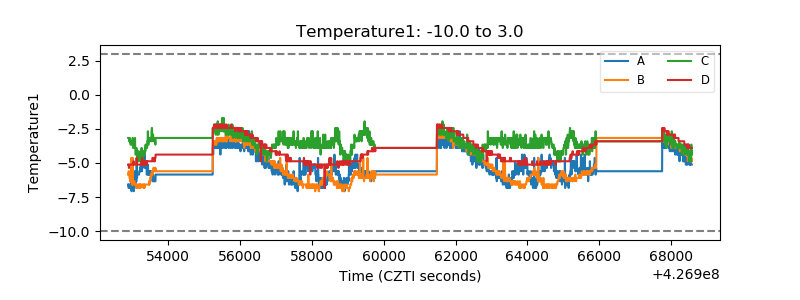 |
| Veto HV Monitor | 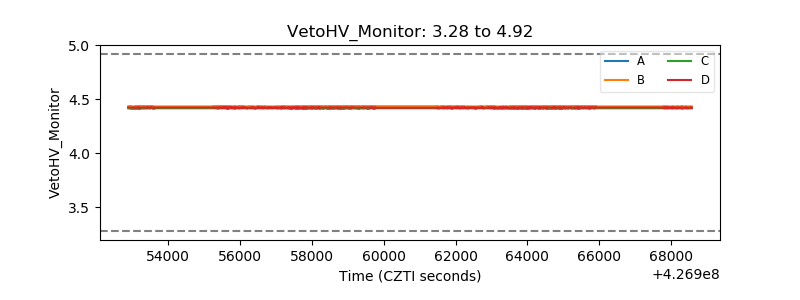 |
| Veto LLD | 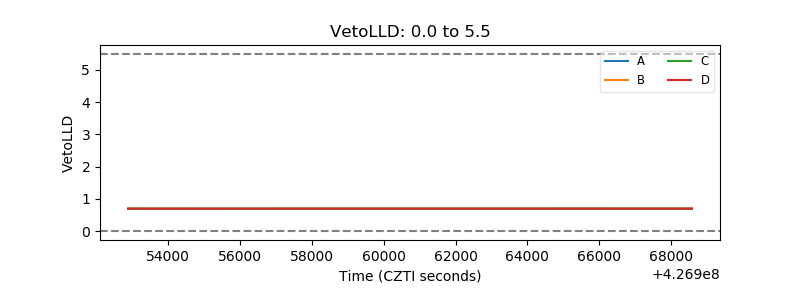 |
| Alpha Counter | 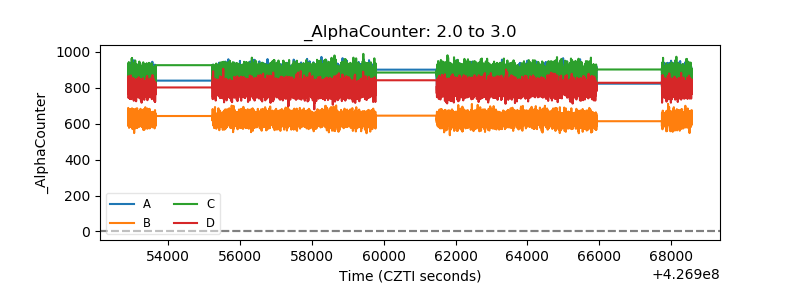 |
| _CPM_Rate | 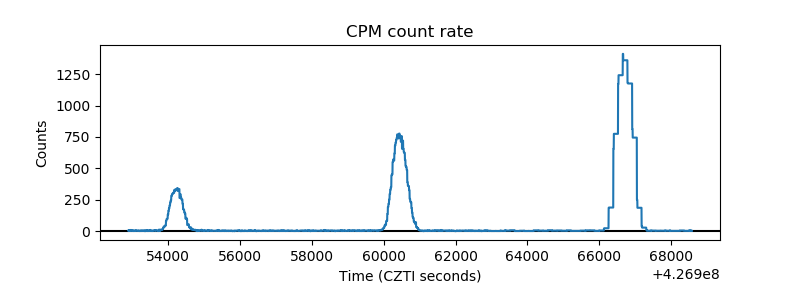 |
| CZT Counter | 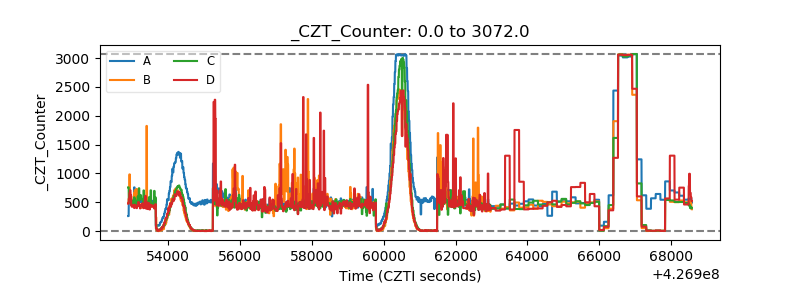 |
| +2.5 Volts monitor | 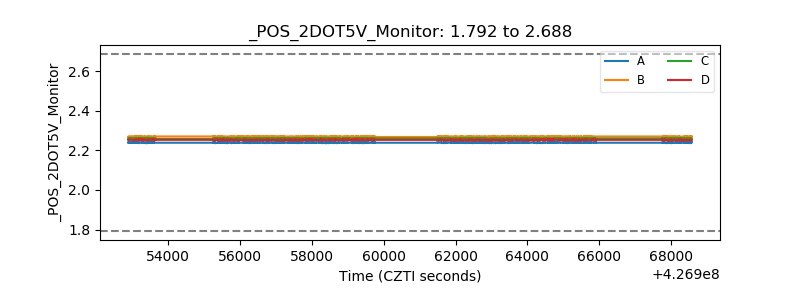 |
| +5 Volts monitor |  |
| _ROLL_ROT | 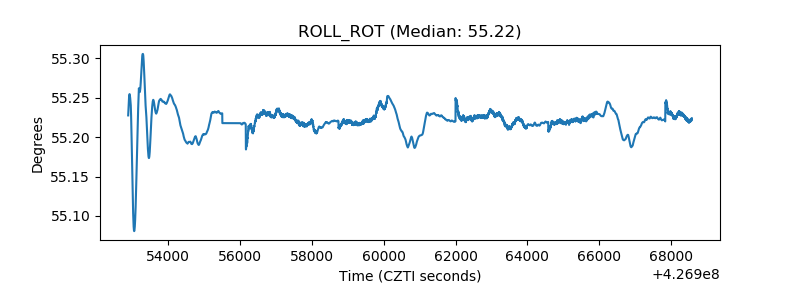 |
| _Roll_DEC | 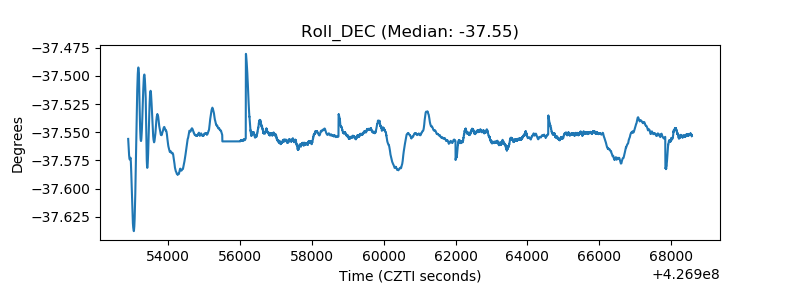 |
| _Roll_RA | 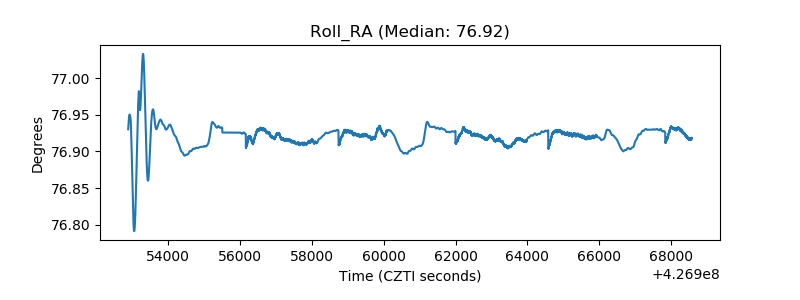 |
| Veto Counter | 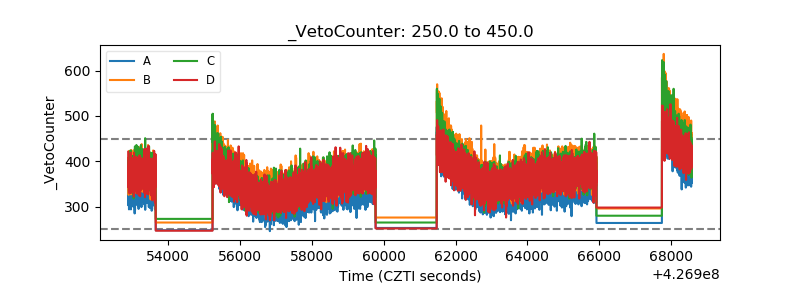 |