| Param | Original file | Final file |
|---|---|---|
| Filename | modeM0/AS1A12_061T07_9000005752_42125cztM0_level2.fits | modeM0/AS1A12_061T07_9000005752_42125cztM0_level2_quad_clean.evt |
| Size (bytes) | 332,328,960 | 91,434,240 |
| Size | 316.9 MB | 87.2 MB |
| Events in quadrant A | 2,857,229 | 629,822 |
| Events in quadrant B | 2,462,449 | 648,667 |
| Events in quadrant C | 2,482,698 | 605,512 |
| Events in quadrant D | 4,099,993 | 525,859 |
| Mode M0 | |||
|---|---|---|---|
| Quadrant | BADHDUFLAG | Total packets | Discarded packets |
| A | 0 | 11455 | 2 |
| B | 0 | 10567 | 2 |
| C | 0 | 10323 | 2 |
| D | 0 | 15610 | 2 |
| Mode SS | |||
|---|---|---|---|
| Quadrant | BADHDUFLAG | Total packets | Discarded packets |
| A | 0 | 104 | 0 |
| B | 0 | 104 | 0 |
| C | 0 | 104 | 0 |
| D | 0 | 104 | 0 |
| Mode M9 | |||
|---|---|---|---|
| Quadrant | BADHDUFLAG | Total packets | Discarded packets |
| A | 0 | 25 | 0 |
| B | 0 | 26 | 0 |
| C | 0 | 26 | 0 |
| D | 0 | 26 | 0 |
| Quadrant | Total seconds | Saturated seconds | Saturation percentage |
|---|---|---|---|
| A | 5125 | 16 | 0.312195% |
| B | 5125 | 12 | 0.234146% |
| C | 5125 | 7 | 0.136585% |
| D | 5125 | 386 | 7.531707% |
Noise dominated data is calculated using 1-second bins in cleaned event files. If a bin has >2000 counts, and if more than 50% of those come from <1% of pixels, then it is considered to be noise-dominated and hence unusable.
| Quadrant | # 1 sec bins | Bins with >0 counts | Bins with >2000 counts | High rate bins dominated by noise | Noise dominated (total time) | Noise dominated (detector-on time) | Marked lightcurve |
|---|---|---|---|---|---|---|---|
| A | 7097 | 5126 | 3 | 3 | 0.04% | 0.06% | 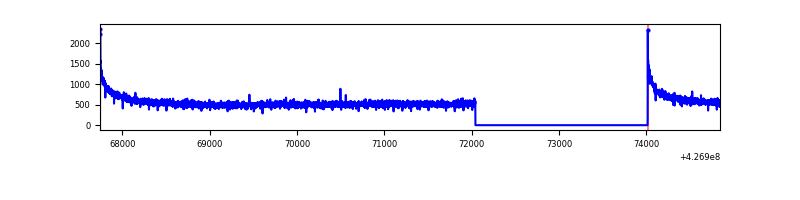 |
| B | 7097 | 5126 | 5 | 5 | 0.07% | 0.10% | 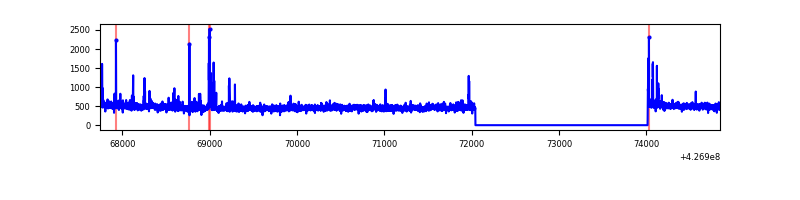 |
| C | 7097 | 5126 | 0 | 0 | 0.00% | 0.00% | 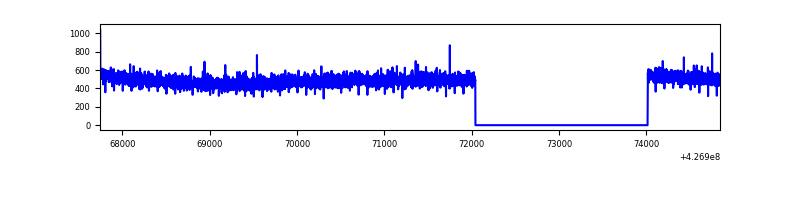 |
| D | 7097 | 5126 | 359 | 359 | 5.06% | 7.00% | 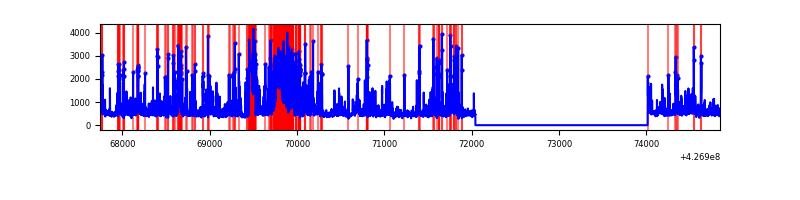 |
Top three noisy pixels from each quadrant. If the there are fewer than three noisy pixels in the level2.evt file, extra rows are filled as -1
| Pixel properties | Quadrant properties | ||||||
|---|---|---|---|---|---|---|---|
| Quadrant | DetID | PixID | Counts | Sigma | Mean | Median | Sigma |
| A | 10 | 83 | 516019 | 4221.54 | 599 | 588 | 122.1 |
| A | 13 | 6 | 22557 | 179.93 | 599 | 588 | 122.1 |
| A | 3 | 137 | 6609 | 49.31 | 599 | 588 | 122.1 |
| B | 5 | 255 | 72570 | 634.72 | 596 | 581 | 113.4 |
| B | 0 | 183 | 21473 | 184.2 | 596 | 581 | 113.4 |
| B | 0 | 229 | 20509 | 175.7 | 596 | 581 | 113.4 |
| C | 15 | 214 | 215374 | 1592.83 | 581 | 584 | 134.8 |
| C | 13 | 61 | 3903 | 24.61 | 581 | 584 | 134.8 |
| C | 15 | 159 | 2080 | 11.09 | 581 | 584 | 134.8 |
| D | 13 | 249 | 1051105 | 7777.73 | 558 | 542 | 135.1 |
| D | 1 | 52 | 591539 | 4375.39 | 558 | 542 | 135.1 |
| D | 12 | 6 | 203797 | 1504.78 | 558 | 542 | 135.1 |
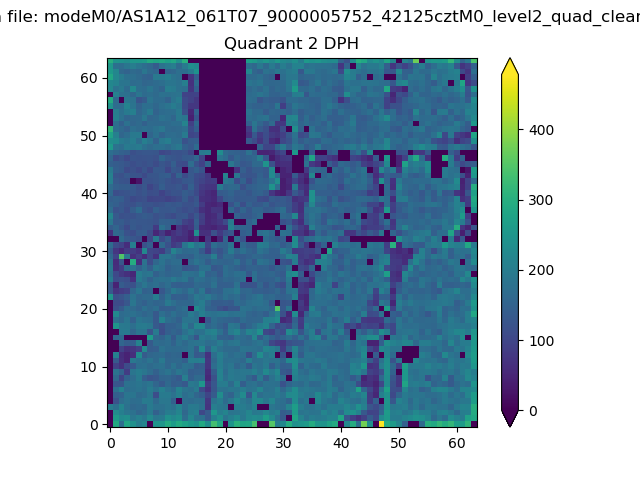
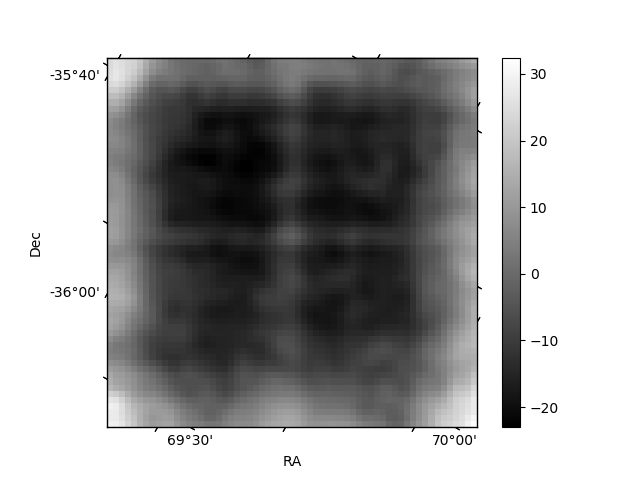
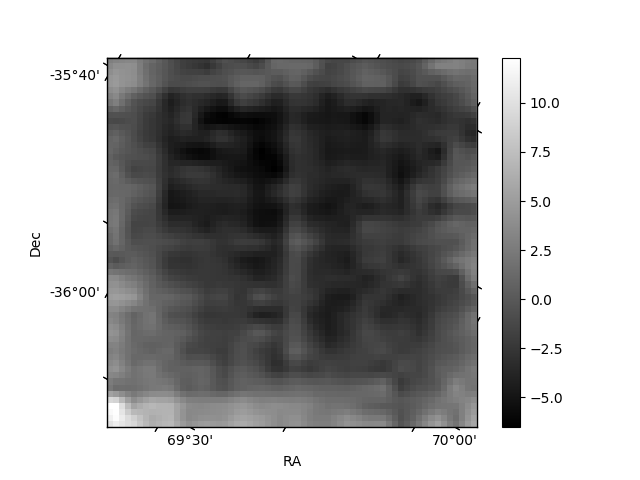
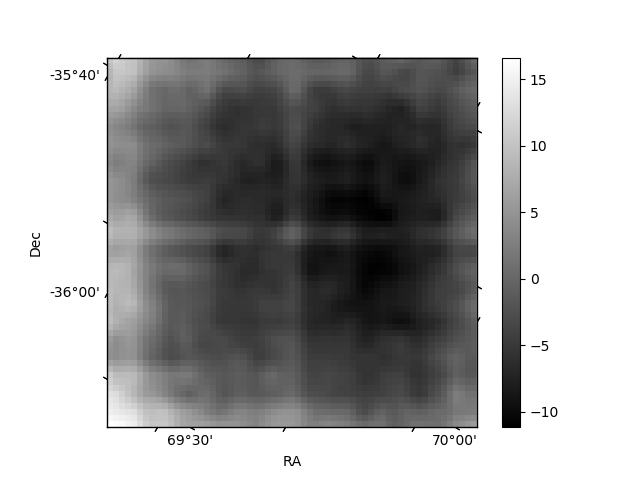
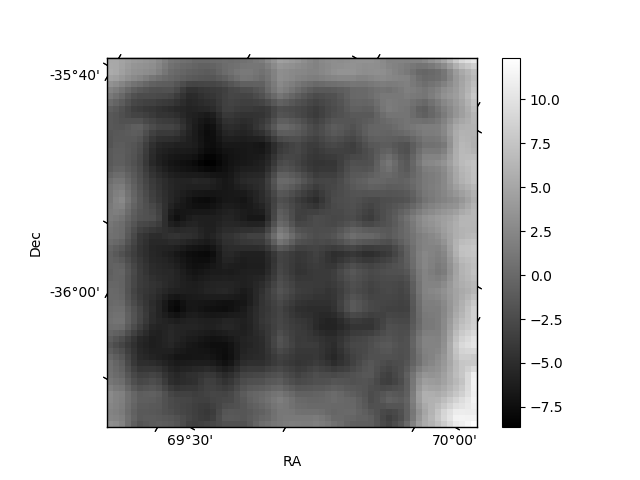
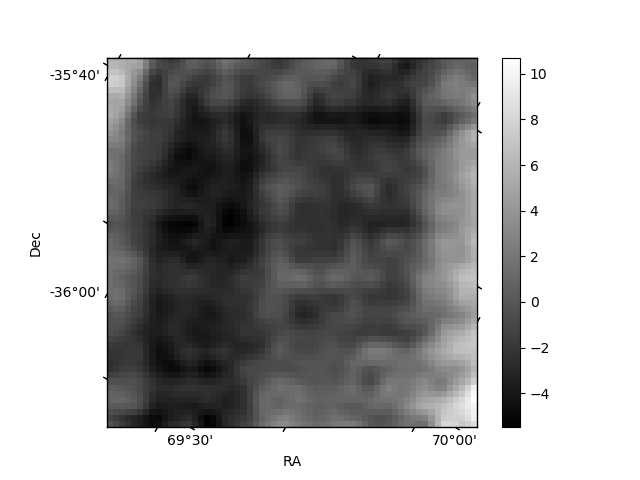
Histogram calculated using DETX and DETY for each event in the final _common_clean file
| Quadrant A | 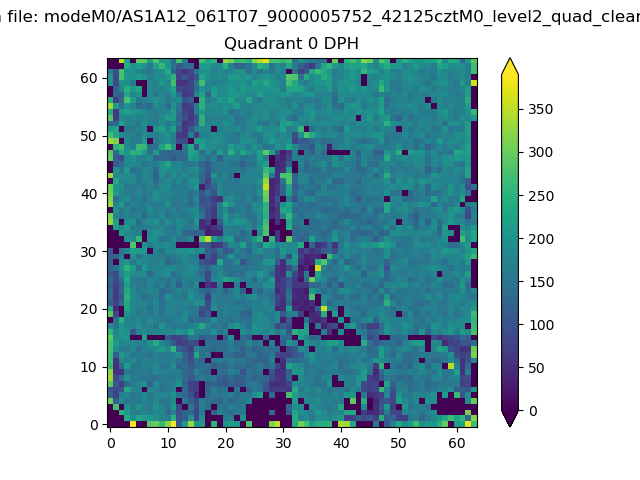 |
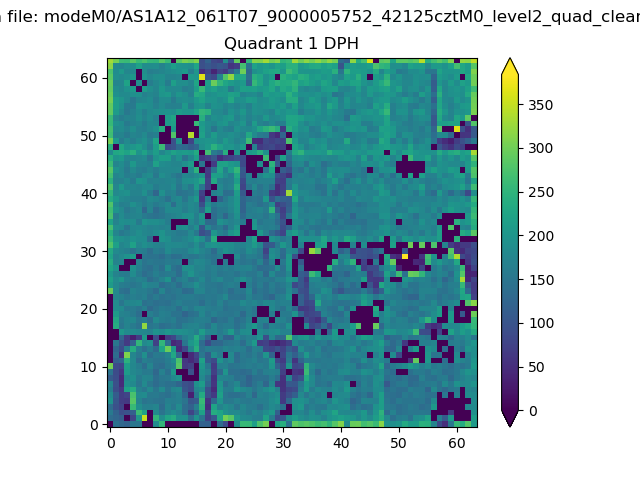 |
Quadrant B |
|---|---|---|---|
| Quadrant D | 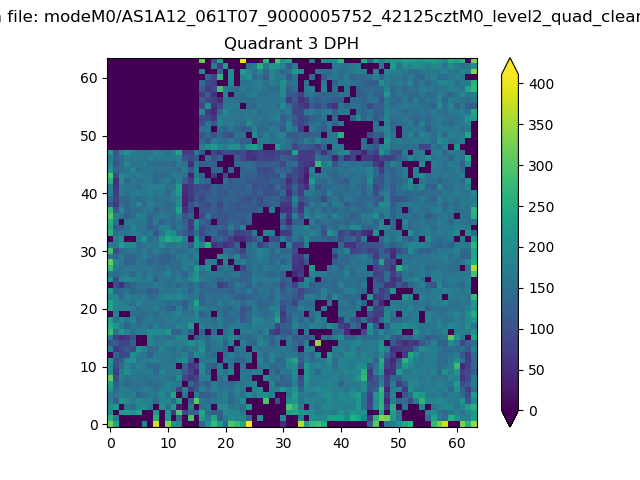 |
 |
Quadrant C |
| Plot type | Count rate plots | Images |
|---|---|---|
| Comparison with Poisson distribution Blue bars denote a histogram of data divided into 1 sec bins. Red curve is a Poisson curve with rate = median count rate of data. |
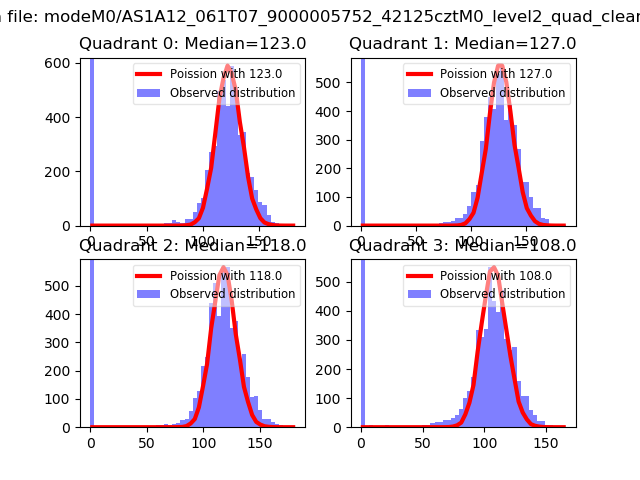 |
 |
| Quadrant-wise count rates Data is divided into 100 sec bins |
 |
|
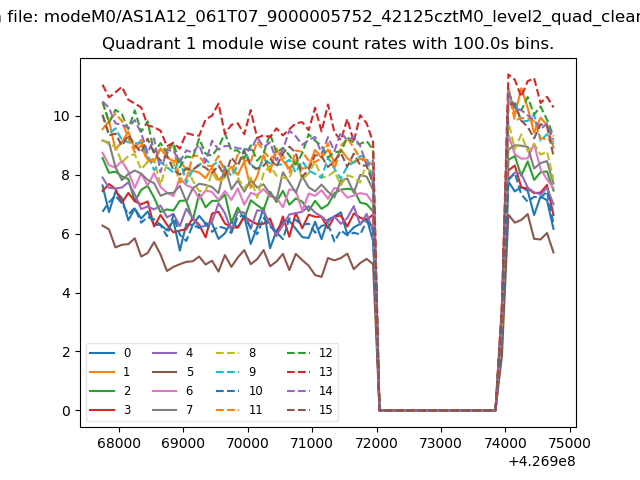
| Module-wise count rates for Quadrant A Data is divided into 100 sec bins |
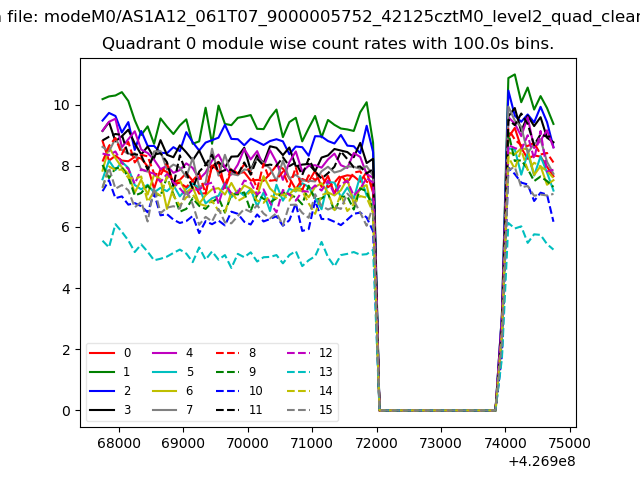 |
 |
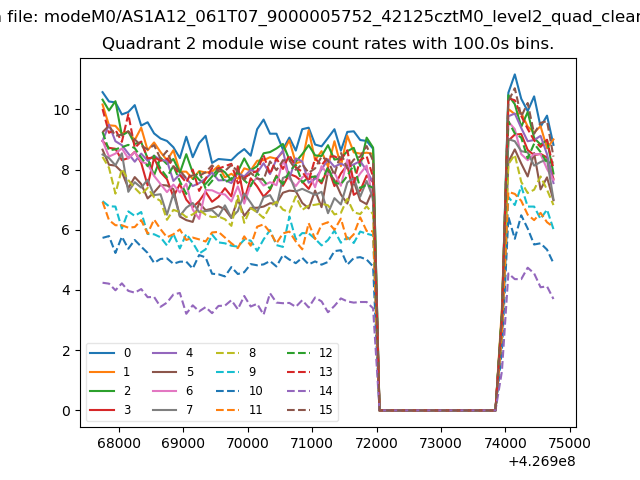
| Module-wise count rates for Quadrant B Data is divided into 100 sec bins |
 |
 |
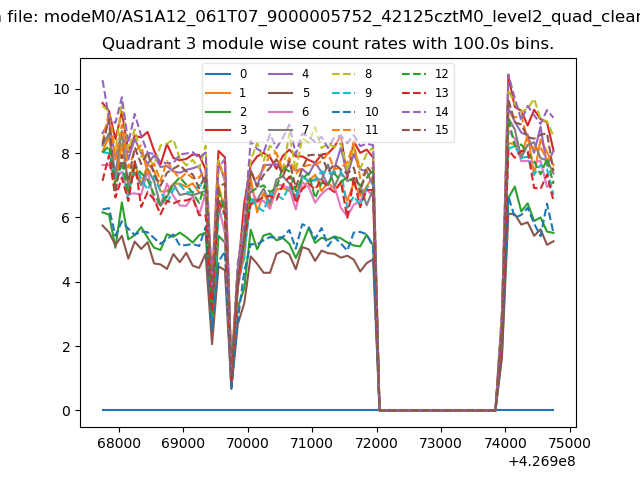
| Module-wise count rates for Quadrant C Data is divided into 100 sec bins |
 |
 |
| Module-wise count rates for Quadrant D Data is divided into 100 sec bins |
 |
 |
| Parameter | Plot |
|---|---|
| CZT HV Monitor | 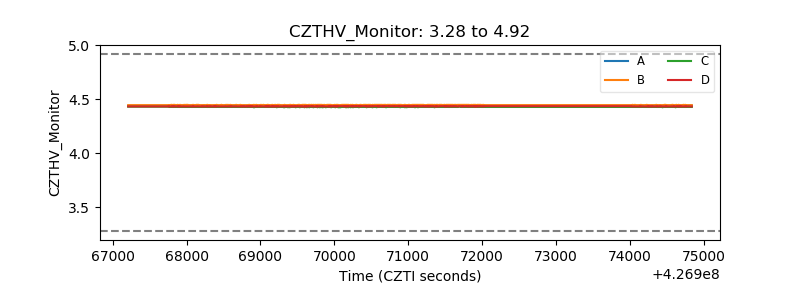 |
| D_VDD | 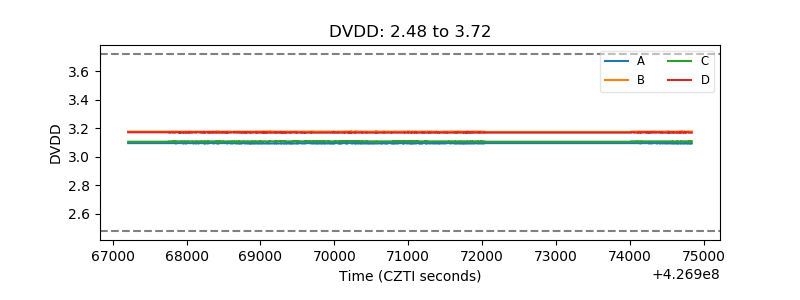 |
| Temperature 1 | 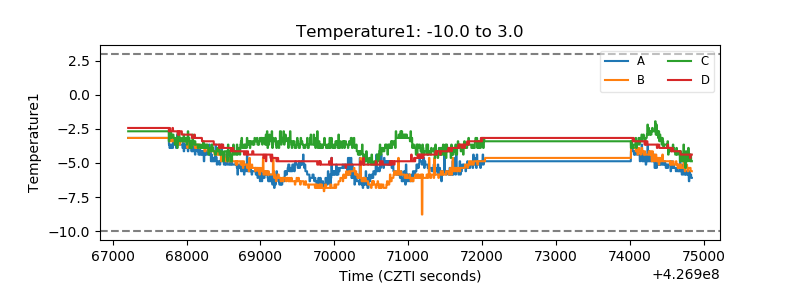 |
| Veto HV Monitor | 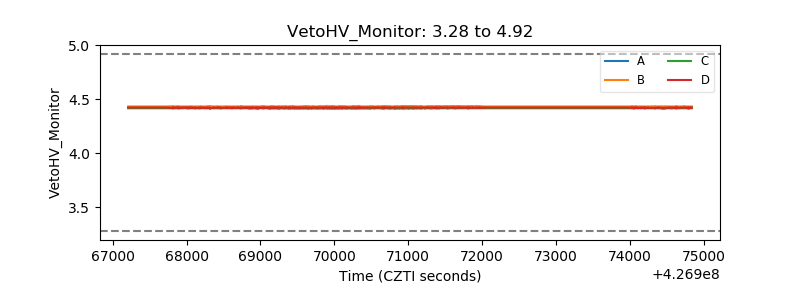 |
| Veto LLD | 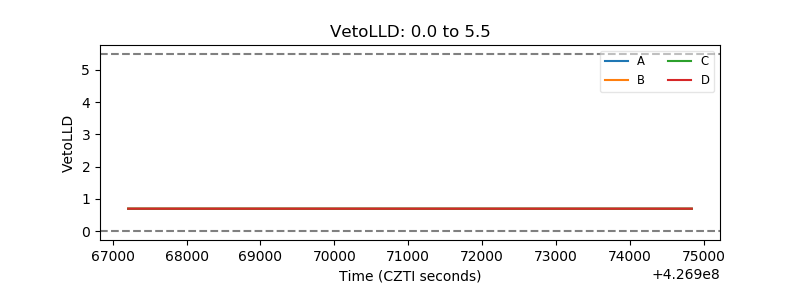 |
| Alpha Counter | 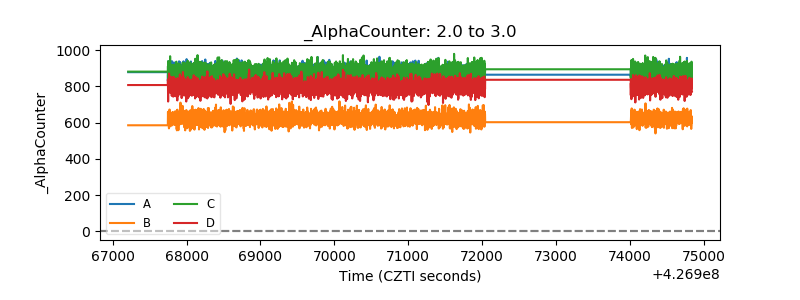 |
| _CPM_Rate | 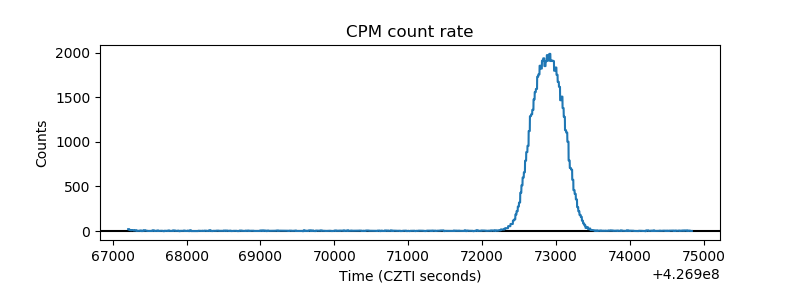 |
| CZT Counter | 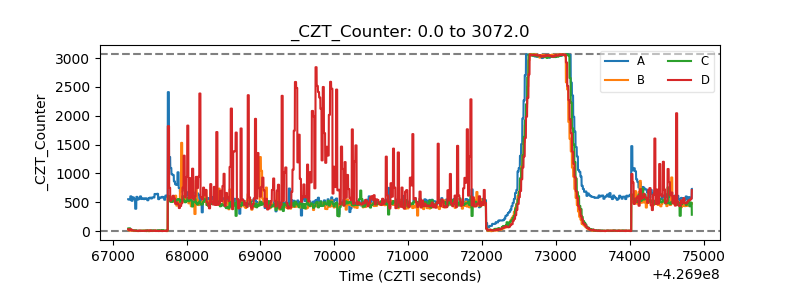 |
| +2.5 Volts monitor | 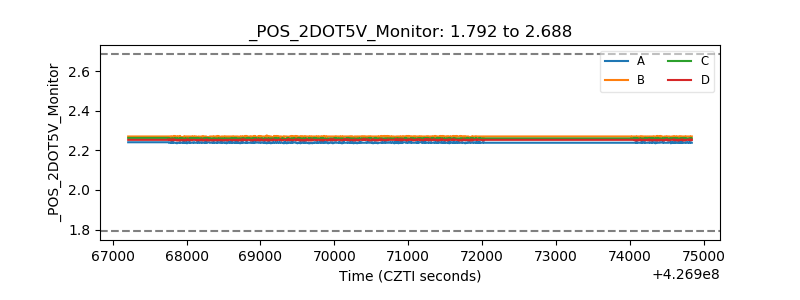 |
| +5 Volts monitor | 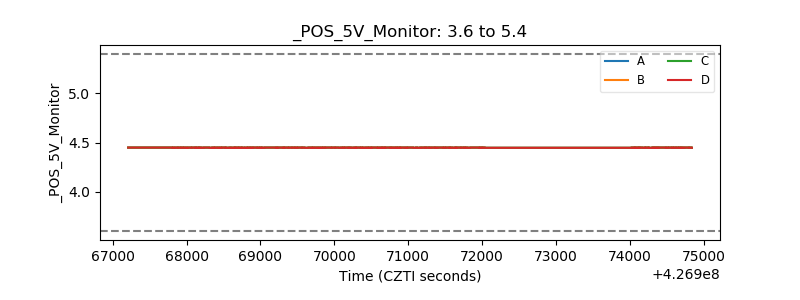 |
| _ROLL_ROT | 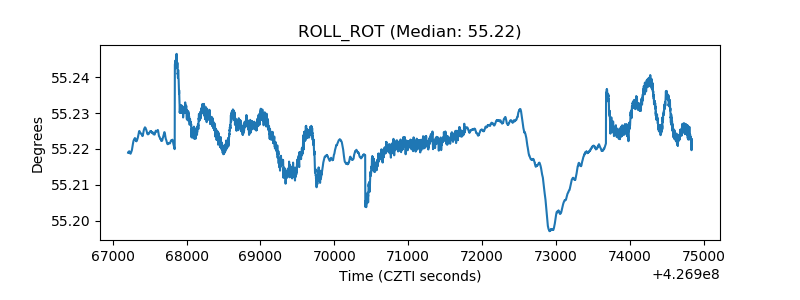 |
| _Roll_DEC | 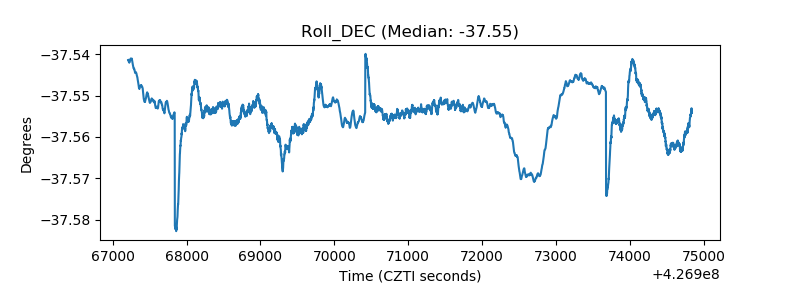 |
| _Roll_RA | 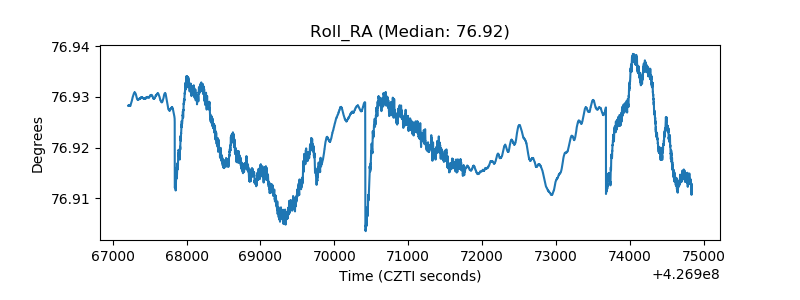 |
| Veto Counter | 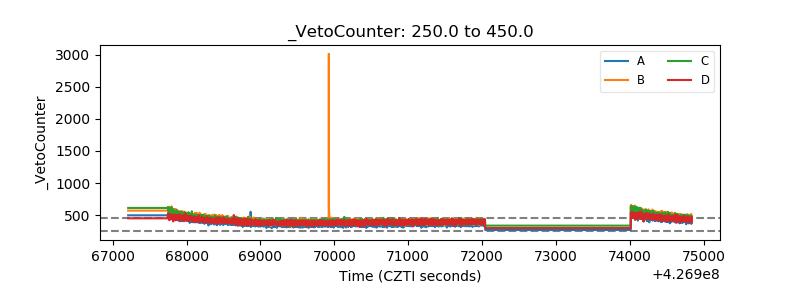 |