| Param | Original file | Final file |
|---|---|---|
| Filename | modeM0/AS1A12_061T07_9000005752_42126cztM0_level2.fits | modeM0/AS1A12_061T07_9000005752_42126cztM0_level2_quad_clean.evt |
| Size (bytes) | 294,091,200 | 90,835,200 |
| Size | 280.5 MB | 86.6 MB |
| Events in quadrant A | 2,770,258 | 619,222 |
| Events in quadrant B | 2,336,529 | 644,091 |
| Events in quadrant C | 2,445,457 | 598,203 |
| Events in quadrant D | 2,949,775 | 543,697 |
| Mode M0 | |||
|---|---|---|---|
| Quadrant | BADHDUFLAG | Total packets | Discarded packets |
| A | 0 | 11119 | 2 |
| B | 0 | 9979 | 3 |
| C | 0 | 9965 | 2 |
| D | 0 | 12073 | 2 |
| Mode SS | |||
|---|---|---|---|
| Quadrant | BADHDUFLAG | Total packets | Discarded packets |
| A | 0 | 100 | 0 |
| B | 0 | 100 | 0 |
| C | 0 | 100 | 0 |
| D | 0 | 100 | 0 |
| Mode M9 | |||
|---|---|---|---|
| Quadrant | BADHDUFLAG | Total packets | Discarded packets |
| A | 0 | 28 | 0 |
| B | 0 | 29 | 0 |
| C | 0 | 29 | 0 |
| D | 0 | 29 | 0 |
| Quadrant | Total seconds | Saturated seconds | Saturation percentage |
|---|---|---|---|
| A | 4929 | 15 | 0.304321% |
| B | 4928 | 7 | 0.142045% |
| C | 4928 | 3 | 0.060877% |
| D | 4928 | 84 | 1.704545% |
Noise dominated data is calculated using 1-second bins in cleaned event files. If a bin has >2000 counts, and if more than 50% of those come from <1% of pixels, then it is considered to be noise-dominated and hence unusable.
| Quadrant | # 1 sec bins | Bins with >0 counts | Bins with >2000 counts | High rate bins dominated by noise | Noise dominated (total time) | Noise dominated (detector-on time) | Marked lightcurve |
|---|---|---|---|---|---|---|---|
| A | 6991 | 4930 | 3 | 3 | 0.04% | 0.06% | 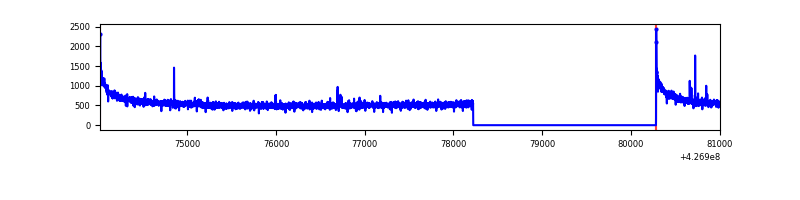 |
| B | 6990 | 4929 | 1 | 1 | 0.01% | 0.02% | 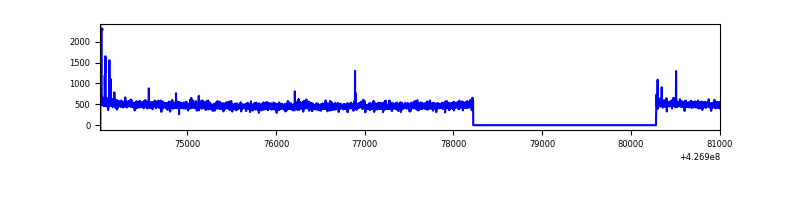 |
| C | 6990 | 4929 | 0 | 0 | 0.00% | 0.00% | 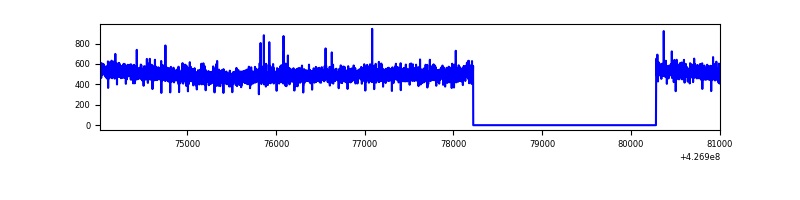 |
| D | 6990 | 4929 | 85 | 85 | 1.22% | 1.72% | 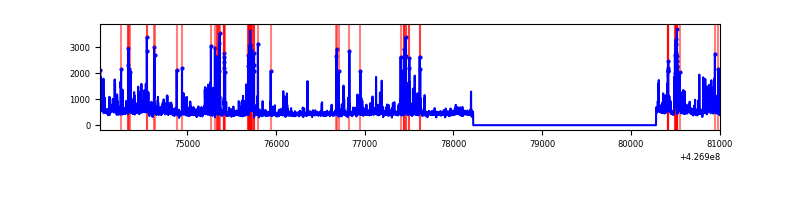 |
Top three noisy pixels from each quadrant. If the there are fewer than three noisy pixels in the level2.evt file, extra rows are filled as -1
| Pixel properties | Quadrant properties | ||||||
|---|---|---|---|---|---|---|---|
| Quadrant | DetID | PixID | Counts | Sigma | Mean | Median | Sigma |
| A | 10 | 83 | 484568 | 4079.11 | 585 | 573 | 118.7 |
| A | 13 | 6 | 18134 | 148.0 | 585 | 573 | 118.7 |
| A | 13 | 248 | 9017 | 71.17 | 585 | 573 | 118.7 |
| B | 5 | 255 | 18855 | 166.0 | 584 | 570 | 110.2 |
| B | 0 | 229 | 14201 | 123.75 | 584 | 570 | 110.2 |
| B | 12 | 111 | 13592 | 118.22 | 584 | 570 | 110.2 |
| C | 15 | 214 | 206805 | 1551.48 | 573 | 578 | 132.9 |
| C | 8 | 79 | 6321 | 43.21 | 573 | 578 | 132.9 |
| C | 13 | 61 | 3785 | 24.13 | 573 | 578 | 132.9 |
| D | 1 | 52 | 437716 | 3198.39 | 564 | 549 | 136.7 |
| D | 13 | 249 | 165938 | 1210.02 | 564 | 549 | 136.7 |
| D | 12 | 6 | 106570 | 775.67 | 564 | 549 | 136.7 |
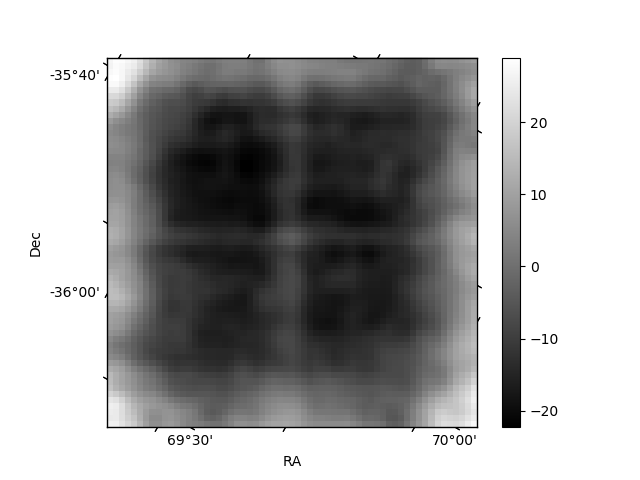
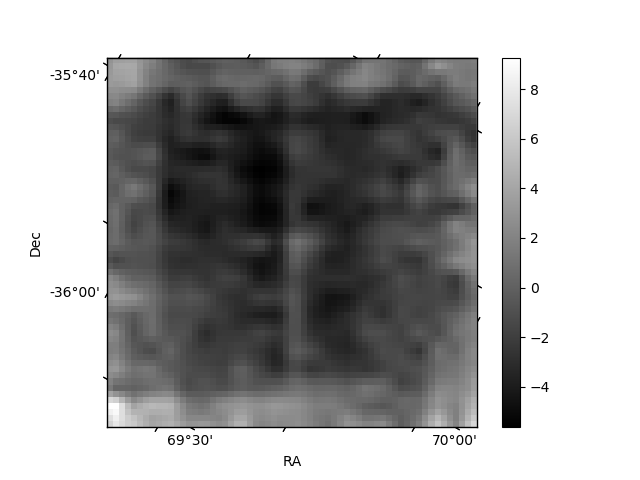
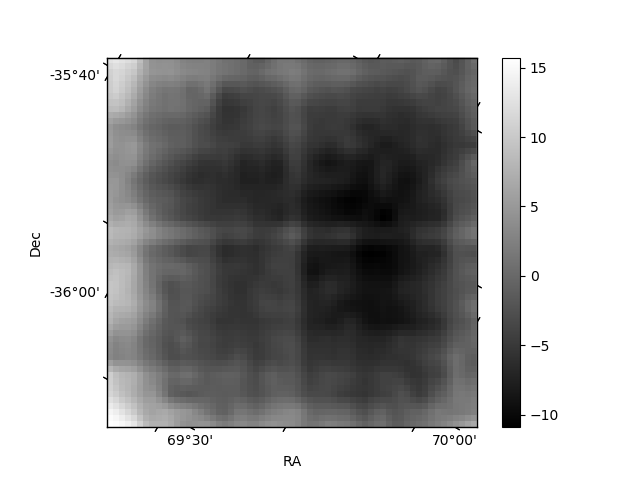
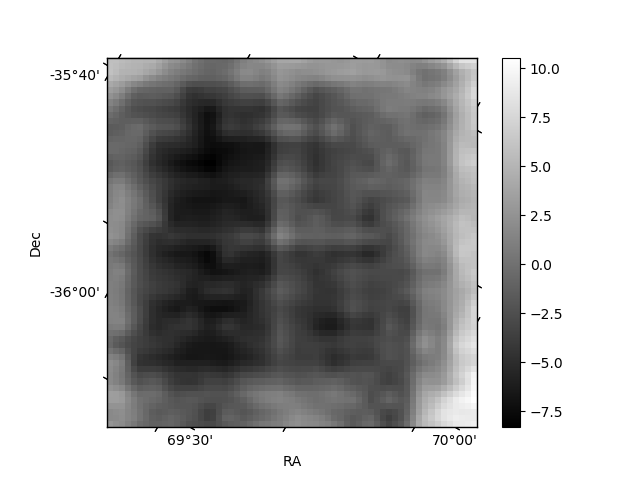
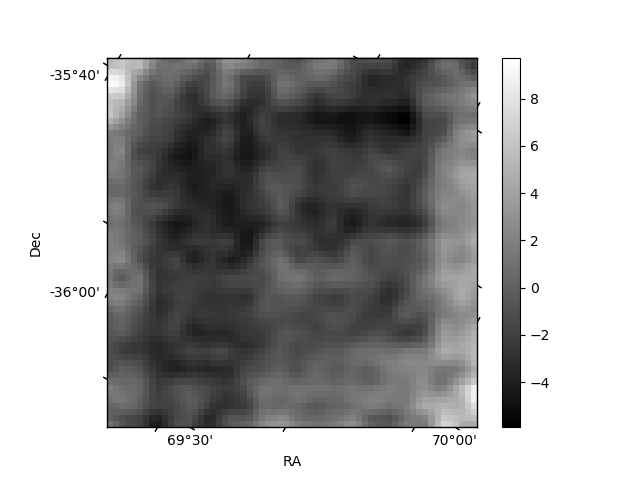
Histogram calculated using DETX and DETY for each event in the final _common_clean file
| Quadrant A | 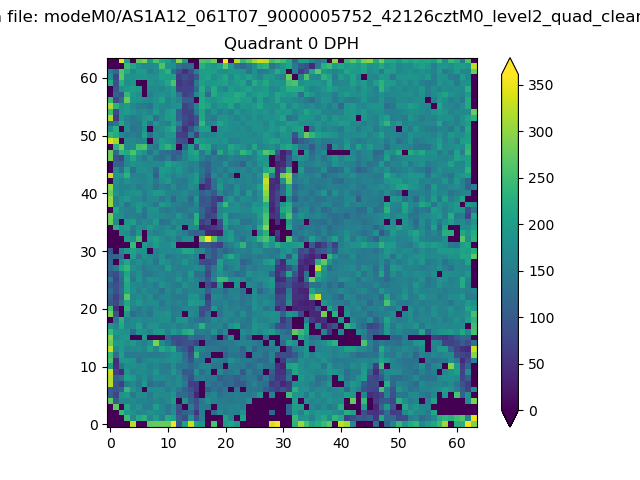 |
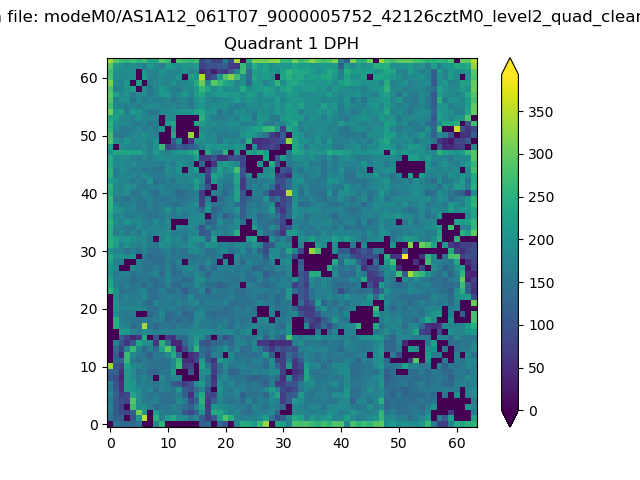 |
Quadrant B |
|---|---|---|---|
| Quadrant D | 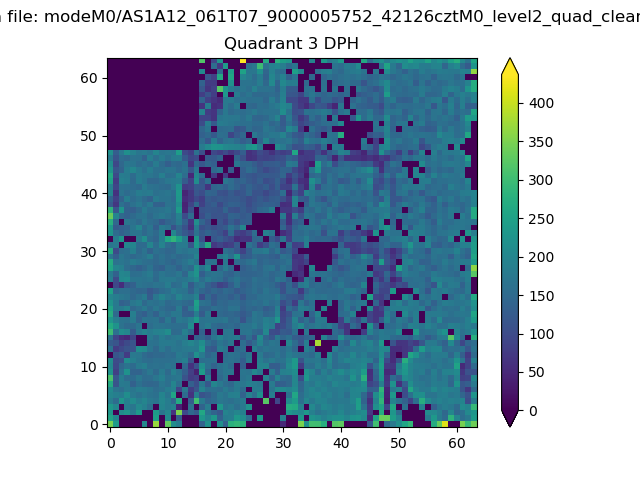 |
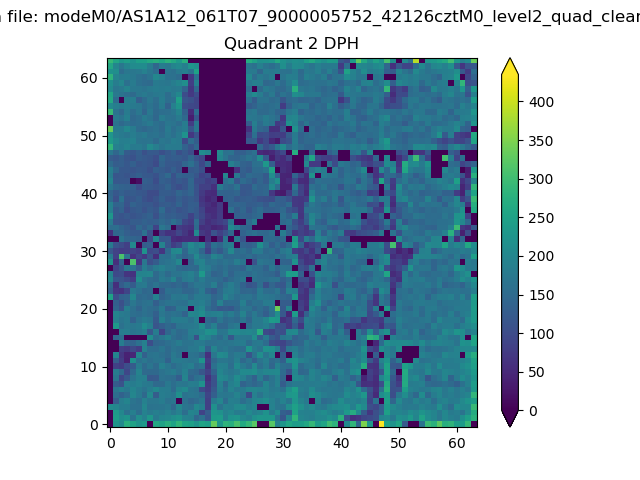 |
Quadrant C |
| Plot type | Count rate plots | Images |
|---|---|---|
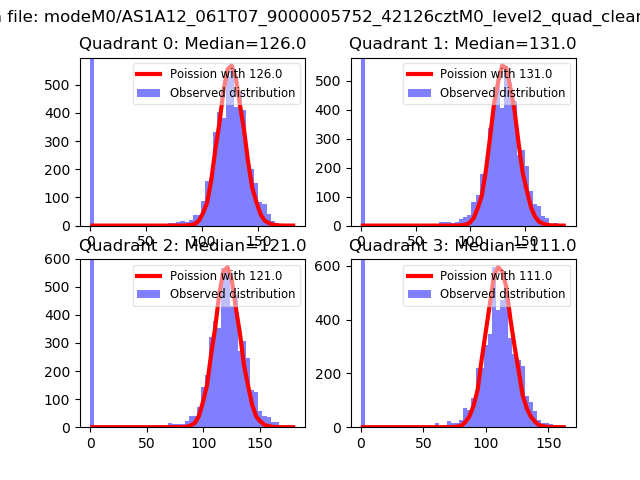
| Comparison with Poisson distribution Blue bars denote a histogram of data divided into 1 sec bins. Red curve is a Poisson curve with rate = median count rate of data. |
 |
 |
| Quadrant-wise count rates Data is divided into 100 sec bins |
 |
|
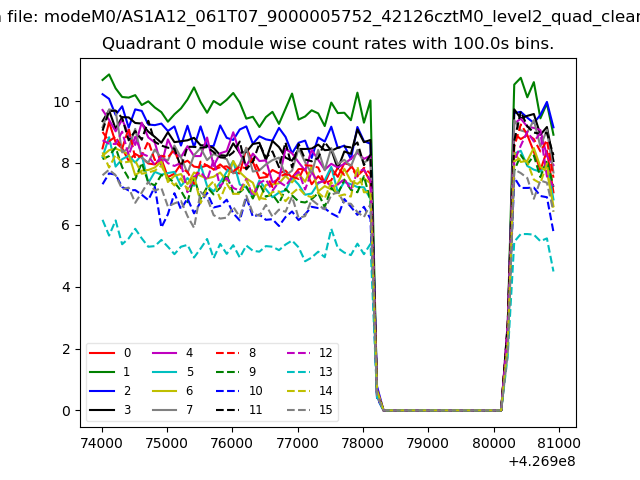
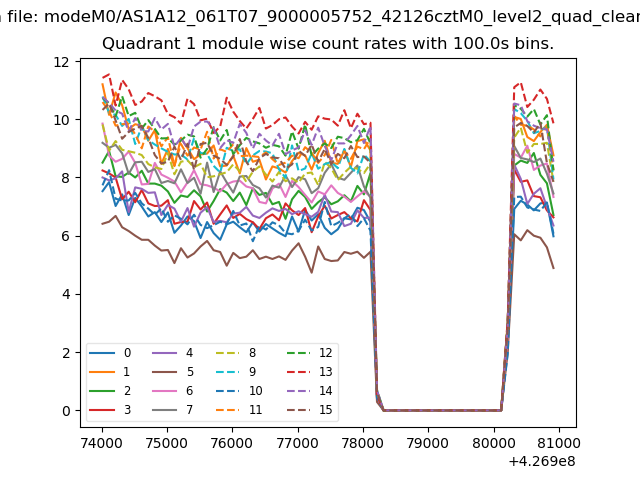
| Module-wise count rates for Quadrant A Data is divided into 100 sec bins |
 |
 |
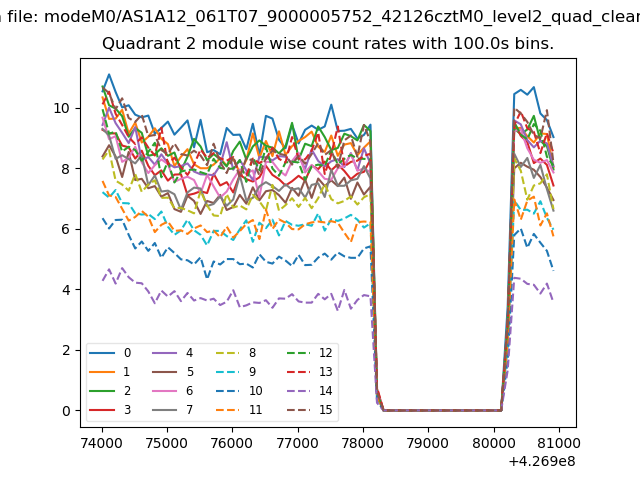
| Module-wise count rates for Quadrant B Data is divided into 100 sec bins |
 |
 |
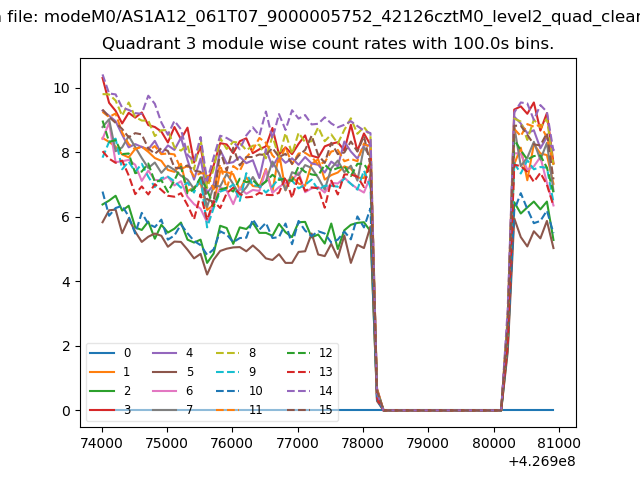
| Module-wise count rates for Quadrant C Data is divided into 100 sec bins |
 |
 |
| Module-wise count rates for Quadrant D Data is divided into 100 sec bins |
 |
 |
| Parameter | Plot |
|---|---|
| CZT HV Monitor | 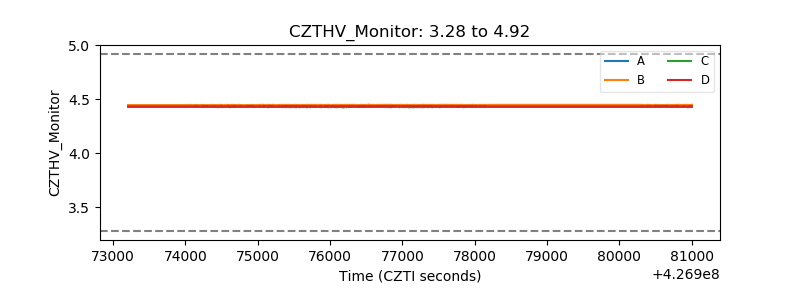 |
| D_VDD | 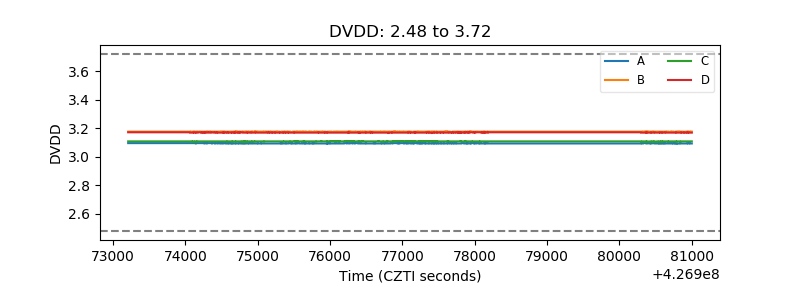 |
| Temperature 1 | 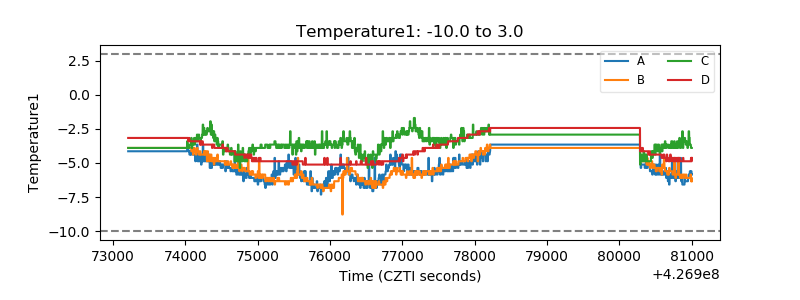 |
| Veto HV Monitor | 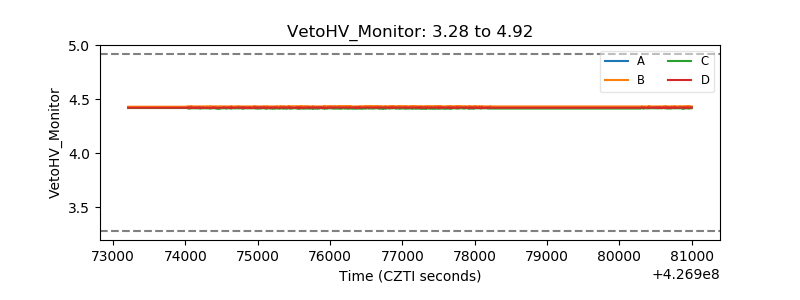 |
| Veto LLD | 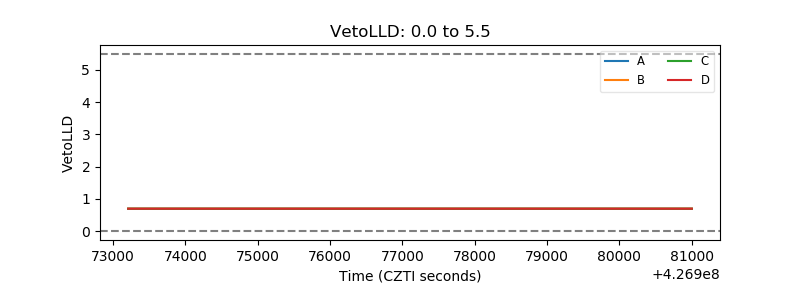 |
| Alpha Counter | 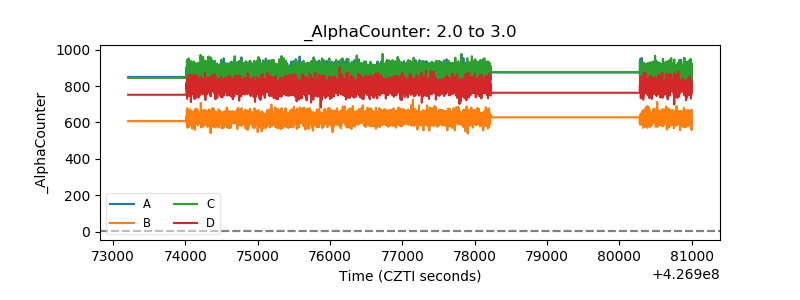 |
| _CPM_Rate | 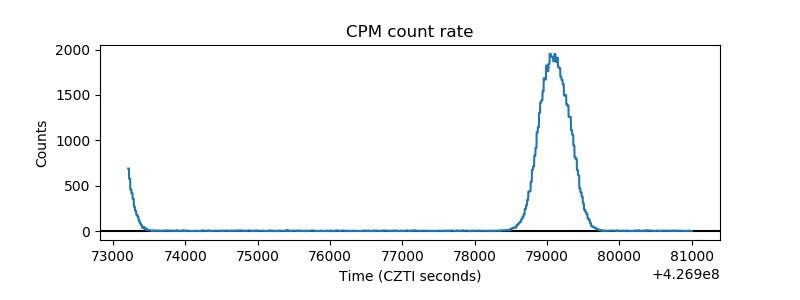 |
| CZT Counter | 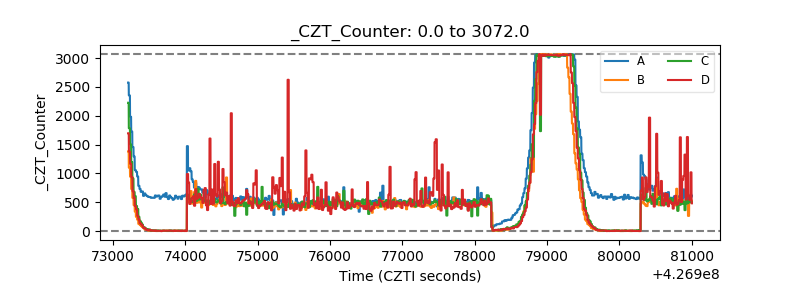 |
| +2.5 Volts monitor | 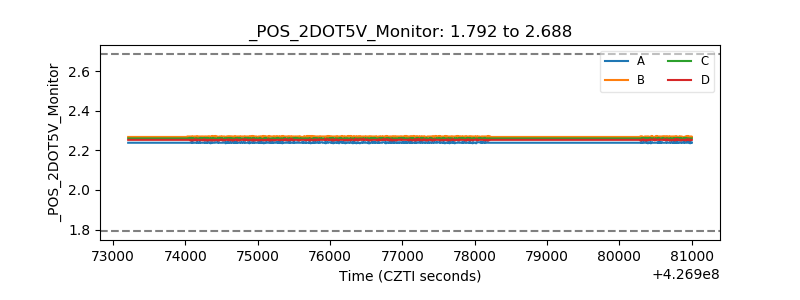 |
| +5 Volts monitor | 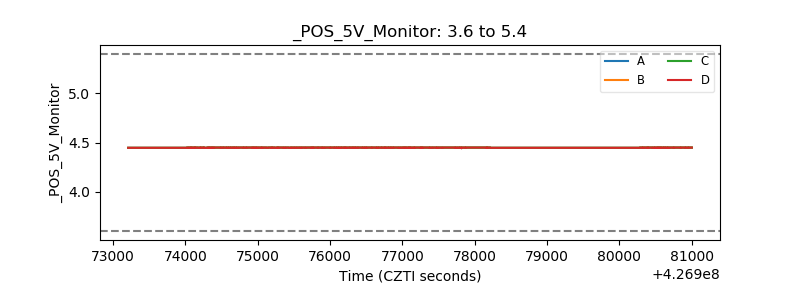 |
| _ROLL_ROT | 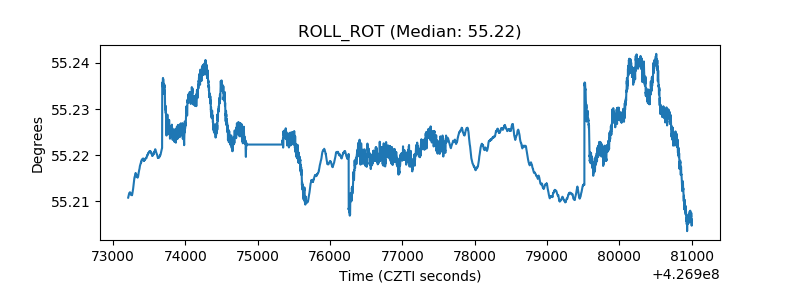 |
| _Roll_DEC | 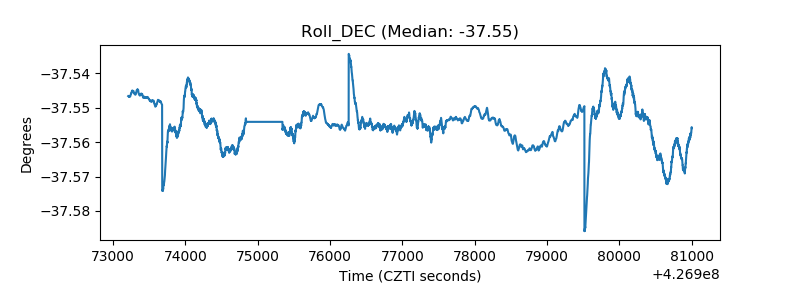 |
| _Roll_RA | 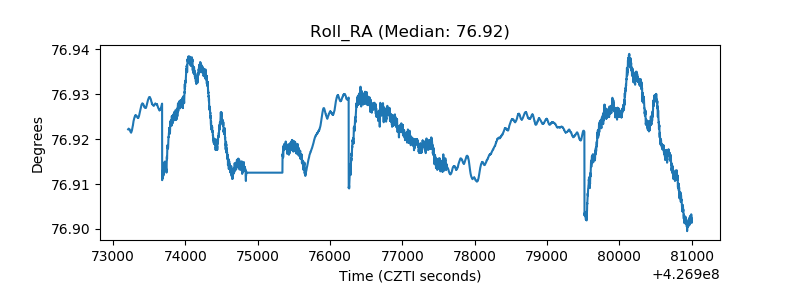 |
| Veto Counter | 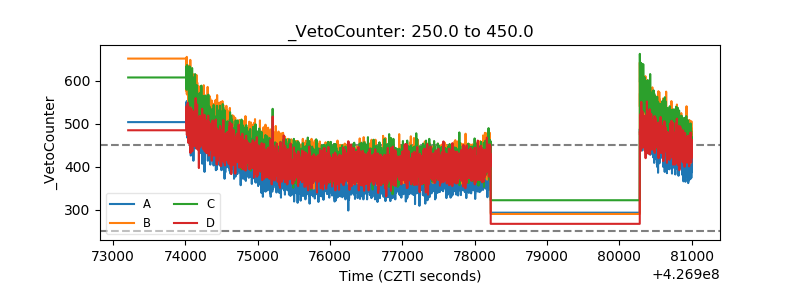 |