| Param | Original file | Final file |
|---|---|---|
| Filename | modeM0/AS1A12_061T07_9000005752_42128cztM0_level2.fits | modeM0/AS1A12_061T07_9000005752_42128cztM0_level2_quad_clean.evt |
| Size (bytes) | 251,965,440 | 73,131,840 |
| Size | 240.3 MB | 69.7 MB |
| Events in quadrant A | 2,174,091 | 497,180 |
| Events in quadrant B | 1,904,018 | 513,886 |
| Events in quadrant C | 1,982,108 | 483,222 |
| Events in quadrant D | 2,942,563 | 428,413 |
| Mode M0 | |||
|---|---|---|---|
| Quadrant | BADHDUFLAG | Total packets | Discarded packets |
| A | 0 | 8825 | 1 |
| B | 0 | 8453 | 1 |
| C | 0 | 8345 | 1 |
| D | 0 | 11533 | 1 |
| Mode SS | |||
|---|---|---|---|
| Quadrant | BADHDUFLAG | Total packets | Discarded packets |
| A | 0 | 84 | 0 |
| B | 0 | 84 | 0 |
| C | 0 | 84 | 0 |
| D | 0 | 84 | 0 |
| Mode M9 | |||
|---|---|---|---|
| Quadrant | BADHDUFLAG | Total packets | Discarded packets |
| A | 0 | 12 | 0 |
| B | 0 | 13 | 0 |
| C | 0 | 13 | 0 |
| D | 0 | 13 | 0 |
| Quadrant | Total seconds | Saturated seconds | Saturation percentage |
|---|---|---|---|
| A | 4146 | 7 | 0.168837% |
| B | 4146 | 9 | 0.217077% |
| C | 4146 | 1 | 0.024120% |
| D | 4146 | 201 | 4.848046% |
Noise dominated data is calculated using 1-second bins in cleaned event files. If a bin has >2000 counts, and if more than 50% of those come from <1% of pixels, then it is considered to be noise-dominated and hence unusable.
| Quadrant | # 1 sec bins | Bins with >0 counts | Bins with >2000 counts | High rate bins dominated by noise | Noise dominated (total time) | Noise dominated (detector-on time) | Marked lightcurve |
|---|---|---|---|---|---|---|---|
| A | 4146 | 4146 | 1 | 1 | 0.02% | 0.02% | 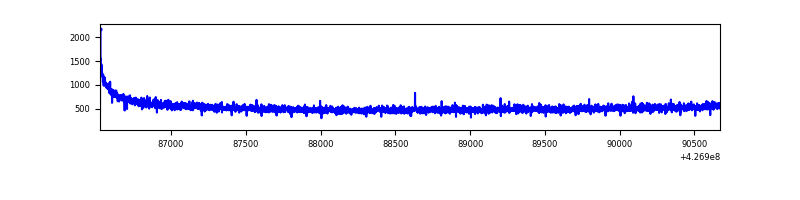 |
| B | 4146 | 4146 | 7 | 7 | 0.17% | 0.17% | 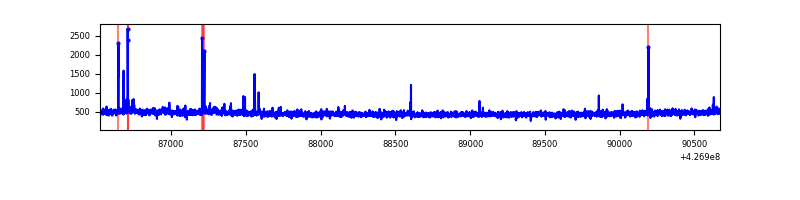 |
| C | 4146 | 4146 | 0 | 0 | 0.00% | 0.00% | 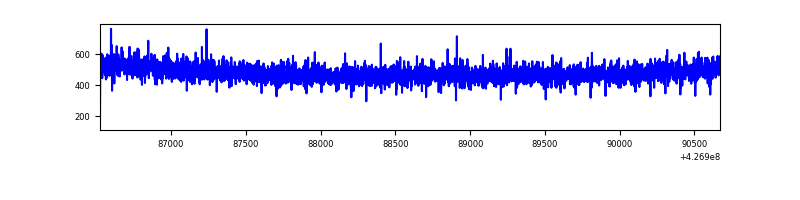 |
| D | 4146 | 4146 | 181 | 181 | 4.37% | 4.37% | 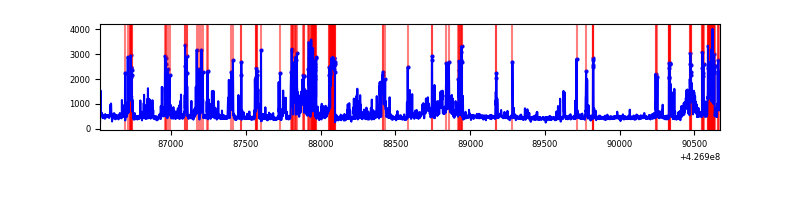 |
Top three noisy pixels from each quadrant. If the there are fewer than three noisy pixels in the level2.evt file, extra rows are filled as -1
| Pixel properties | Quadrant properties | ||||||
|---|---|---|---|---|---|---|---|
| Quadrant | DetID | PixID | Counts | Sigma | Mean | Median | Sigma |
| A | 10 | 83 | 348205 | 3595.55 | 471 | 463 | 96.7 |
| A | 3 | 137 | 5188 | 48.86 | 471 | 463 | 96.7 |
| A | 13 | 254 | 4630 | 43.09 | 471 | 463 | 96.7 |
| B | 5 | 255 | 29355 | 320.93 | 468 | 456 | 90.0 |
| B | 0 | 229 | 18016 | 195.01 | 468 | 456 | 90.0 |
| B | 0 | 183 | 17784 | 192.43 | 468 | 456 | 90.0 |
| C | 15 | 214 | 167738 | 1531.1 | 465 | 467 | 109.2 |
| C | 13 | 61 | 3107 | 24.16 | 465 | 467 | 109.2 |
| C | 12 | 249 | 1997 | 14.0 | 465 | 467 | 109.2 |
| D | 13 | 249 | 634545 | 5765.02 | 453 | 441 | 110.0 |
| D | 1 | 52 | 445106 | 4042.72 | 453 | 441 | 110.0 |
| D | 12 | 6 | 120986 | 1095.95 | 453 | 441 | 110.0 |
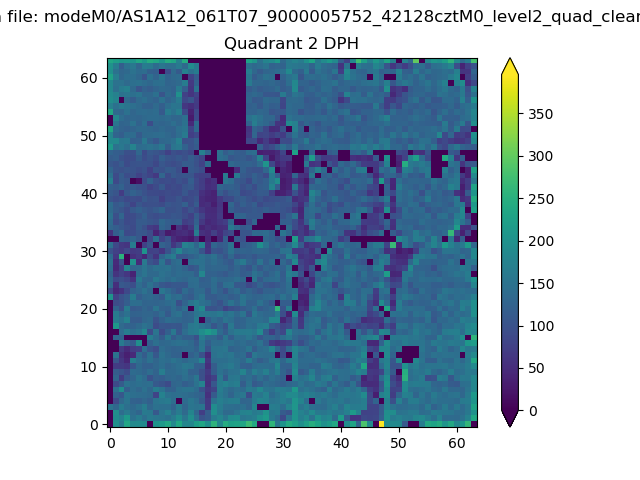
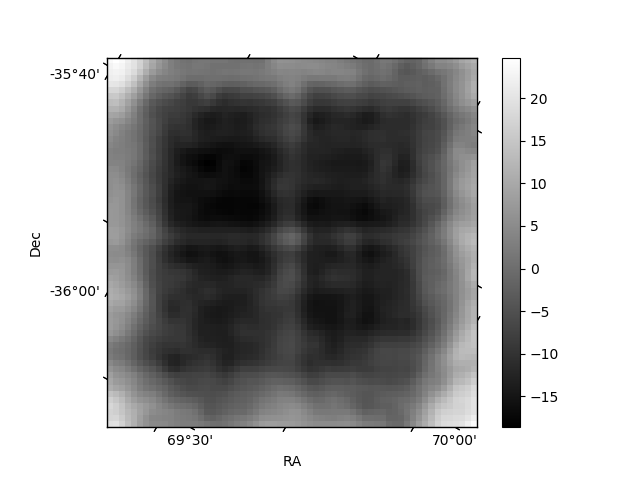
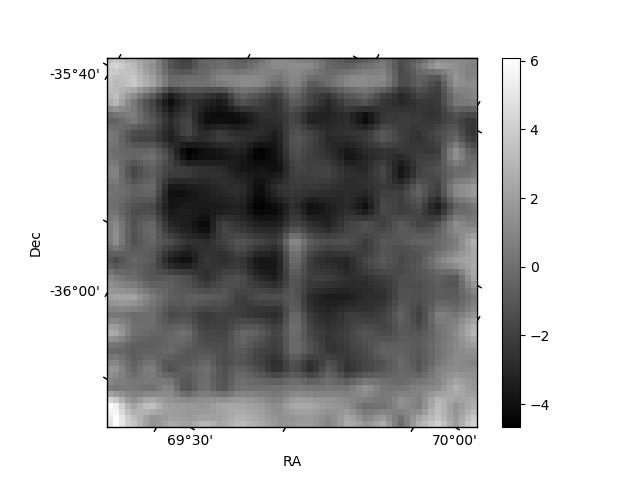
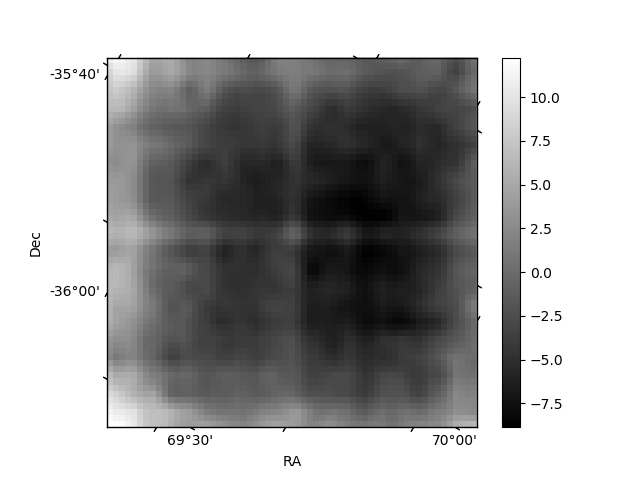
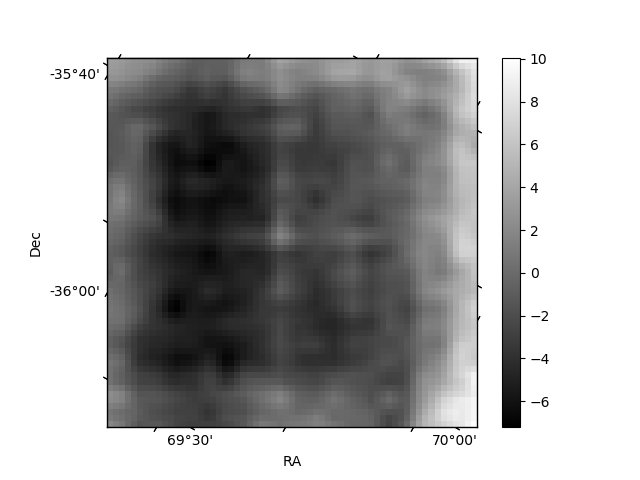
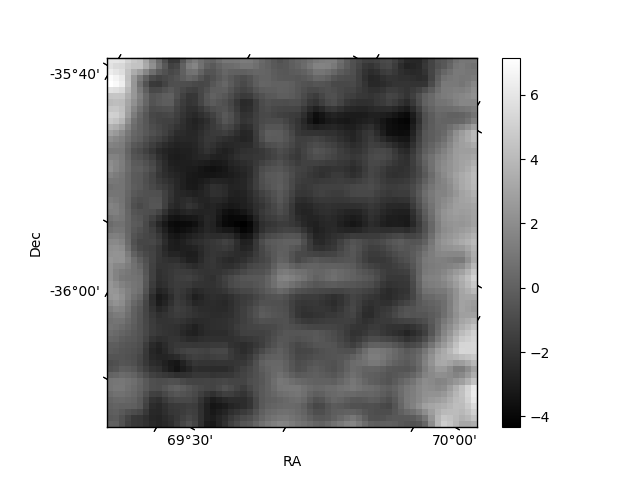
Histogram calculated using DETX and DETY for each event in the final _common_clean file
| Quadrant A | 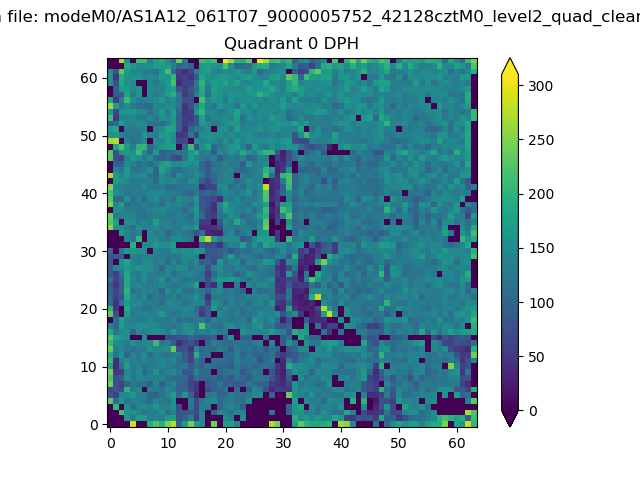 |
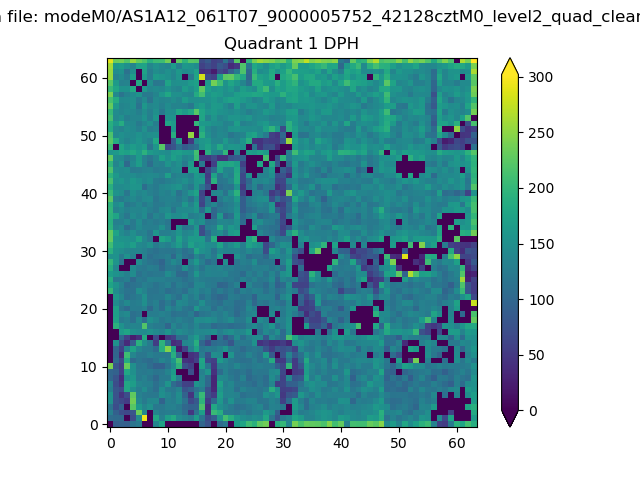 |
Quadrant B |
|---|---|---|---|
| Quadrant D | 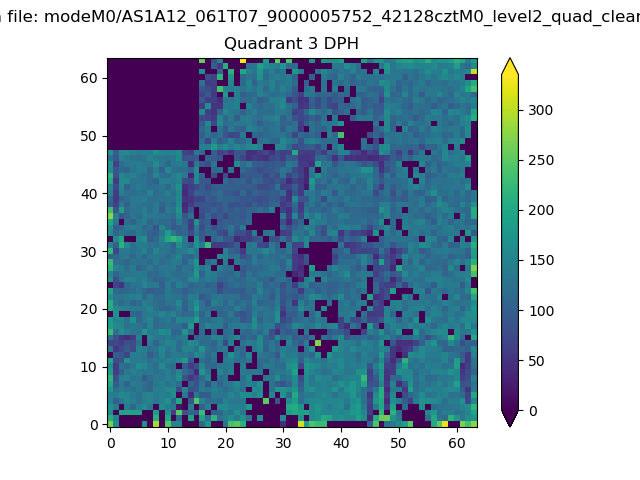 |
 |
Quadrant C |
| Plot type | Count rate plots | Images |
|---|---|---|
| Comparison with Poisson distribution Blue bars denote a histogram of data divided into 1 sec bins. Red curve is a Poisson curve with rate = median count rate of data. |
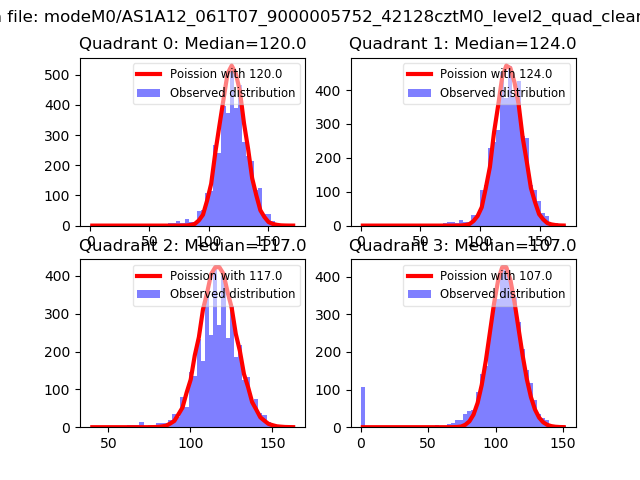 |
 |
| Quadrant-wise count rates Data is divided into 100 sec bins |
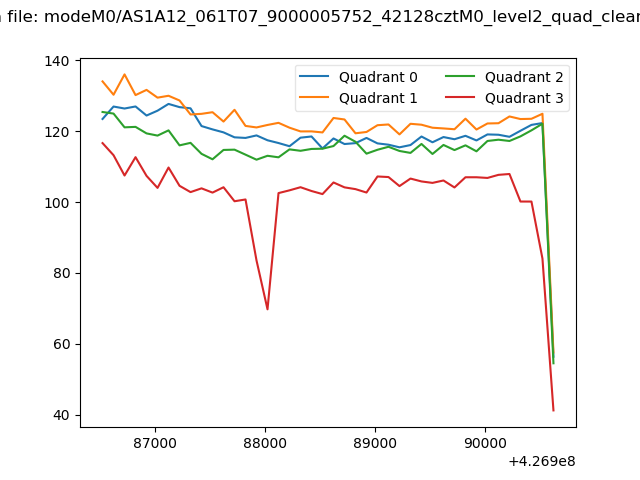 |
|
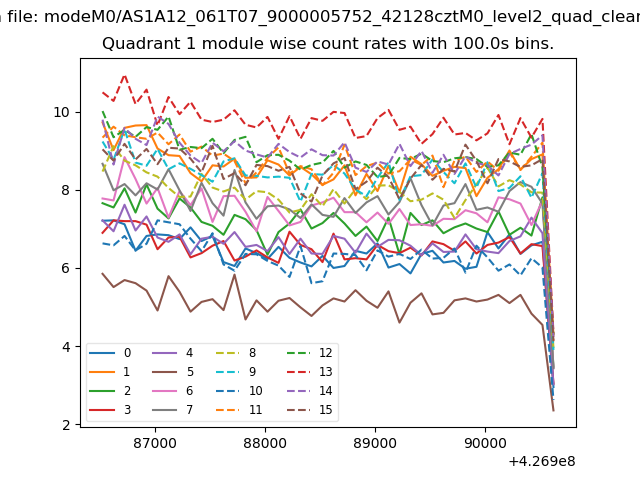
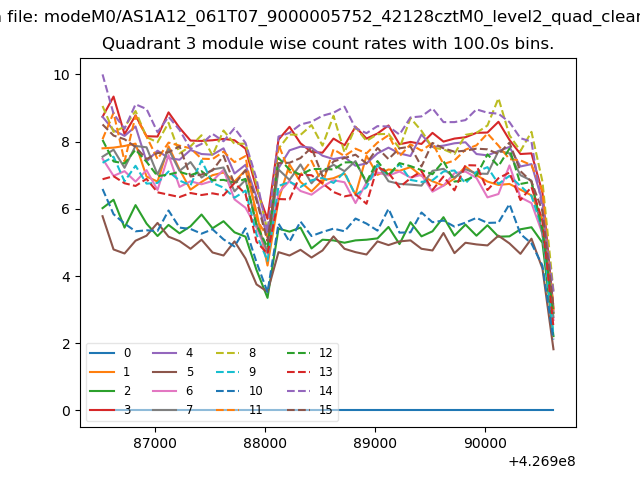
| Module-wise count rates for Quadrant A Data is divided into 100 sec bins |
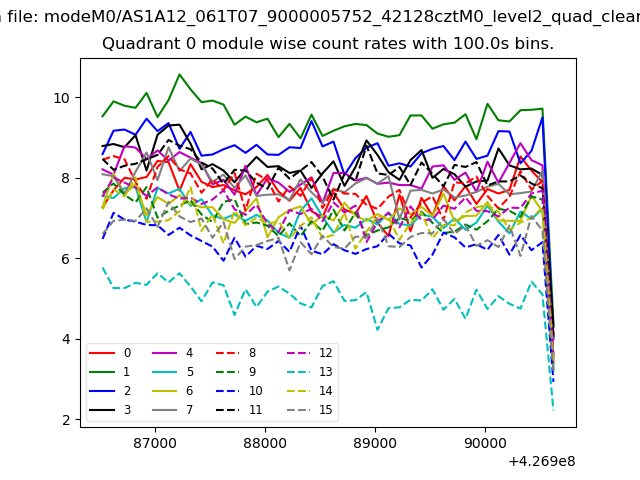 |
 |
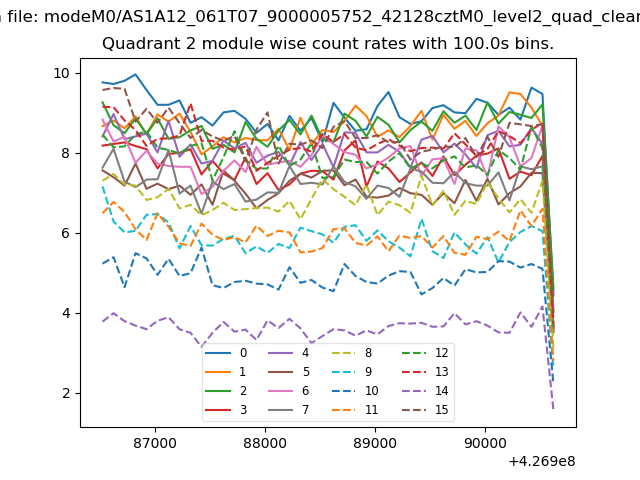
| Module-wise count rates for Quadrant B Data is divided into 100 sec bins |
 |
 |
| Module-wise count rates for Quadrant C Data is divided into 100 sec bins |
 |
 |
| Module-wise count rates for Quadrant D Data is divided into 100 sec bins |
 |
 |
| Parameter | Plot |
|---|---|
| CZT HV Monitor | 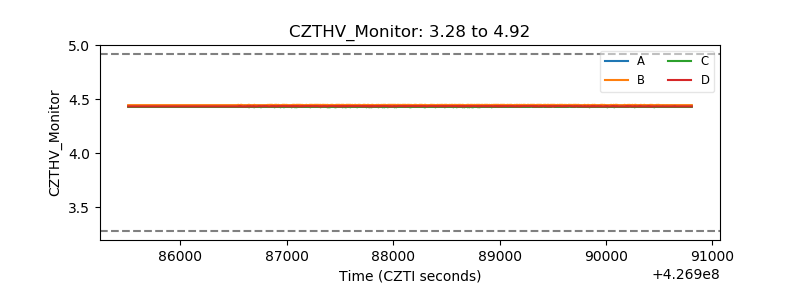 |
| D_VDD | 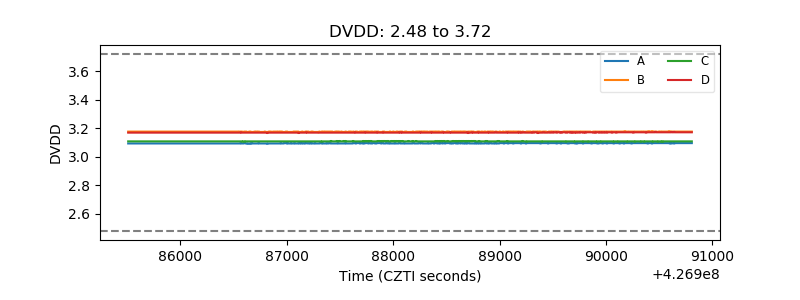 |
| Temperature 1 | 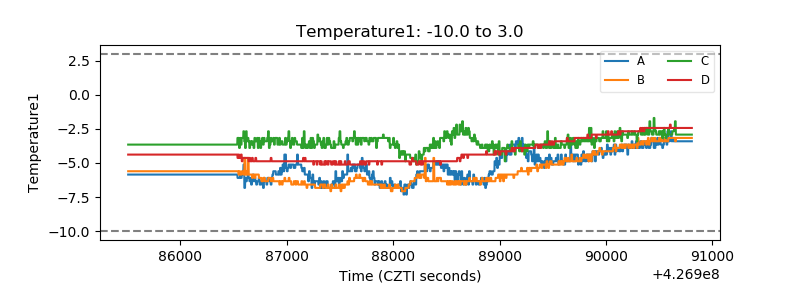 |
| Veto HV Monitor | 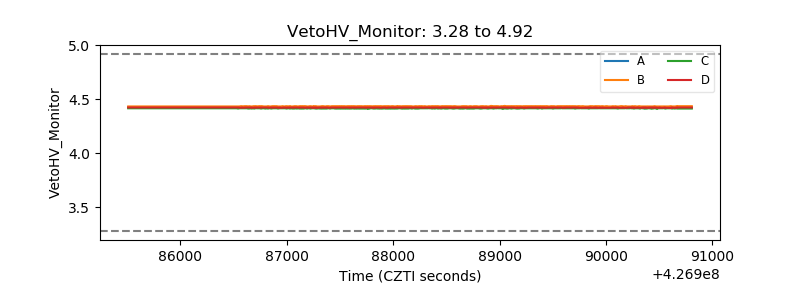 |
| Veto LLD |  |
| Alpha Counter | 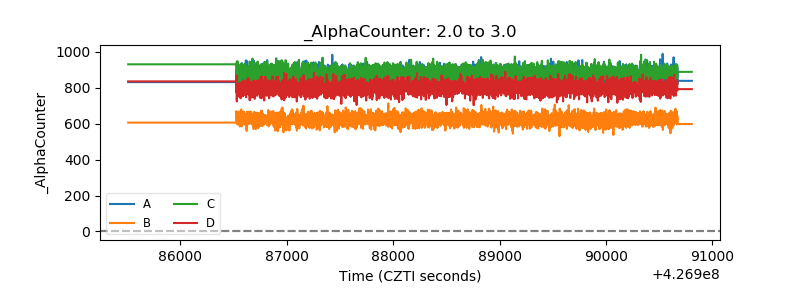 |
| _CPM_Rate | 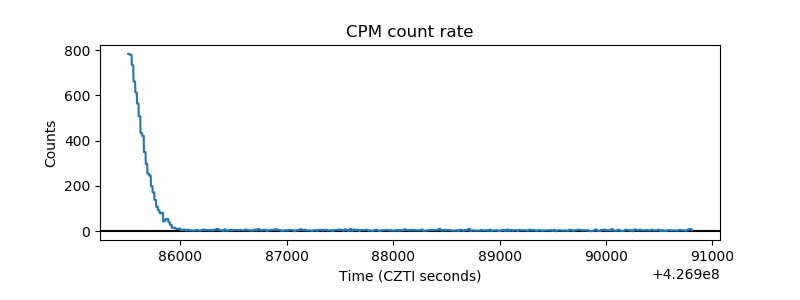 |
| CZT Counter | 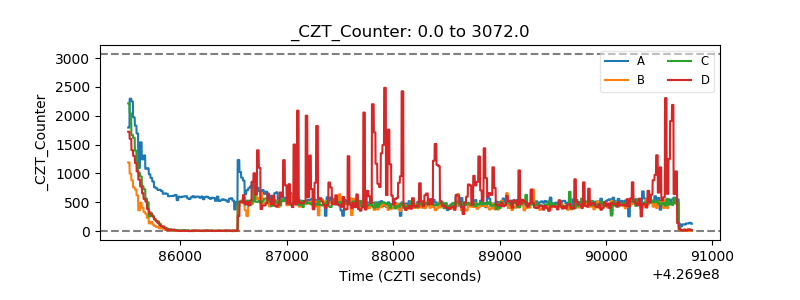 |
| +2.5 Volts monitor | 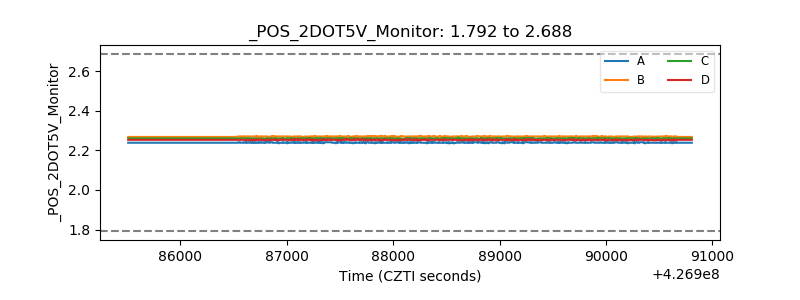 |
| +5 Volts monitor | 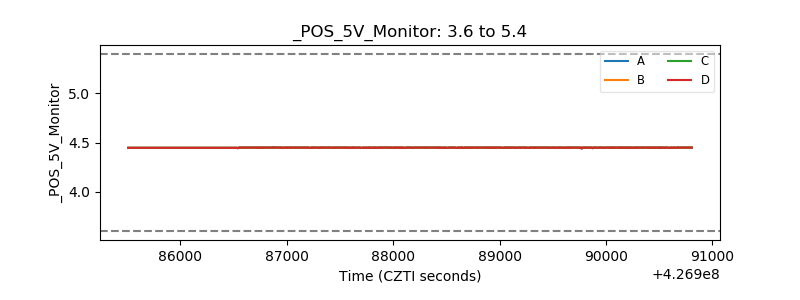 |
| _ROLL_ROT | 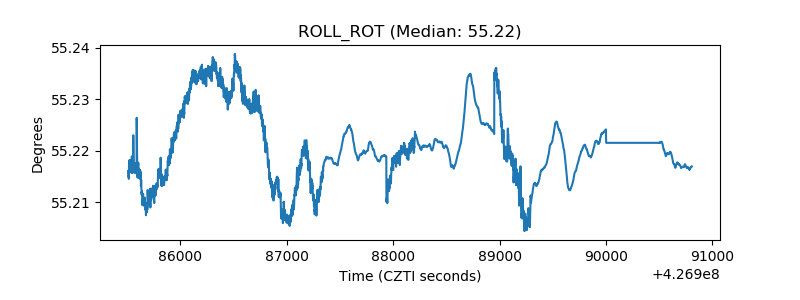 |
| _Roll_DEC | 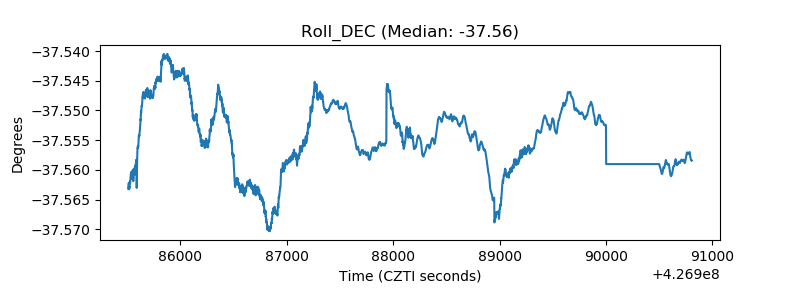 |
| _Roll_RA | 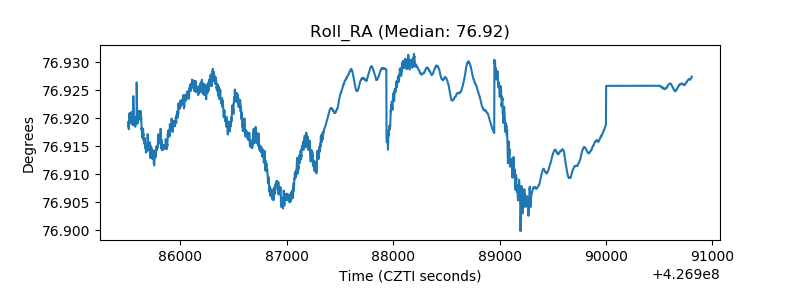 |
| Veto Counter | 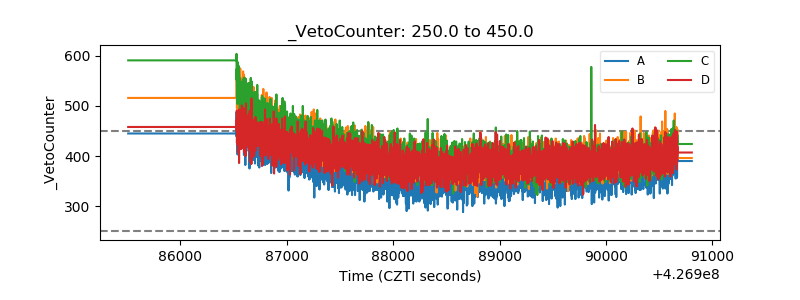 |