| Param | Original file | Final file |
|---|---|---|
| Filename | modeM0/AS1A12_088T19_9000005754_42128cztM0_level2.fits | modeM0/AS1A12_088T19_9000005754_42128cztM0_level2_quad_clean.evt |
| Size (bytes) | 46,226,880 | 13,147,200 |
| Size | 44.1 MB | 12.5 MB |
| Events in quadrant A | 459,098 | 87,585 |
| Events in quadrant B | 324,601 | 89,808 |
| Events in quadrant C | 348,058 | 86,007 |
| Events in quadrant D | 517,314 | 74,823 |
| Mode SS | |||
|---|---|---|---|
| Quadrant | BADHDUFLAG | Total packets | Discarded packets |
| A | 0 | 16 | 0 |
| B | 0 | 16 | 0 |
| C | 0 | 16 | 0 |
| D | 0 | 16 | 0 |
| Mode M9 | |||
|---|---|---|---|
| Quadrant | BADHDUFLAG | Total packets | Discarded packets |
| A | 0 | 6 | 0 |
| B | 0 | 6 | 0 |
| C | 0 | 6 | 0 |
| D | 0 | 6 | 0 |
| Mode M0 | |||
|---|---|---|---|
| Quadrant | BADHDUFLAG | Total packets | Discarded packets |
| A | 0 | 1836 | 1 |
| B | 0 | 1506 | 1 |
| C | 0 | 1507 | 1 |
| D | 0 | 2075 | 1 |
| Quadrant | Total seconds | Saturated seconds | Saturation percentage |
|---|---|---|---|
| A | 752 | 2 | 0.265957% |
| B | 752 | 1 | 0.132979% |
| C | 752 | 1 | 0.132979% |
| D | 752 | 52 | 6.914894% |
Noise dominated data is calculated using 1-second bins in cleaned event files. If a bin has >2000 counts, and if more than 50% of those come from <1% of pixels, then it is considered to be noise-dominated and hence unusable.
| Quadrant | # 1 sec bins | Bins with >0 counts | Bins with >2000 counts | High rate bins dominated by noise | Noise dominated (total time) | Noise dominated (detector-on time) | Marked lightcurve |
|---|---|---|---|---|---|---|---|
| A | 752 | 752 | 1 | 1 | 0.13% | 0.13% | 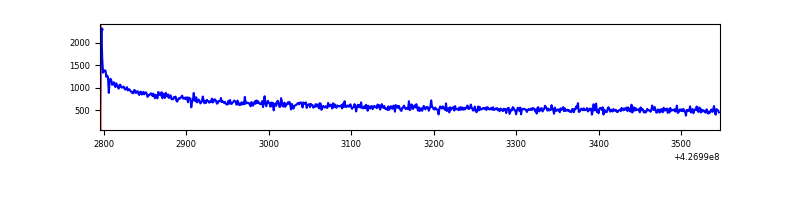 |
| B | 752 | 752 | 0 | 0 | 0.00% | 0.00% | 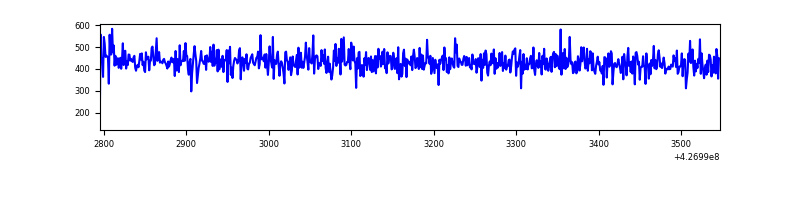 |
| C | 752 | 752 | 0 | 0 | 0.00% | 0.00% | 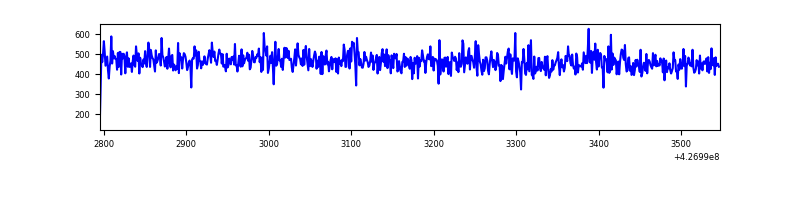 |
| D | 751 | 751 | 44 | 44 | 5.86% | 5.86% | 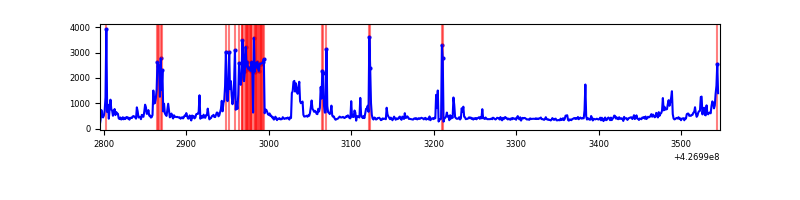 |
Top three noisy pixels from each quadrant. If the there are fewer than three noisy pixels in the level2.evt file, extra rows are filled as -1
| Pixel properties | Quadrant properties | ||||||
|---|---|---|---|---|---|---|---|
| Quadrant | DetID | PixID | Counts | Sigma | Mean | Median | Sigma |
| A | 10 | 83 | 141397 | 7413.09 | 82 | 80 | 19.1 |
| A | 10 | 67 | 1390 | 68.72 | 82 | 80 | 19.1 |
| A | 3 | 137 | 840 | 39.87 | 82 | 80 | 19.1 |
| B | 12 | 111 | 2069 | 109.25 | 82 | 80 | 18.2 |
| B | 11 | 111 | 1864 | 97.99 | 82 | 80 | 18.2 |
| B | 14 | 111 | 1777 | 93.21 | 82 | 80 | 18.2 |
| C | 15 | 214 | 36461 | 1772.29 | 79 | 80 | 20.5 |
| C | 13 | 61 | 571 | 23.92 | 79 | 80 | 20.5 |
| C | 15 | 159 | 374 | 14.32 | 79 | 80 | 20.5 |
| D | 13 | 249 | 158814 | 7864.84 | 75 | 73 | 20.2 |
| D | 12 | 6 | 31055 | 1535.01 | 75 | 73 | 20.2 |
| D | 2 | 249 | 17649 | 870.8 | 75 | 73 | 20.2 |
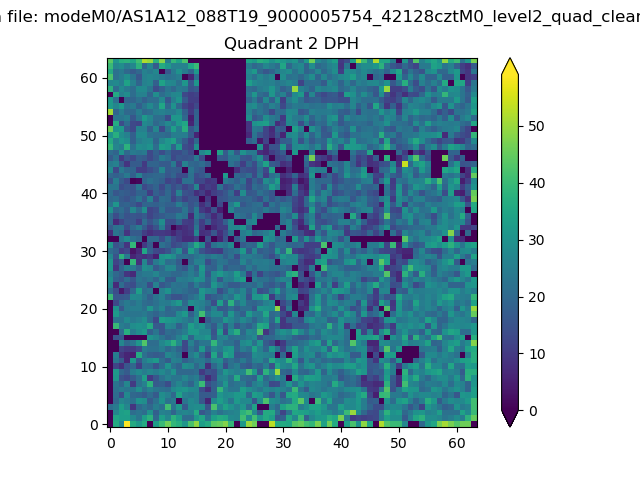
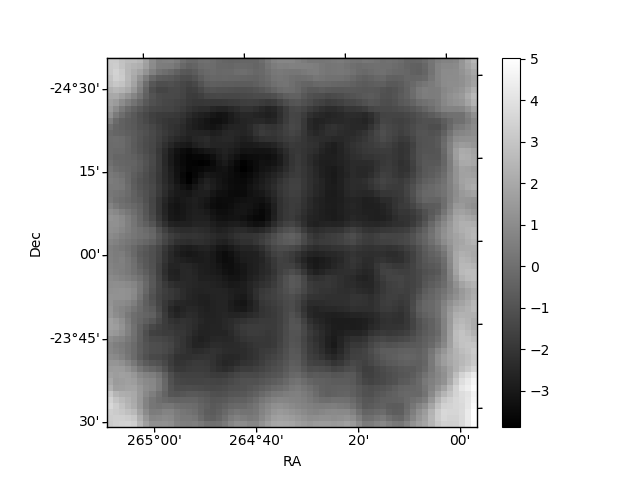
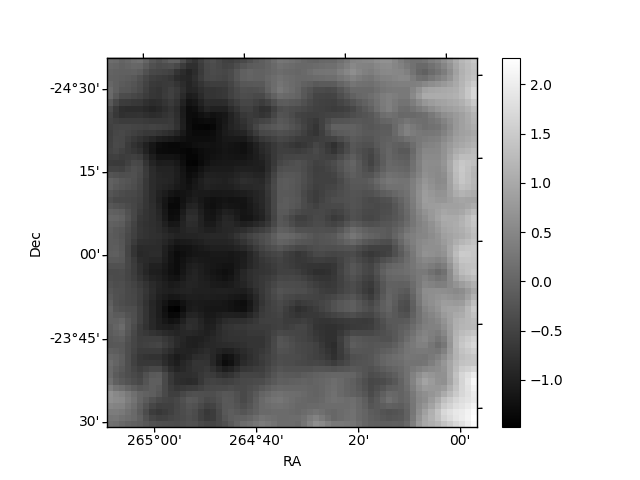
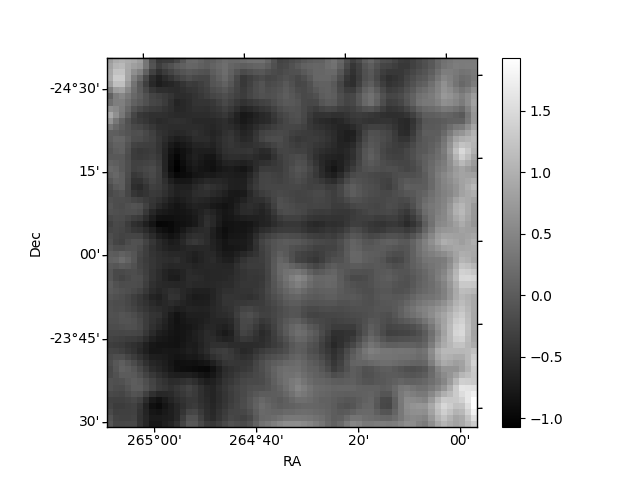
Histogram calculated using DETX and DETY for each event in the final _common_clean file
| Quadrant A | 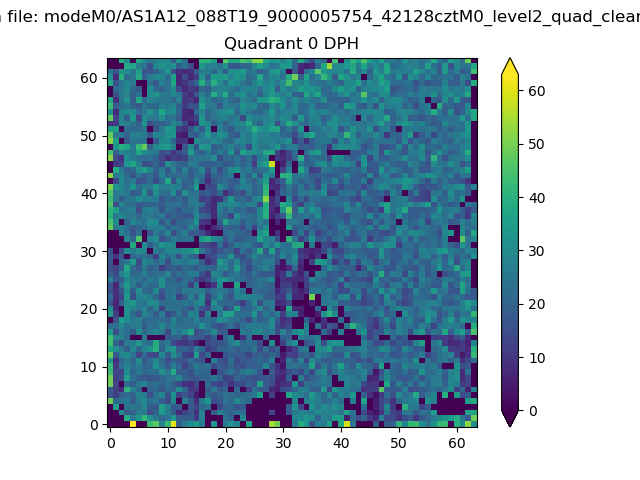 |
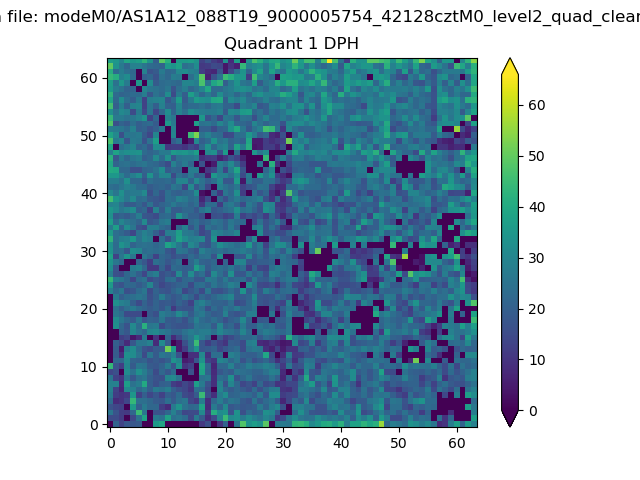 |
Quadrant B |
|---|---|---|---|
| Quadrant D | 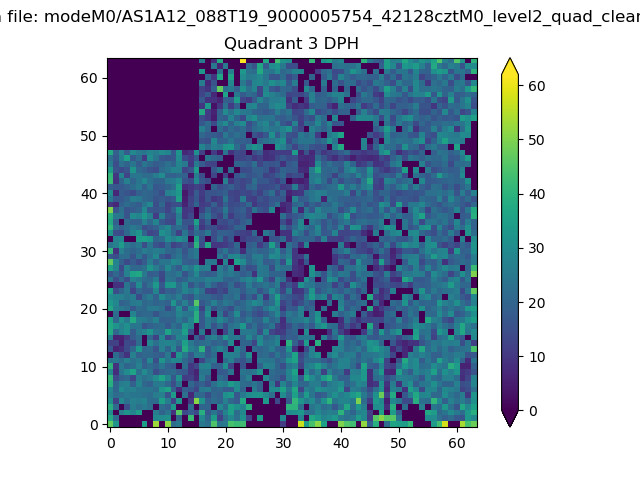 |
 |
Quadrant C |
| Plot type | Count rate plots | Images |
|---|---|---|
| Comparison with Poisson distribution Blue bars denote a histogram of data divided into 1 sec bins. Red curve is a Poisson curve with rate = median count rate of data. |
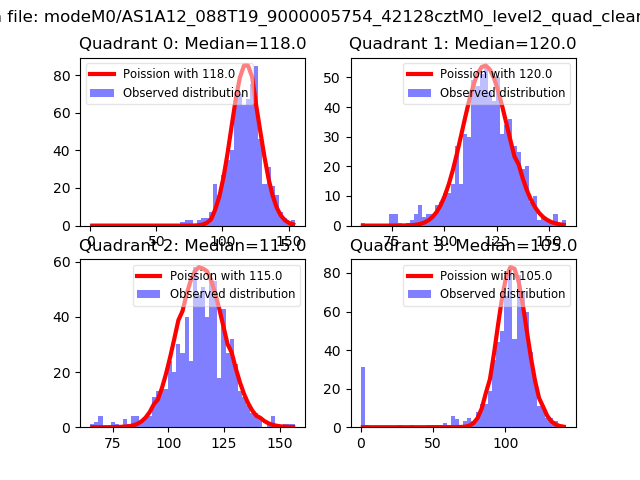 |
 |
| Quadrant-wise count rates Data is divided into 100 sec bins |
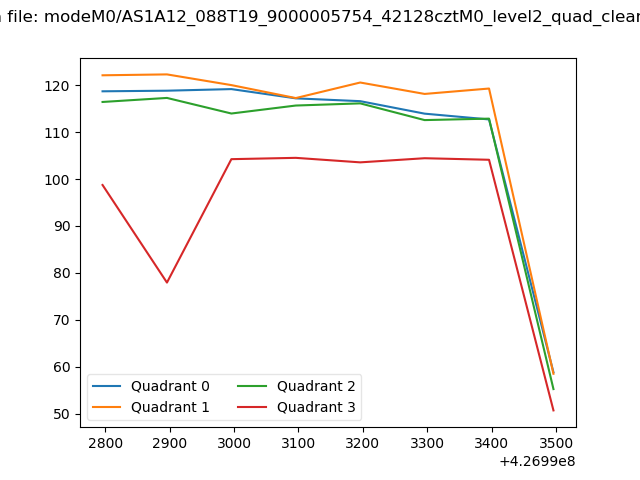 |
|
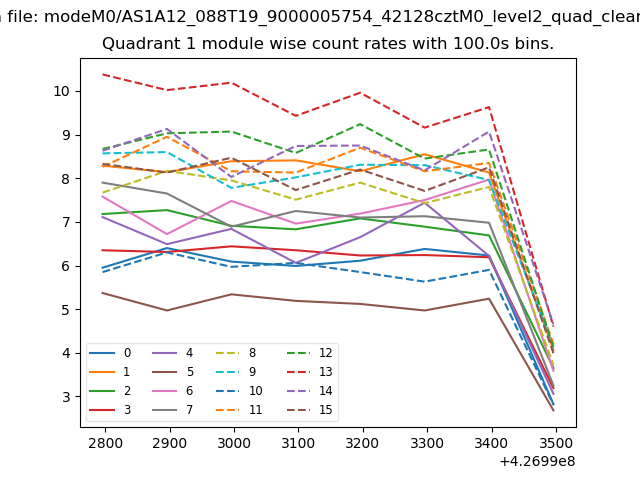
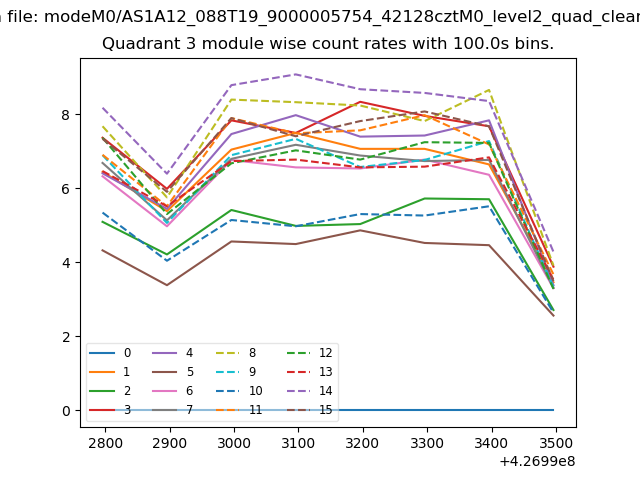
| Module-wise count rates for Quadrant A Data is divided into 100 sec bins |
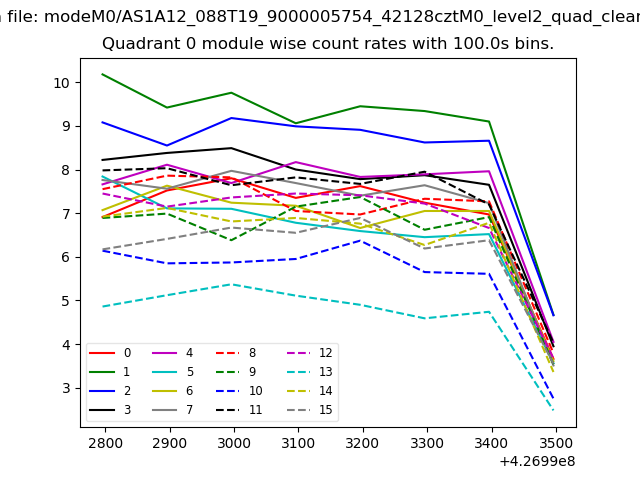 |
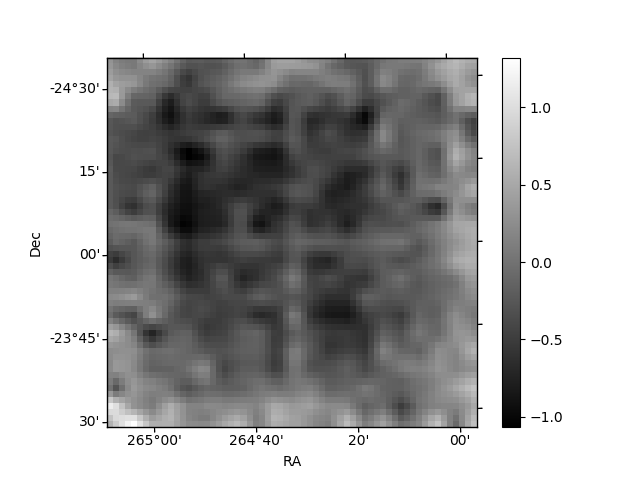 |
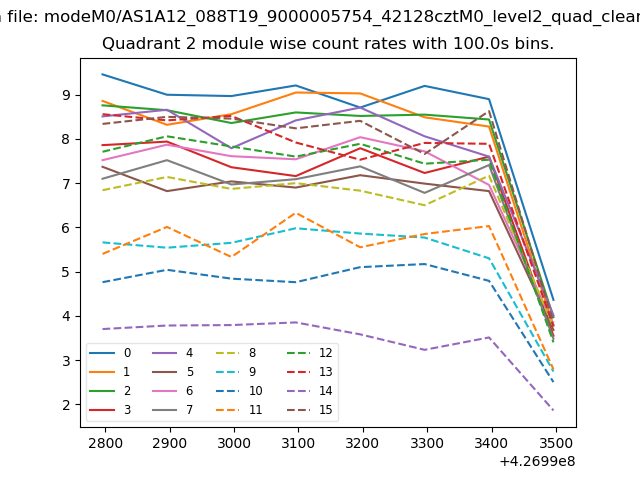
| Module-wise count rates for Quadrant B Data is divided into 100 sec bins |
 |
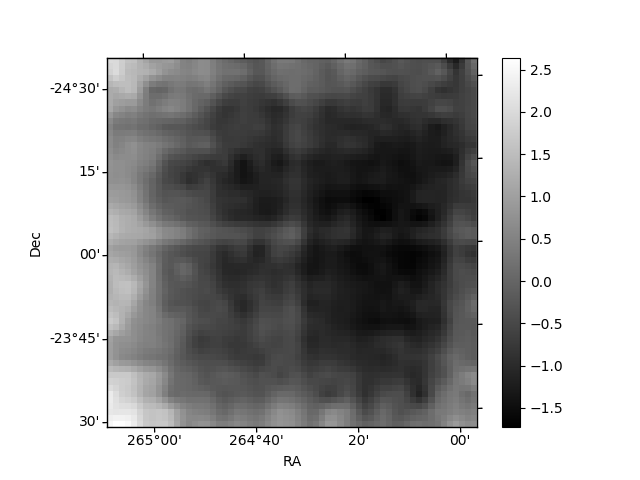 |
| Module-wise count rates for Quadrant C Data is divided into 100 sec bins |
 |
 |
| Module-wise count rates for Quadrant D Data is divided into 100 sec bins |
 |
 |
| Parameter | Plot |
|---|---|
| CZT HV Monitor | 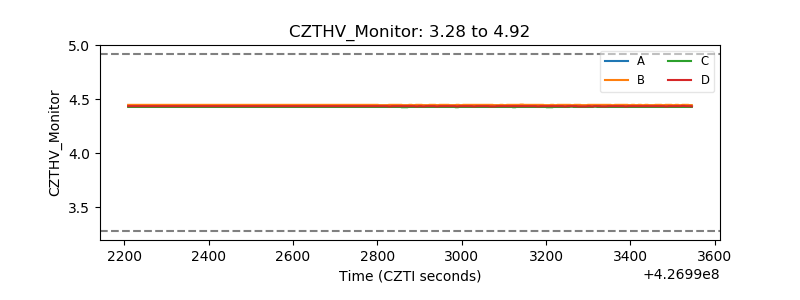 |
| D_VDD | 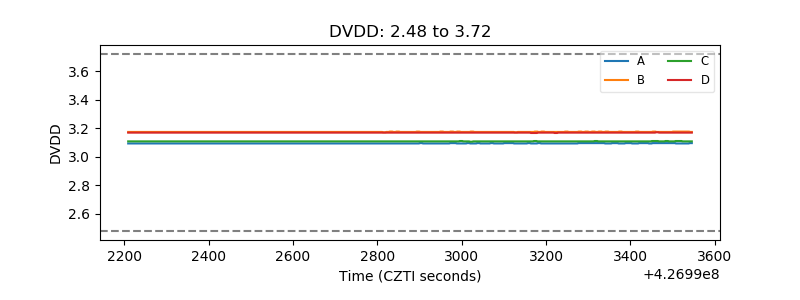 |
| Temperature 1 | 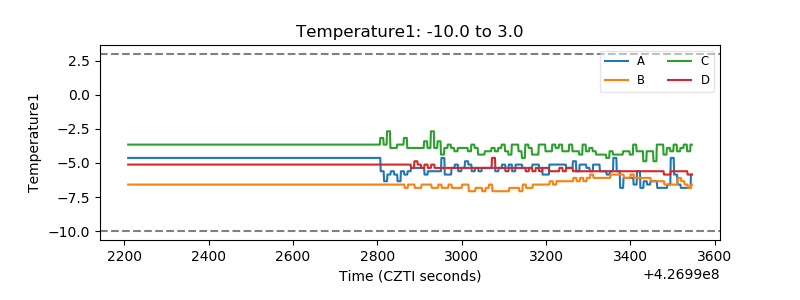 |
| Veto HV Monitor |  |
| Veto LLD | 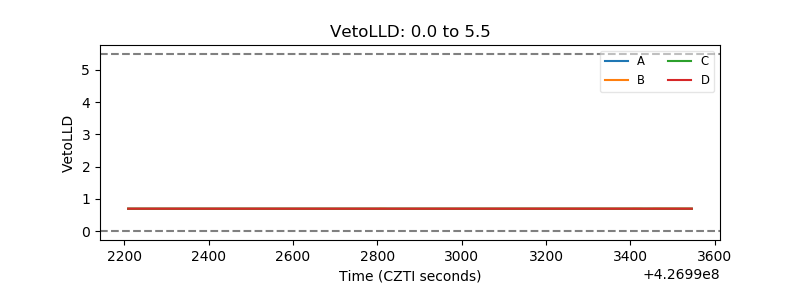 |
| Alpha Counter | 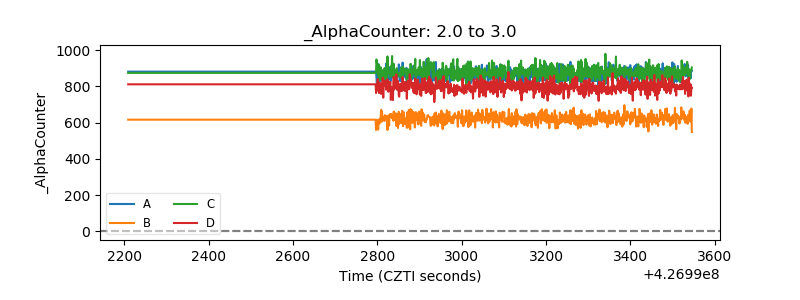 |
| _CPM_Rate | 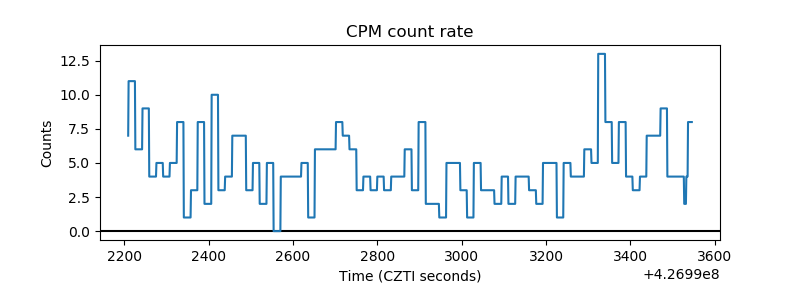 |
| CZT Counter | 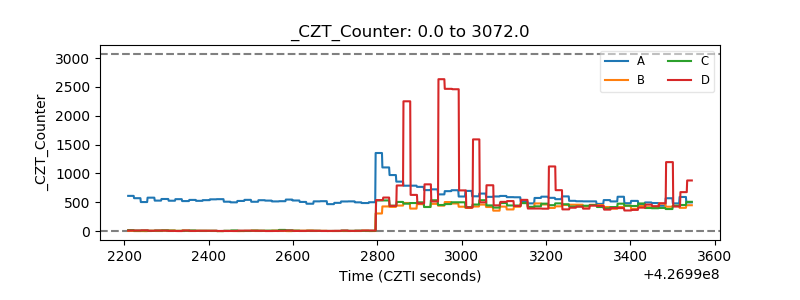 |
| +2.5 Volts monitor | 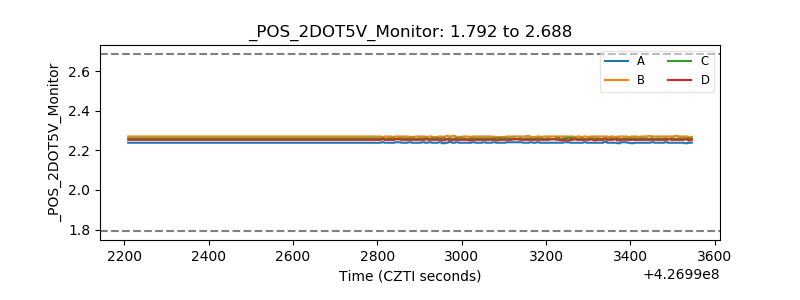 |
| +5 Volts monitor |  |
| _ROLL_ROT | 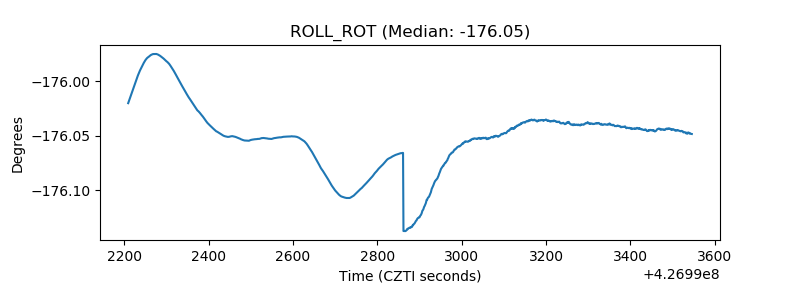 |
| _Roll_DEC | 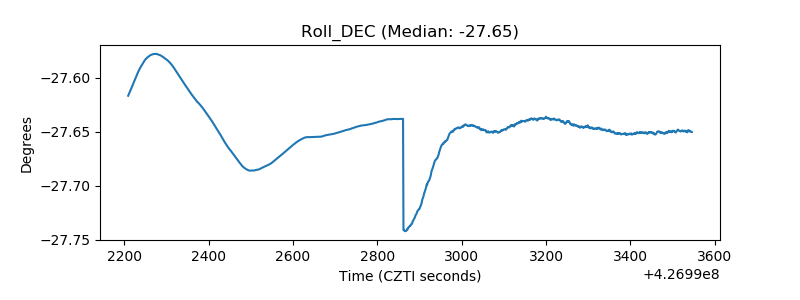 |
| _Roll_RA | 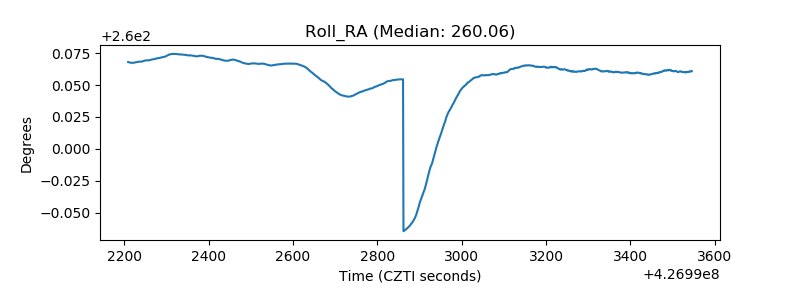 |
| Veto Counter | 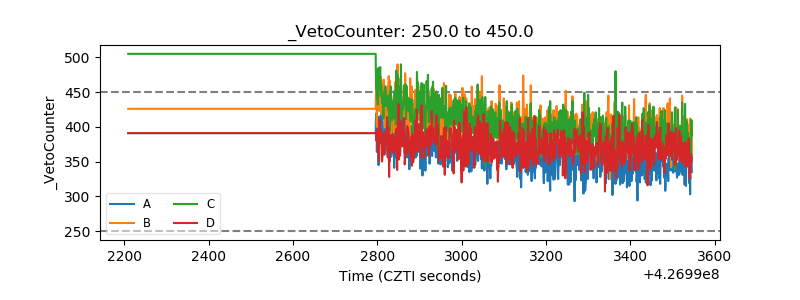 |