| Param | Original file | Final file |
|---|---|---|
| Filename | modeM0/AS1A12_088T19_9000005754_42129cztM0_level2.fits | modeM0/AS1A12_088T19_9000005754_42129cztM0_level2_quad_clean.evt |
| Size (bytes) | 302,235,840 | 82,560,960 |
| Size | 288.2 MB | 78.7 MB |
| Events in quadrant A | 2,649,001 | 564,198 |
| Events in quadrant B | 2,222,029 | 580,748 |
| Events in quadrant C | 2,331,179 | 547,885 |
| Events in quadrant D | 3,597,734 | 458,530 |
| Mode SS | |||
|---|---|---|---|
| Quadrant | BADHDUFLAG | Total packets | Discarded packets |
| A | 0 | 102 | 0 |
| B | 0 | 102 | 0 |
| C | 0 | 102 | 0 |
| D | 0 | 102 | 0 |
| Mode M9 | |||
|---|---|---|---|
| Quadrant | BADHDUFLAG | Total packets | Discarded packets |
| A | 0 | 26 | 0 |
| B | 0 | 26 | 0 |
| C | 0 | 26 | 0 |
| D | 0 | 26 | 0 |
| Mode M0 | |||
|---|---|---|---|
| Quadrant | BADHDUFLAG | Total packets | Discarded packets |
| A | 0 | 10825 | 2 |
| B | 0 | 10070 | 2 |
| C | 0 | 10001 | 2 |
| D | 0 | 14362 | 2 |
| Quadrant | Total seconds | Saturated seconds | Saturation percentage |
|---|---|---|---|
| A | 4971 | 8 | 0.160933% |
| B | 4971 | 9 | 0.181050% |
| C | 4971 | 3 | 0.060350% |
| D | 4971 | 462 | 9.293905% |
Noise dominated data is calculated using 1-second bins in cleaned event files. If a bin has >2000 counts, and if more than 50% of those come from <1% of pixels, then it is considered to be noise-dominated and hence unusable.
| Quadrant | # 1 sec bins | Bins with >0 counts | Bins with >2000 counts | High rate bins dominated by noise | Noise dominated (total time) | Noise dominated (detector-on time) | Marked lightcurve |
|---|---|---|---|---|---|---|---|
| A | 6974 | 4972 | 2 | 2 | 0.03% | 0.04% | 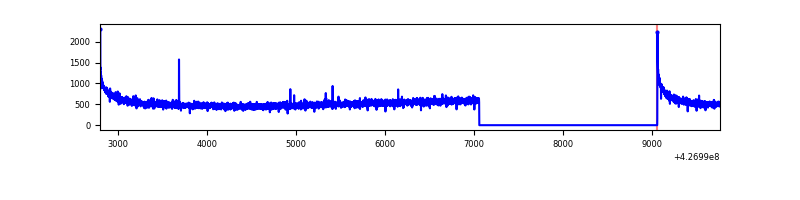 |
| B | 6974 | 4972 | 1 | 1 | 0.01% | 0.02% | 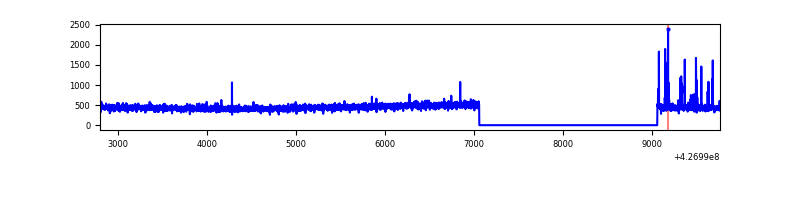 |
| C | 6974 | 4972 | 0 | 0 | 0.00% | 0.00% | 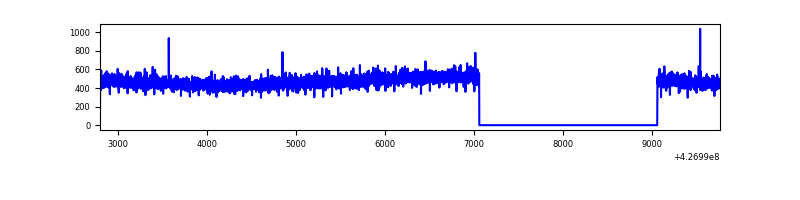 |
| D | 6974 | 4972 | 406 | 406 | 5.82% | 8.17% | 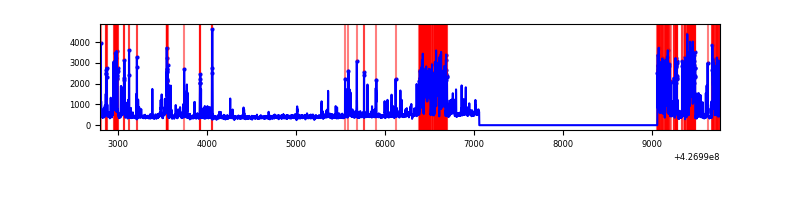 |
Top three noisy pixels from each quadrant. If the there are fewer than three noisy pixels in the level2.evt file, extra rows are filled as -1
| Pixel properties | Quadrant properties | ||||||
|---|---|---|---|---|---|---|---|
| Quadrant | DetID | PixID | Counts | Sigma | Mean | Median | Sigma |
| A | 10 | 83 | 499773 | 4317.62 | 555 | 543 | 115.6 |
| A | 3 | 137 | 6123 | 48.26 | 555 | 543 | 115.6 |
| A | 13 | 254 | 5704 | 44.64 | 555 | 543 | 115.6 |
| B | 3 | 112 | 18197 | 162.34 | 554 | 538 | 108.8 |
| B | 12 | 111 | 13884 | 122.69 | 554 | 538 | 108.8 |
| B | 11 | 111 | 12906 | 113.7 | 554 | 538 | 108.8 |
| C | 15 | 214 | 207937 | 1620.47 | 543 | 545 | 128.0 |
| C | 13 | 61 | 3639 | 24.18 | 543 | 545 | 128.0 |
| C | 8 | 79 | 3217 | 20.88 | 543 | 545 | 128.0 |
| D | 13 | 249 | 835204 | 6546.97 | 513 | 497 | 127.5 |
| D | 12 | 6 | 321671 | 2519.11 | 513 | 497 | 127.5 |
| D | 2 | 249 | 242130 | 1895.23 | 513 | 497 | 127.5 |
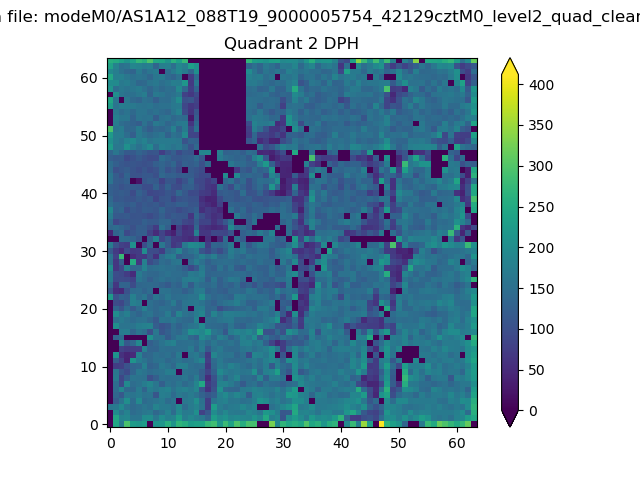
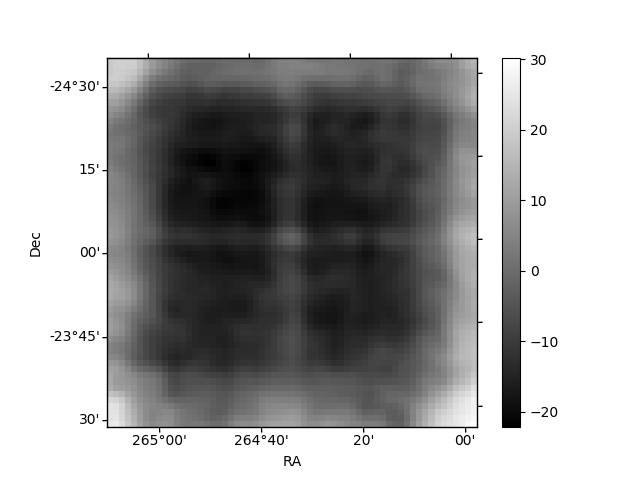
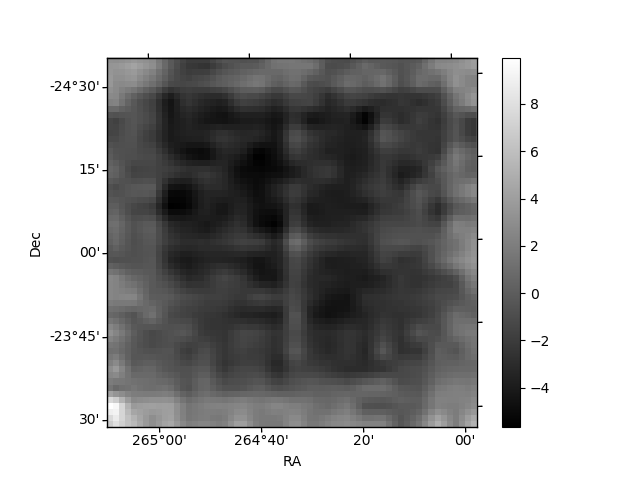
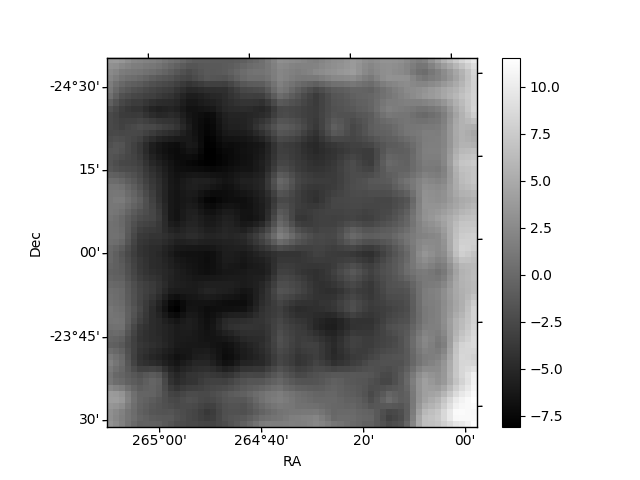
Histogram calculated using DETX and DETY for each event in the final _common_clean file
| Quadrant A | 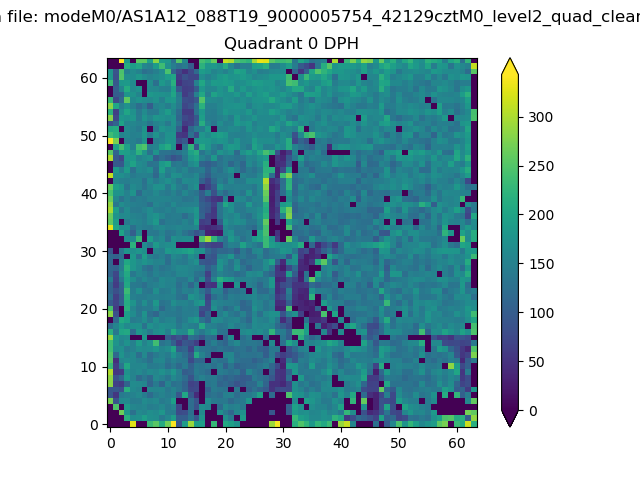 |
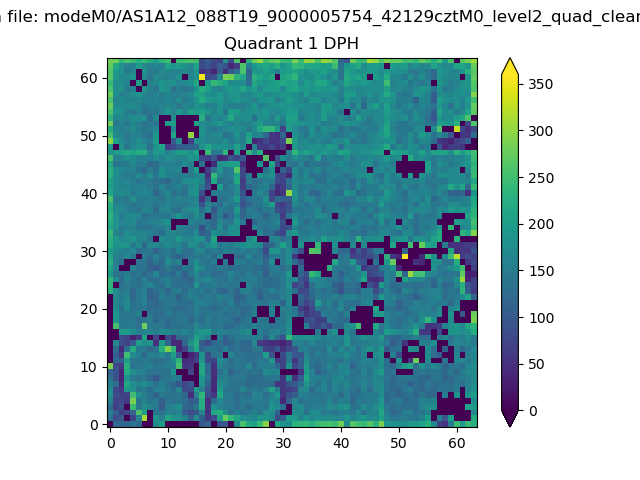 |
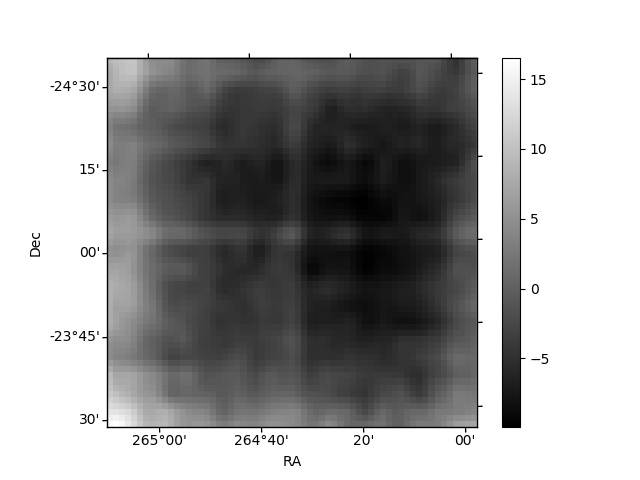
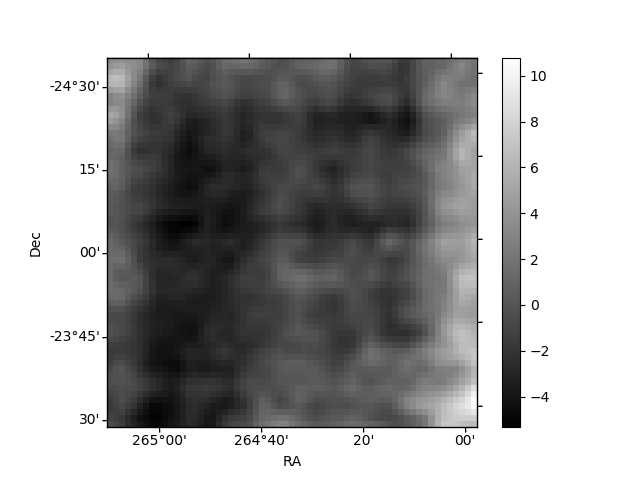
Quadrant B |
|---|---|---|---|
| Quadrant D | 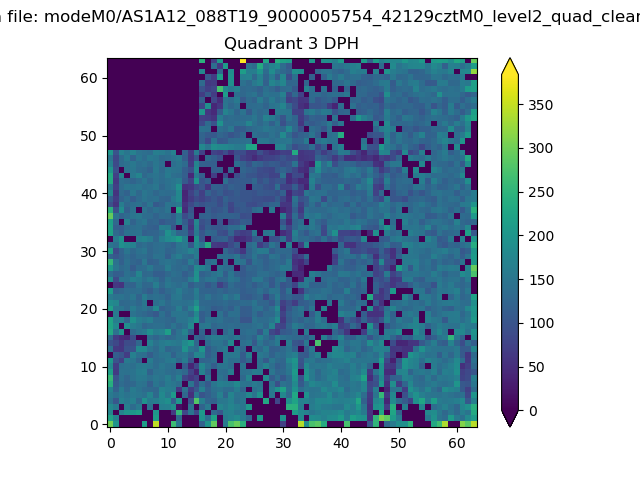 |
 |
Quadrant C |
| Plot type | Count rate plots | Images |
|---|---|---|
| Comparison with Poisson distribution Blue bars denote a histogram of data divided into 1 sec bins. Red curve is a Poisson curve with rate = median count rate of data. |
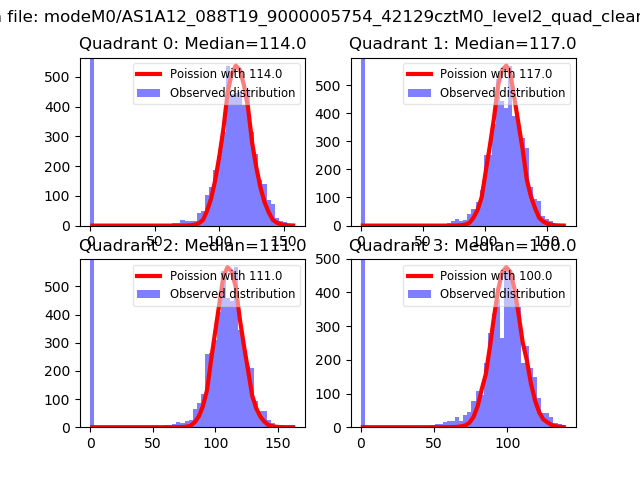 |
 |
| Quadrant-wise count rates Data is divided into 100 sec bins |
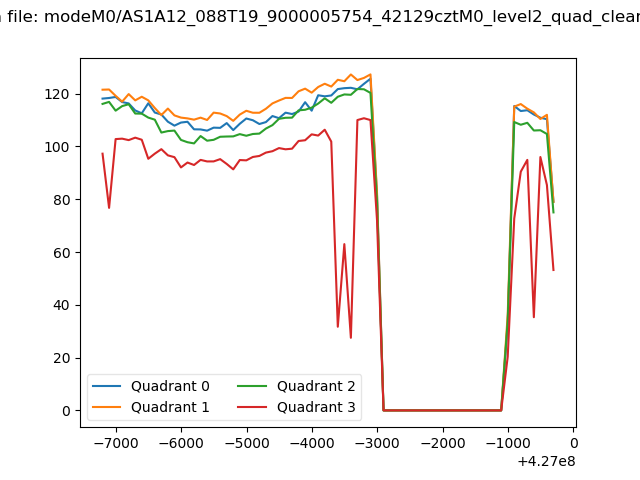 |
|
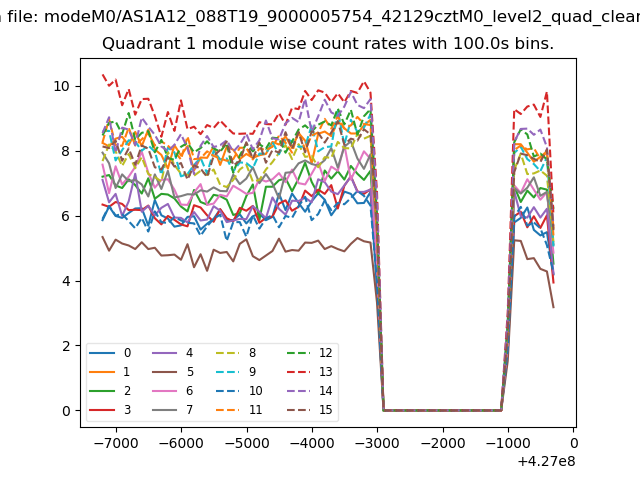
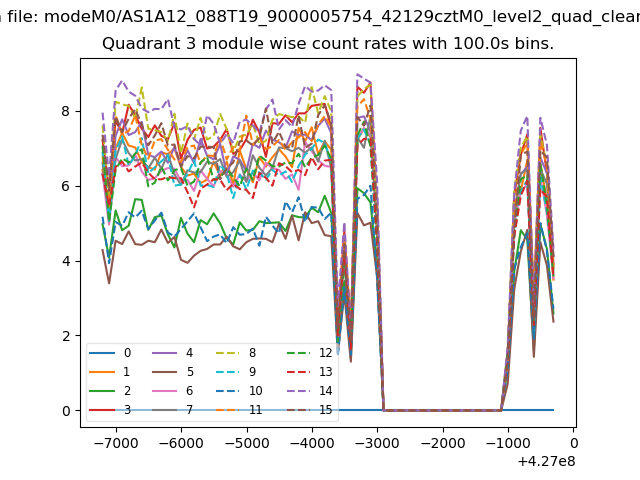
| Module-wise count rates for Quadrant A Data is divided into 100 sec bins |
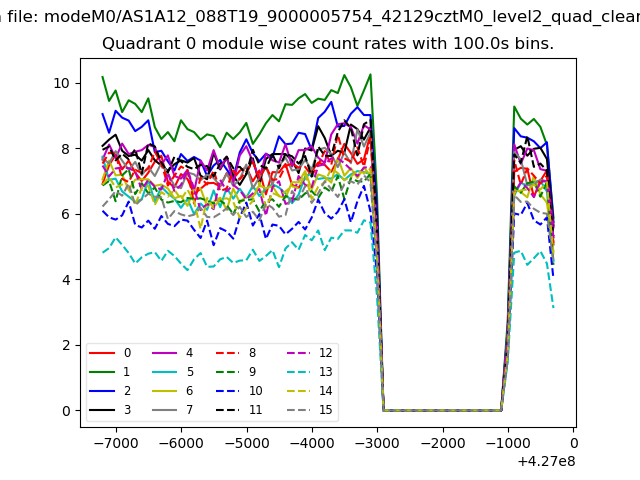 |
 |
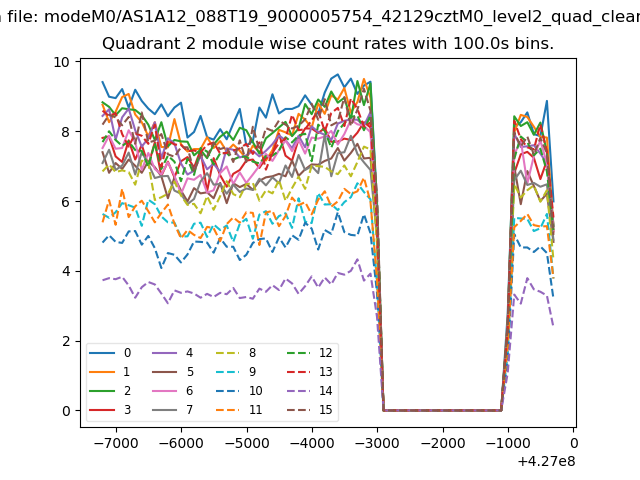
| Module-wise count rates for Quadrant B Data is divided into 100 sec bins |
 |
 |
| Module-wise count rates for Quadrant C Data is divided into 100 sec bins |
 |
 |
| Module-wise count rates for Quadrant D Data is divided into 100 sec bins |
 |
 |
| Parameter | Plot |
|---|---|
| CZT HV Monitor | 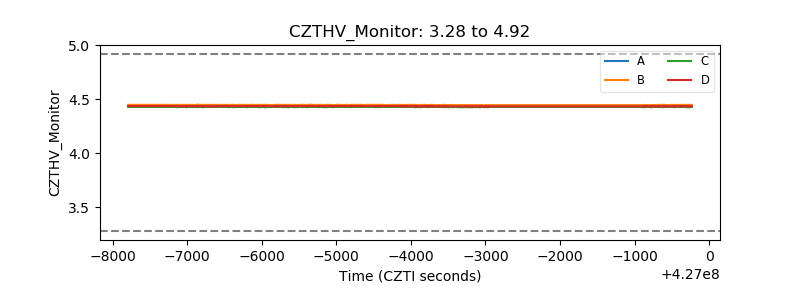 |
| D_VDD |  |
| Temperature 1 | 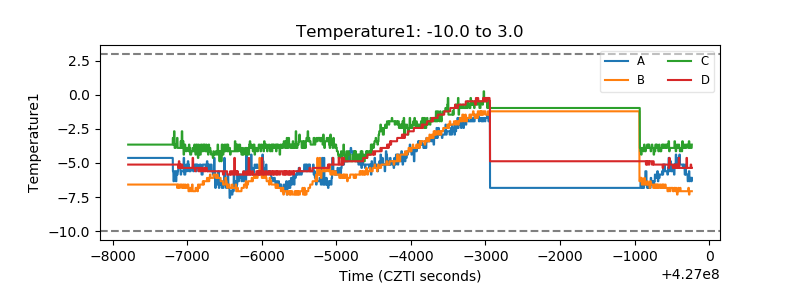 |
| Veto HV Monitor | 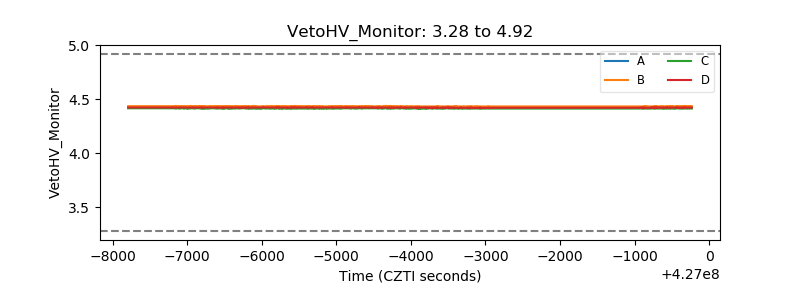 |
| Veto LLD | 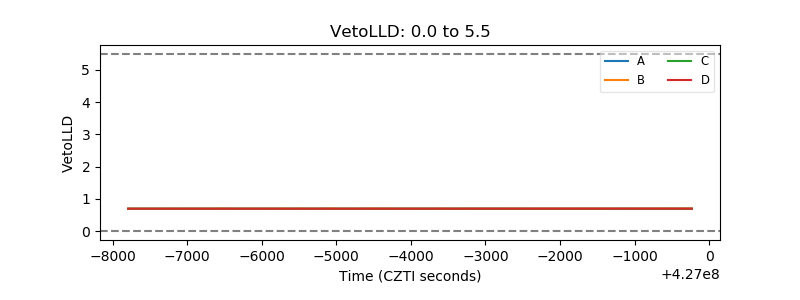 |
| Alpha Counter | 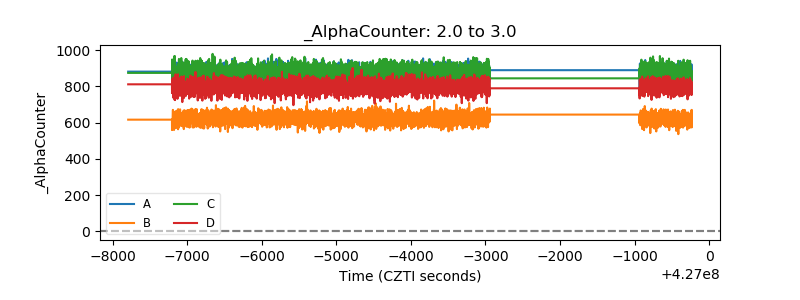 |
| _CPM_Rate | 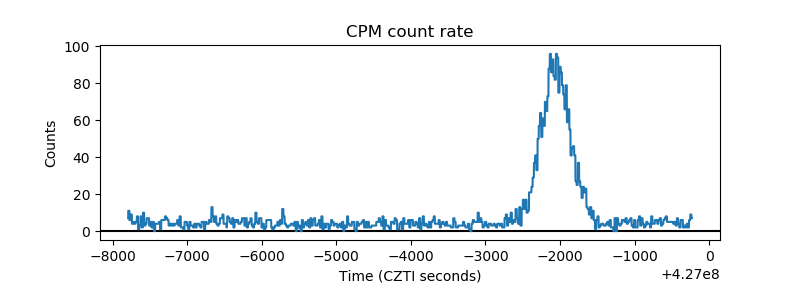 |
| CZT Counter | 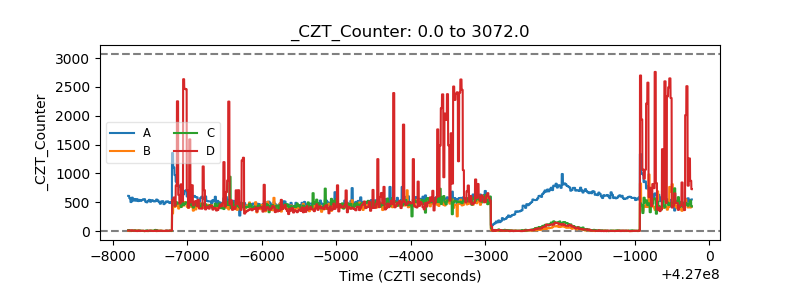 |
| +2.5 Volts monitor | 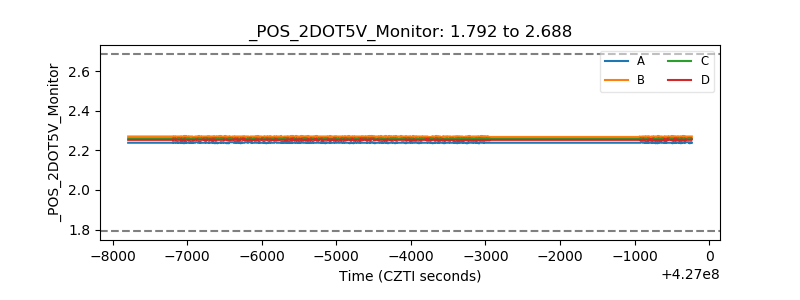 |
| +5 Volts monitor | 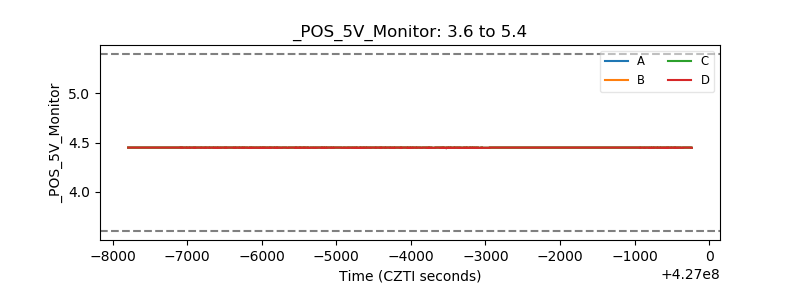 |
| _ROLL_ROT | 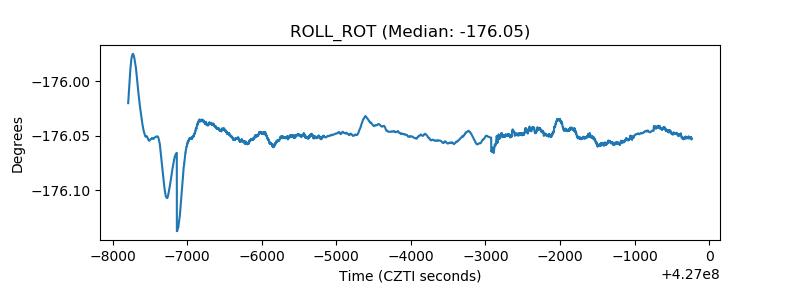 |
| _Roll_DEC | 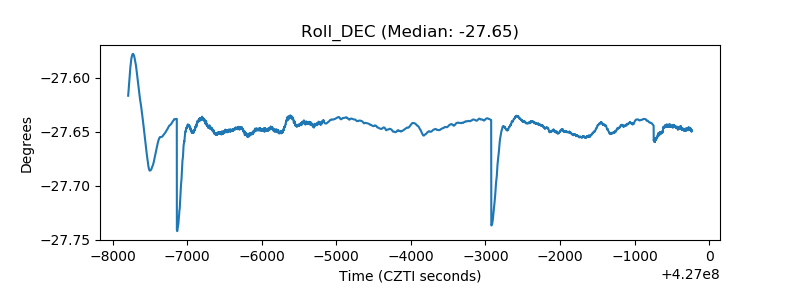 |
| _Roll_RA | 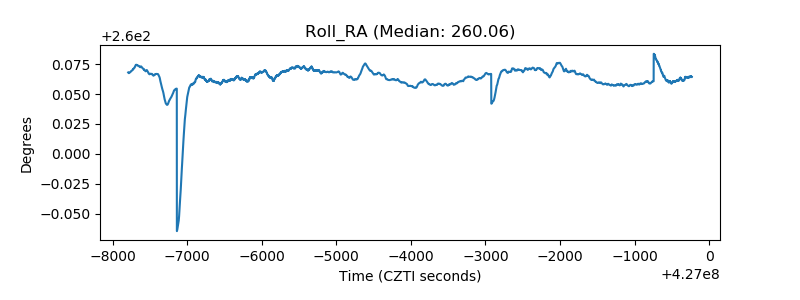 |
| Veto Counter | 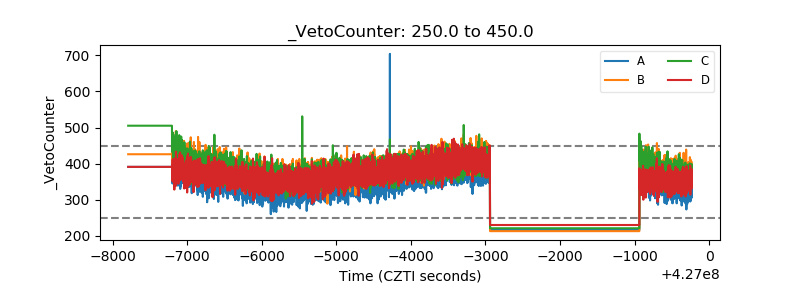 |