| Param | Original file | Final file |
|---|---|---|
| Filename | modeM0/AS1A12_088T19_9000005754_42130cztM0_level2.fits | modeM0/AS1A12_088T19_9000005754_42130cztM0_level2_quad_clean.evt |
| Size (bytes) | 336,758,400 | 87,658,560 |
| Size | 321.2 MB | 83.6 MB |
| Events in quadrant A | 2,880,023 | 594,229 |
| Events in quadrant B | 2,494,732 | 612,937 |
| Events in quadrant C | 2,539,798 | 575,848 |
| Events in quadrant D | 4,132,754 | 495,556 |
| Mode SS | |||
|---|---|---|---|
| Quadrant | BADHDUFLAG | Total packets | Discarded packets |
| A | 0 | 108 | 0 |
| B | 0 | 108 | 0 |
| C | 0 | 108 | 0 |
| D | 0 | 108 | 0 |
| Mode M9 | |||
|---|---|---|---|
| Quadrant | BADHDUFLAG | Total packets | Discarded packets |
| A | 0 | 29 | 0 |
| B | 0 | 30 | 0 |
| C | 0 | 30 | 0 |
| D | 0 | 30 | 0 |
| Mode M0 | |||
|---|---|---|---|
| Quadrant | BADHDUFLAG | Total packets | Discarded packets |
| A | 0 | 11651 | 2 |
| B | 0 | 11153 | 2 |
| C | 0 | 10837 | 2 |
| D | 0 | 16086 | 5 |
| Quadrant | Total seconds | Saturated seconds | Saturation percentage |
|---|---|---|---|
| A | 5369 | 11 | 0.204880% |
| B | 5369 | 14 | 0.260756% |
| C | 5369 | 6 | 0.111753% |
| D | 5368 | 427 | 7.954545% |
Noise dominated data is calculated using 1-second bins in cleaned event files. If a bin has >2000 counts, and if more than 50% of those come from <1% of pixels, then it is considered to be noise-dominated and hence unusable.
| Quadrant | # 1 sec bins | Bins with >0 counts | Bins with >2000 counts | High rate bins dominated by noise | Noise dominated (total time) | Noise dominated (detector-on time) | Marked lightcurve |
|---|---|---|---|---|---|---|---|
| A | 7042 | 5370 | 2 | 2 | 0.03% | 0.04% | 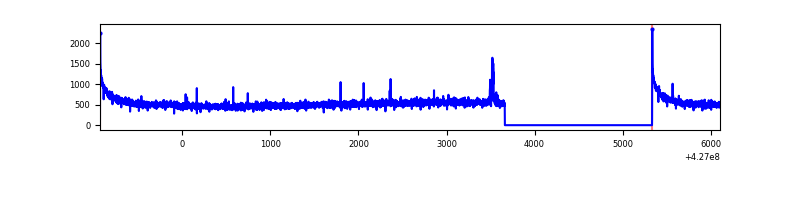 |
| B | 7042 | 5370 | 2 | 2 | 0.03% | 0.04% | 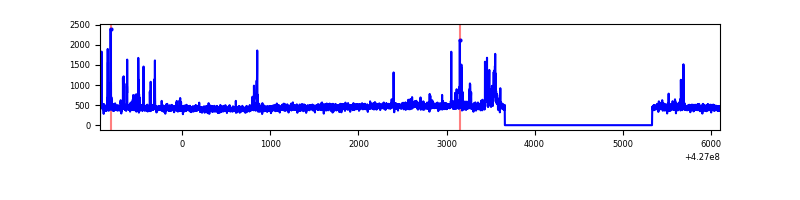 |
| C | 7042 | 5370 | 0 | 0 | 0.00% | 0.00% | 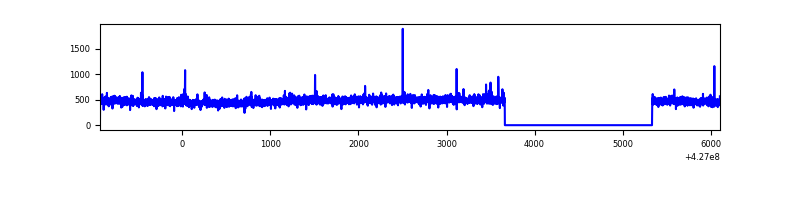 |
| D | 7041 | 5369 | 383 | 383 | 5.44% | 7.13% | 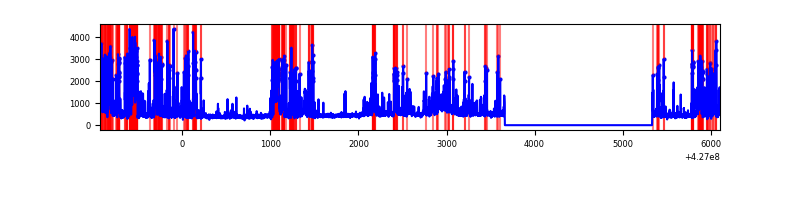 |
Top three noisy pixels from each quadrant. If the there are fewer than three noisy pixels in the level2.evt file, extra rows are filled as -1
| Pixel properties | Quadrant properties | ||||||
|---|---|---|---|---|---|---|---|
| Quadrant | DetID | PixID | Counts | Sigma | Mean | Median | Sigma |
| A | 10 | 83 | 535566 | 4324.27 | 597 | 583 | 123.7 |
| A | 15 | 223 | 23803 | 187.69 | 597 | 583 | 123.7 |
| A | 13 | 6 | 10899 | 83.38 | 597 | 583 | 123.7 |
| B | 3 | 112 | 79139 | 667.32 | 596 | 579 | 117.7 |
| B | 4 | 81 | 23388 | 193.75 | 596 | 579 | 117.7 |
| B | 15 | 85 | 20471 | 168.97 | 596 | 579 | 117.7 |
| C | 15 | 214 | 224781 | 1630.42 | 584 | 586 | 137.5 |
| C | 8 | 79 | 13180 | 91.59 | 584 | 586 | 137.5 |
| C | 7 | 247 | 11556 | 79.78 | 584 | 586 | 137.5 |
| D | 13 | 249 | 939190 | 6762.15 | 562 | 545 | 138.8 |
| D | 12 | 6 | 406193 | 2922.35 | 562 | 545 | 138.8 |
| D | 1 | 52 | 237254 | 1705.29 | 562 | 545 | 138.8 |
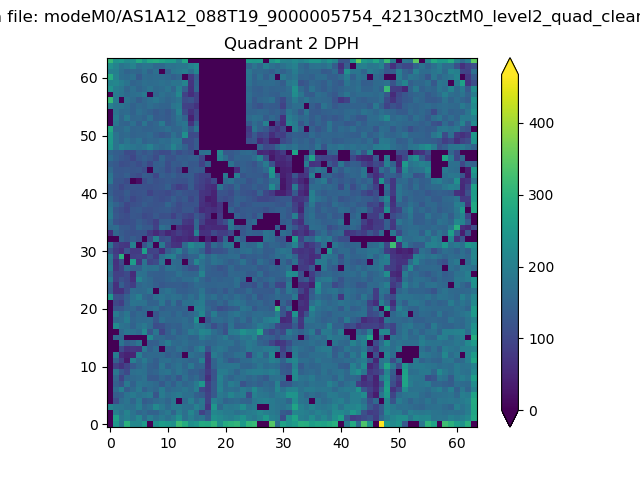
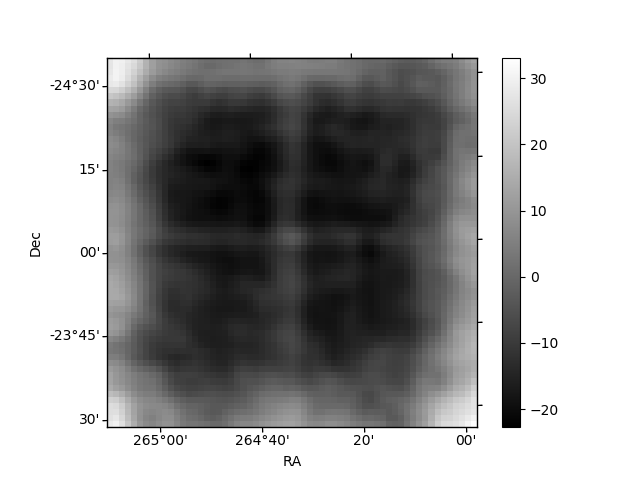
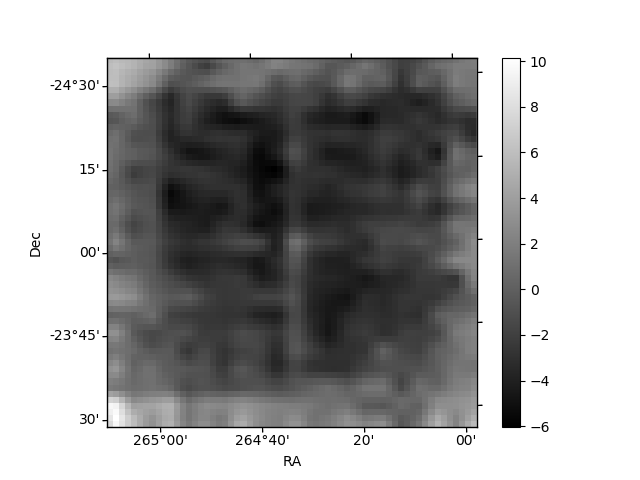
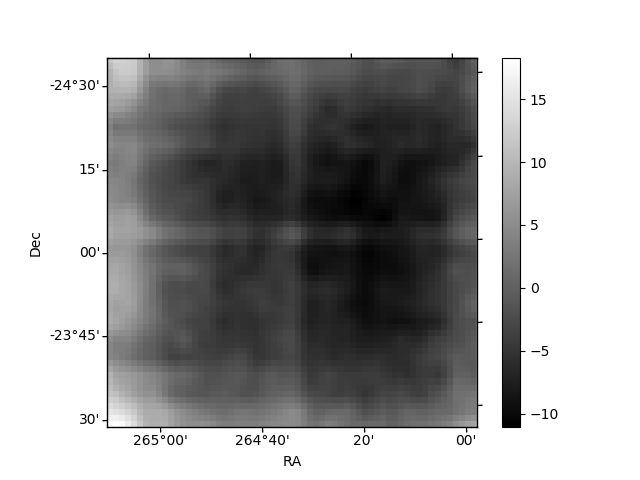
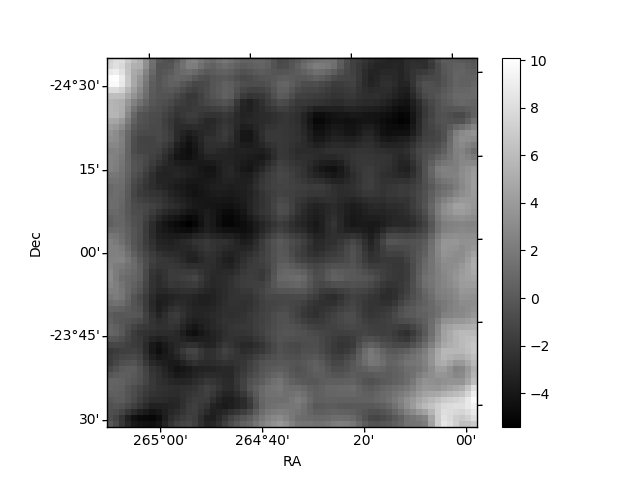
Histogram calculated using DETX and DETY for each event in the final _common_clean file
| Quadrant A | 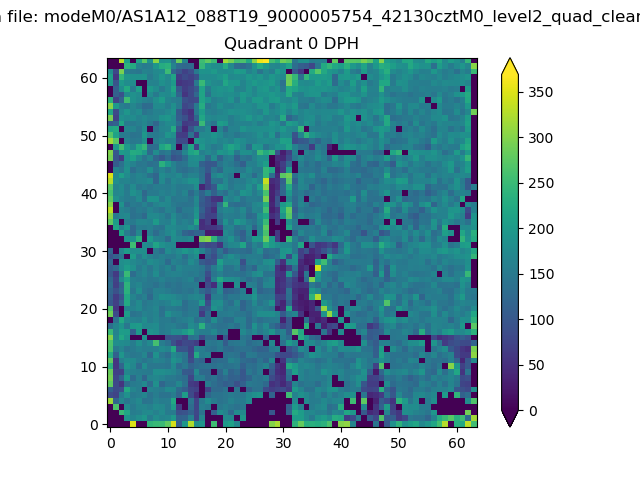 |
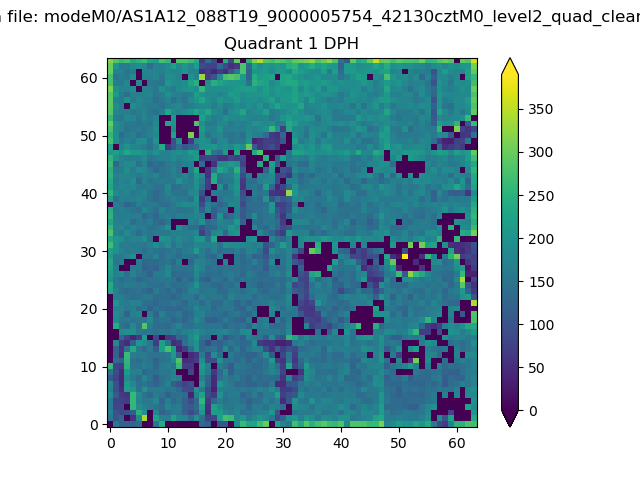 |
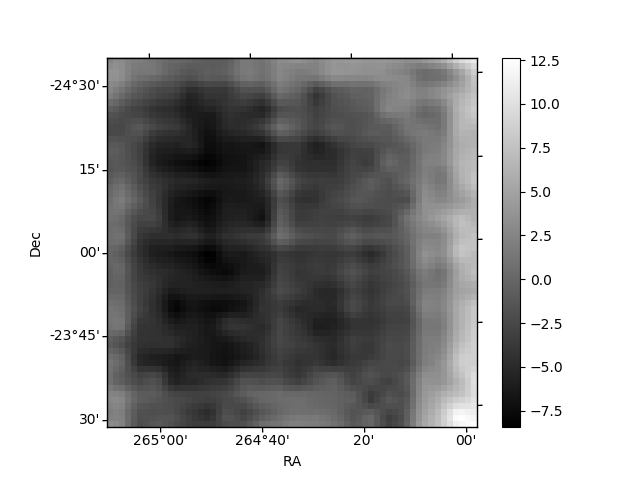
Quadrant B |
|---|---|---|---|
| Quadrant D | 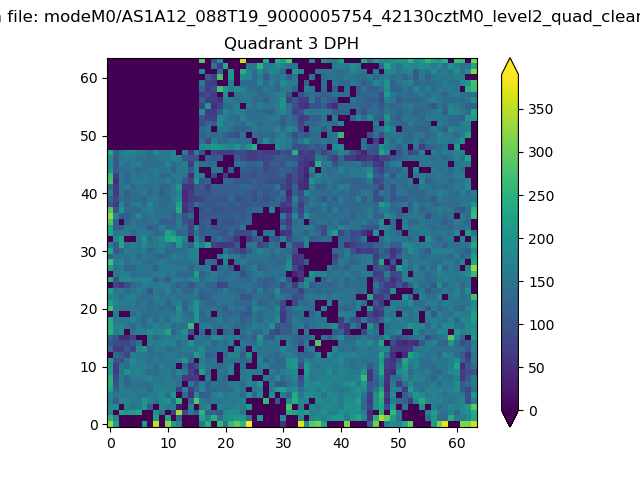 |
 |
Quadrant C |
| Plot type | Count rate plots | Images |
|---|---|---|
| Comparison with Poisson distribution Blue bars denote a histogram of data divided into 1 sec bins. Red curve is a Poisson curve with rate = median count rate of data. |
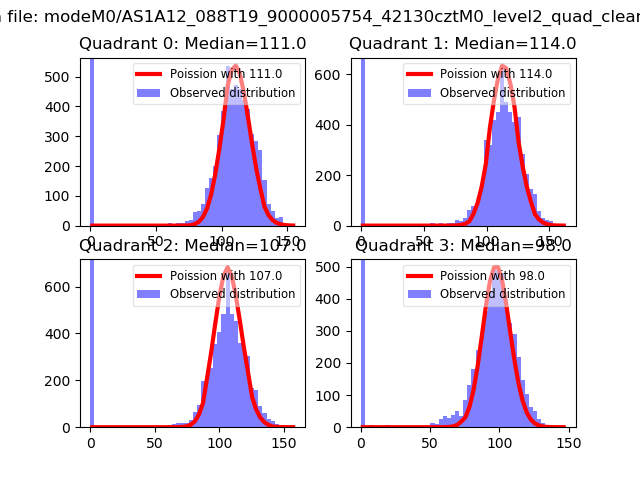 |
 |
| Quadrant-wise count rates Data is divided into 100 sec bins |
 |
|
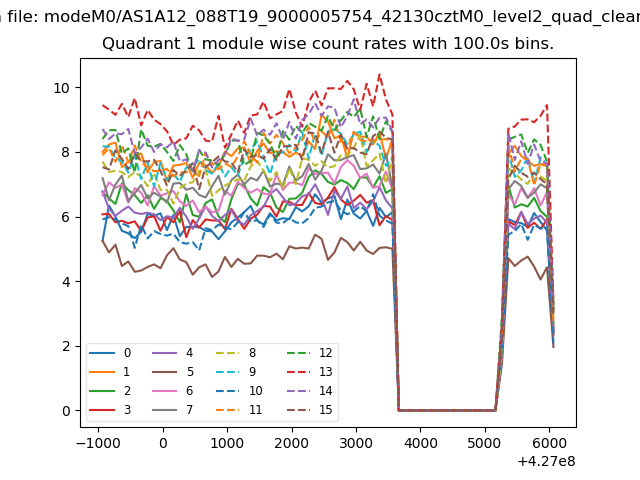
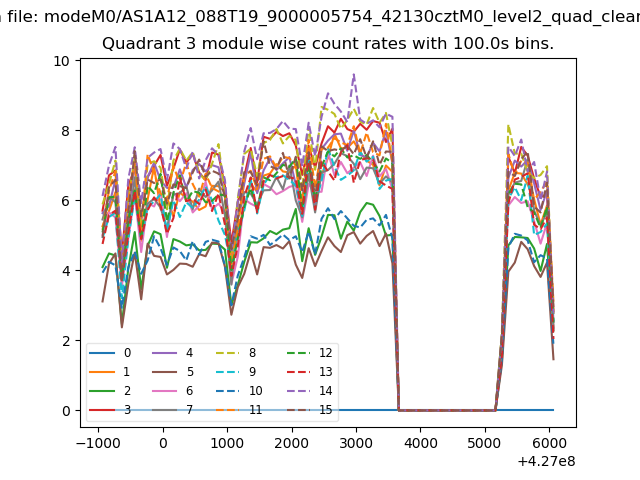
| Module-wise count rates for Quadrant A Data is divided into 100 sec bins |
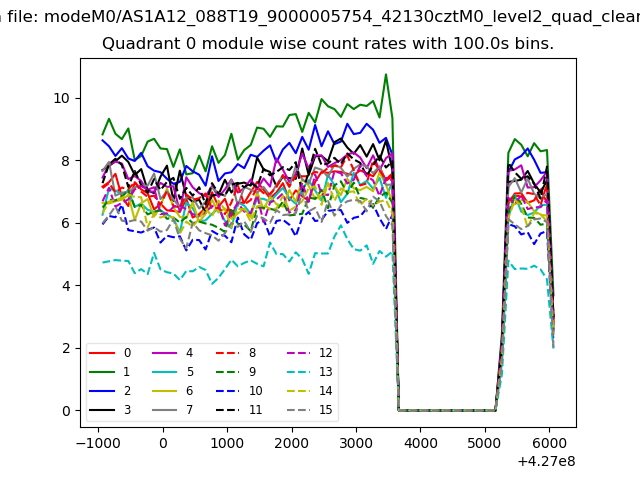 |
 |
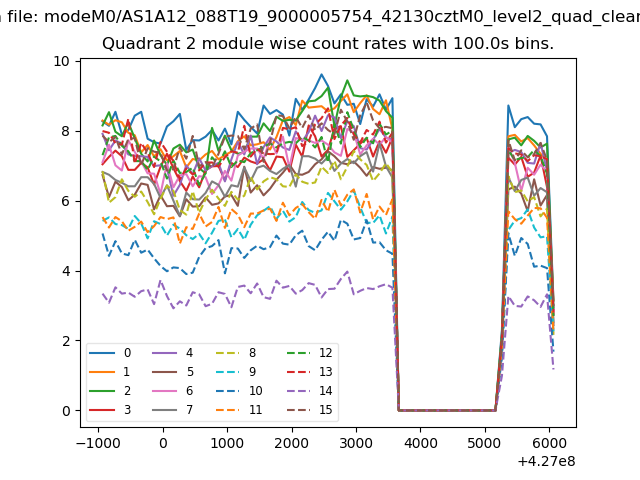
| Module-wise count rates for Quadrant B Data is divided into 100 sec bins |
 |
 |
| Module-wise count rates for Quadrant C Data is divided into 100 sec bins |
 |
 |
| Module-wise count rates for Quadrant D Data is divided into 100 sec bins |
 |
 |
| Parameter | Plot |
|---|---|
| CZT HV Monitor | 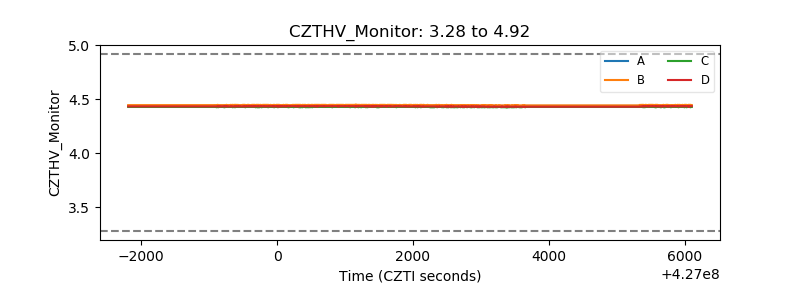 |
| D_VDD | 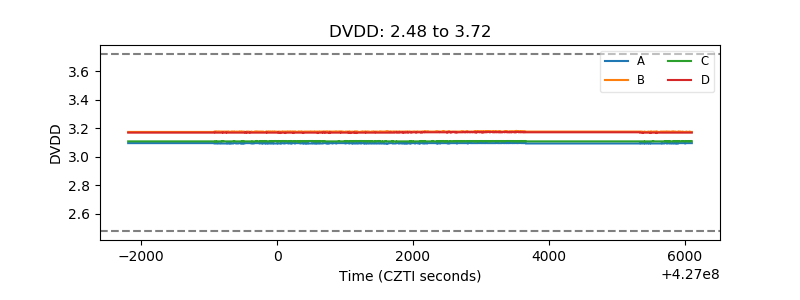 |
| Temperature 1 | 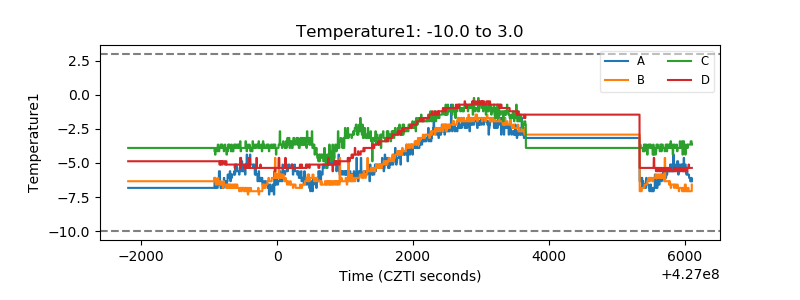 |
| Veto HV Monitor | 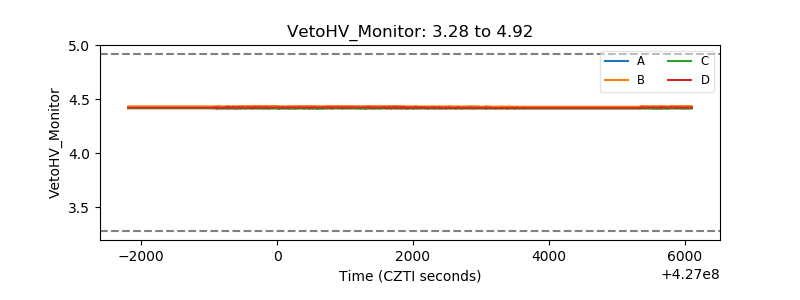 |
| Veto LLD | 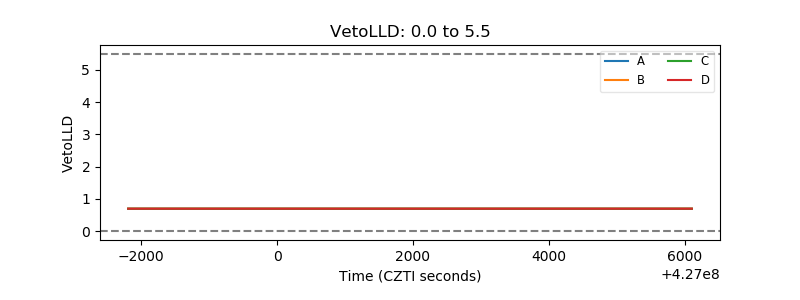 |
| Alpha Counter | 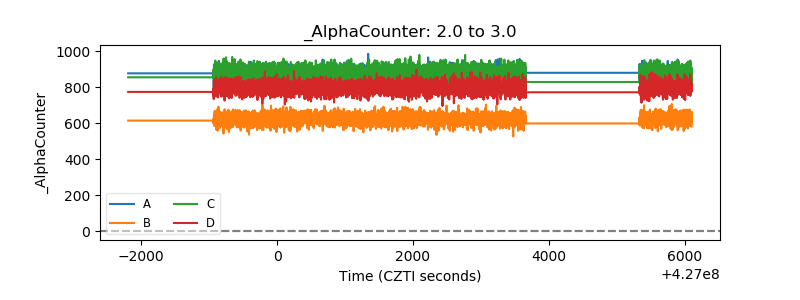 |
| _CPM_Rate | 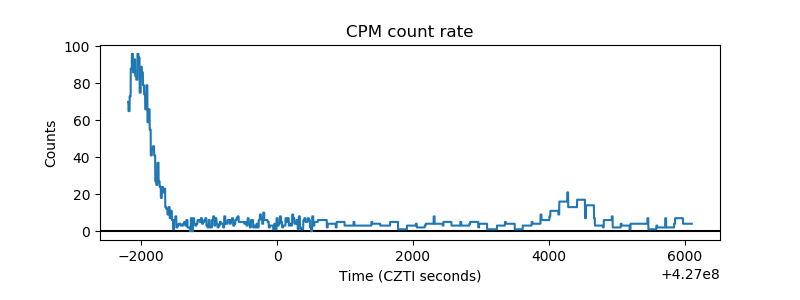 |
| CZT Counter | 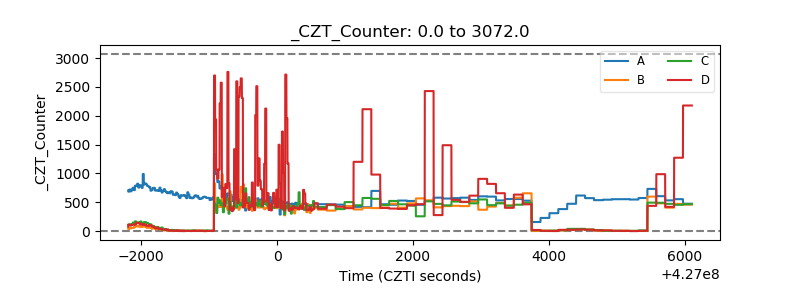 |
| +2.5 Volts monitor |  |
| +5 Volts monitor | 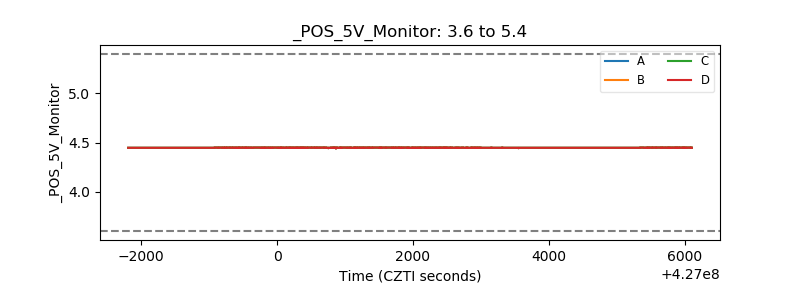 |
| _ROLL_ROT | 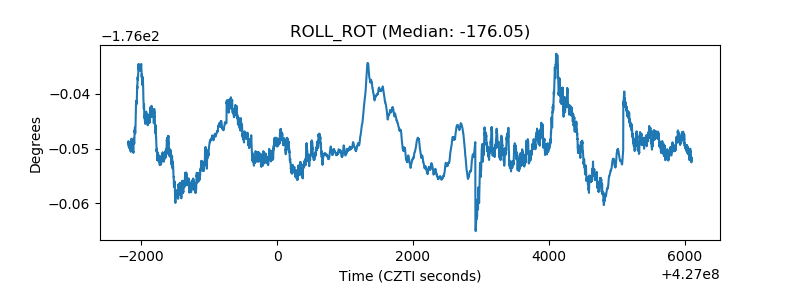 |
| _Roll_DEC | 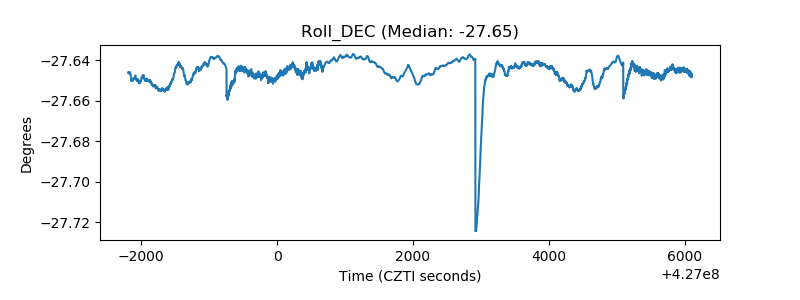 |
| _Roll_RA | 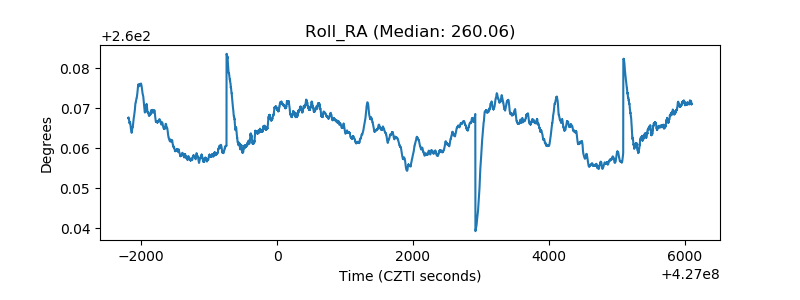 |
| Veto Counter | 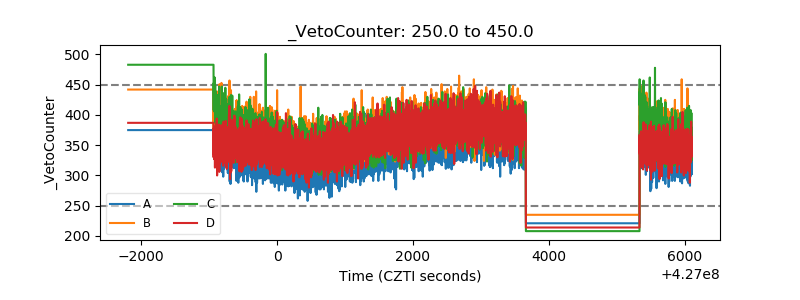 |