| Param | Original file | Final file |
|---|---|---|
| Filename | modeM0/AS1A12_088T20_9000005756_42132cztM0_level2.fits | modeM0/AS1A12_088T20_9000005756_42132cztM0_level2_quad_clean.evt |
| Size (bytes) | 314,539,200 | 79,997,760 |
| Size | 300.0 MB | 76.3 MB |
| Events in quadrant A | 2,554,605 | 542,032 |
| Events in quadrant B | 2,349,317 | 559,393 |
| Events in quadrant C | 2,323,182 | 530,219 |
| Events in quadrant D | 4,029,457 | 442,754 |
| Mode SS | |||
|---|---|---|---|
| Quadrant | BADHDUFLAG | Total packets | Discarded packets |
| A | 0 | 102 | 0 |
| B | 0 | 102 | 0 |
| C | 0 | 102 | 0 |
| D | 0 | 102 | 0 |
| Mode M9 | |||
|---|---|---|---|
| Quadrant | BADHDUFLAG | Total packets | Discarded packets |
| A | 0 | 8 | 0 |
| B | 0 | 9 | 0 |
| C | 0 | 9 | 0 |
| D | 0 | 9 | 0 |
| Mode M0 | |||
|---|---|---|---|
| Quadrant | BADHDUFLAG | Total packets | Discarded packets |
| A | 0 | 10323 | 1 |
| B | 0 | 10358 | 1 |
| C | 0 | 10003 | 1 |
| D | 0 | 15433 | 1 |
| Quadrant | Total seconds | Saturated seconds | Saturation percentage |
|---|---|---|---|
| A | 4956 | 5 | 0.100888% |
| B | 4956 | 27 | 0.544794% |
| C | 4956 | 1 | 0.020178% |
| D | 4956 | 513 | 10.351090% |
Noise dominated data is calculated using 1-second bins in cleaned event files. If a bin has >2000 counts, and if more than 50% of those come from <1% of pixels, then it is considered to be noise-dominated and hence unusable.
| Quadrant | # 1 sec bins | Bins with >0 counts | Bins with >2000 counts | High rate bins dominated by noise | Noise dominated (total time) | Noise dominated (detector-on time) | Marked lightcurve |
|---|---|---|---|---|---|---|---|
| A | 4956 | 4956 | 1 | 1 | 0.02% | 0.02% | 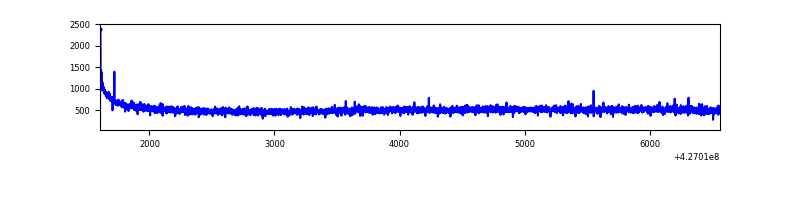 |
| B | 4956 | 4956 | 21 | 21 | 0.42% | 0.42% | 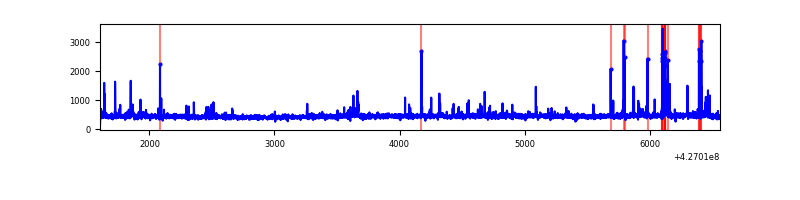 |
| C | 4956 | 4956 | 0 | 0 | 0.00% | 0.00% | 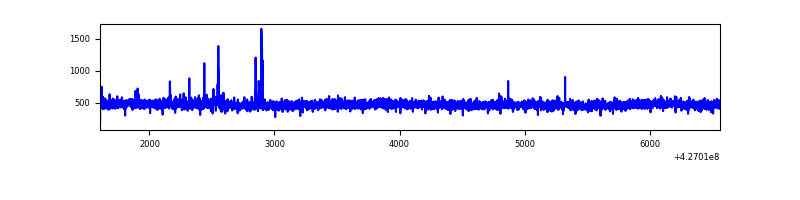 |
| D | 4956 | 4956 | 480 | 480 | 9.69% | 9.69% | 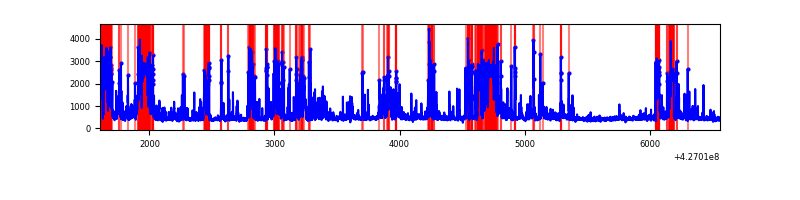 |
Top three noisy pixels from each quadrant. If the there are fewer than three noisy pixels in the level2.evt file, extra rows are filled as -1
| Pixel properties | Quadrant properties | ||||||
|---|---|---|---|---|---|---|---|
| Quadrant | DetID | PixID | Counts | Sigma | Mean | Median | Sigma |
| A | 10 | 83 | 421703 | 3703.63 | 550 | 539 | 113.7 |
| A | 13 | 6 | 6295 | 50.62 | 550 | 539 | 113.7 |
| A | 3 | 137 | 6289 | 50.56 | 550 | 539 | 113.7 |
| B | 5 | 255 | 93423 | 863.02 | 547 | 531 | 107.6 |
| B | 3 | 112 | 61121 | 562.91 | 547 | 531 | 107.6 |
| B | 0 | 229 | 17247 | 155.3 | 547 | 531 | 107.6 |
| C | 15 | 214 | 202871 | 1608.85 | 534 | 537 | 125.8 |
| C | 8 | 79 | 36211 | 283.66 | 534 | 537 | 125.8 |
| C | 13 | 61 | 3666 | 24.88 | 534 | 537 | 125.8 |
| D | 13 | 249 | 790977 | 6333.92 | 506 | 492 | 124.8 |
| D | 12 | 6 | 540493 | 4326.87 | 506 | 492 | 124.8 |
| D | 1 | 52 | 479064 | 3834.66 | 506 | 492 | 124.8 |
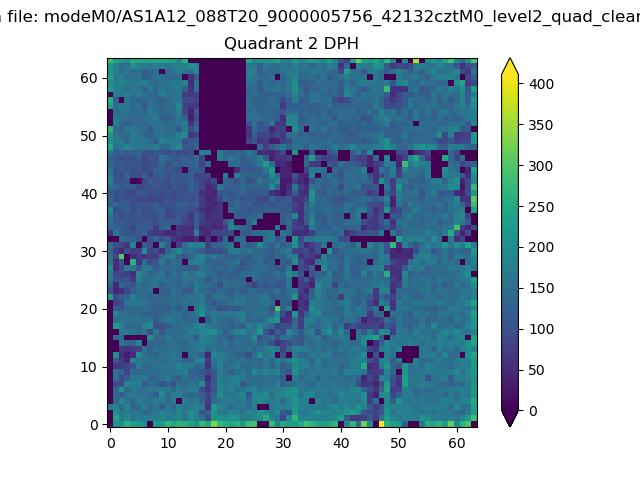
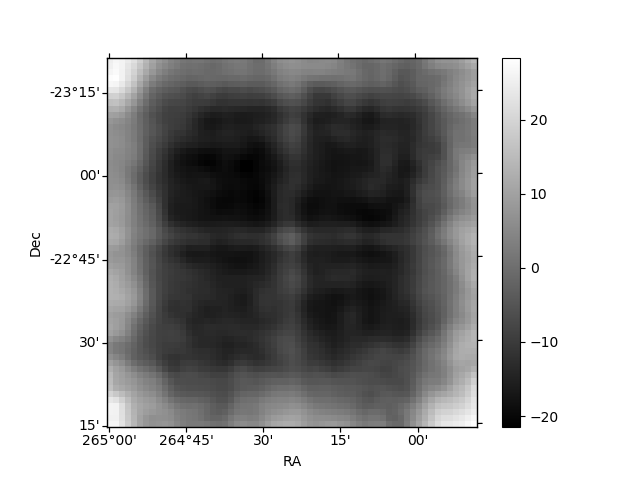
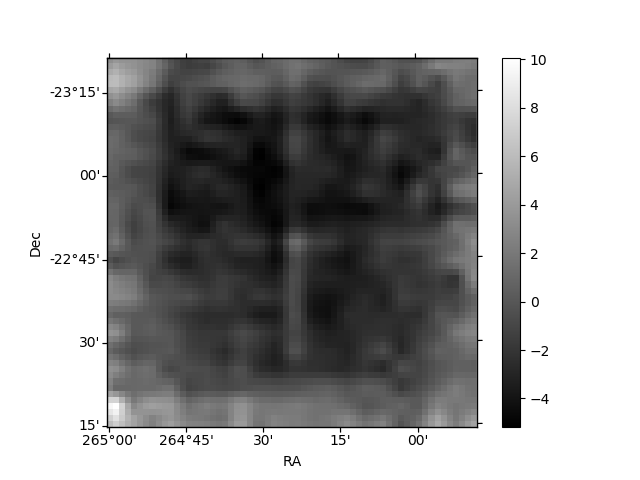
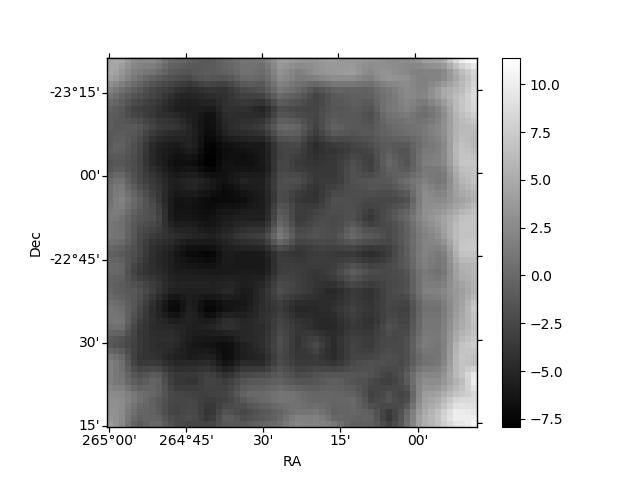
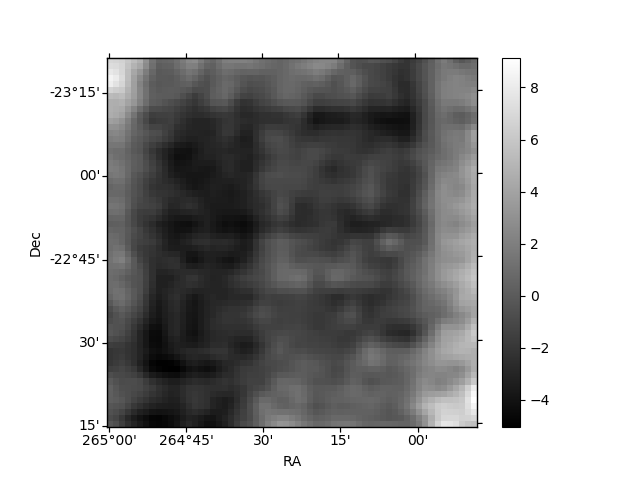
Histogram calculated using DETX and DETY for each event in the final _common_clean file
| Quadrant A | 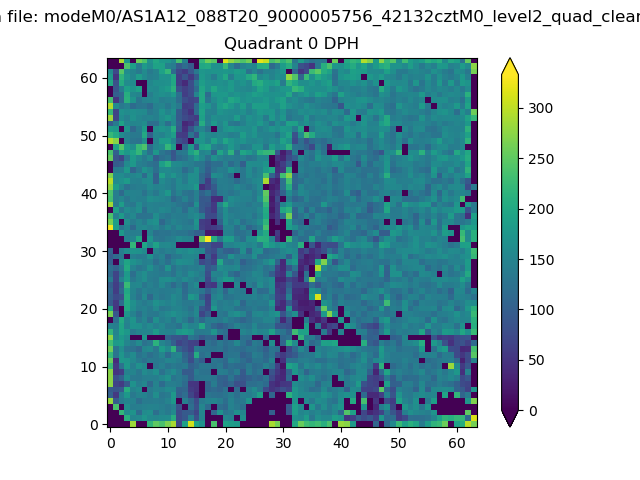 |
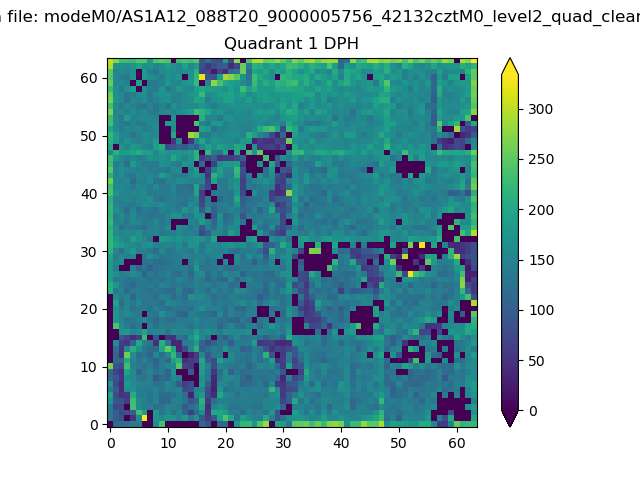 |
Quadrant B |
|---|---|---|---|
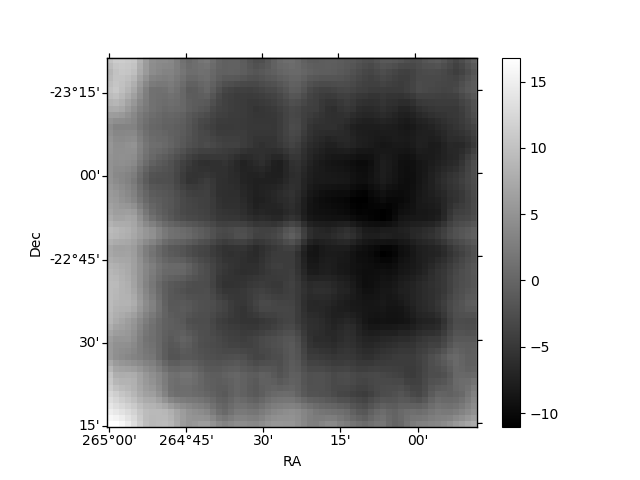
| Quadrant D | 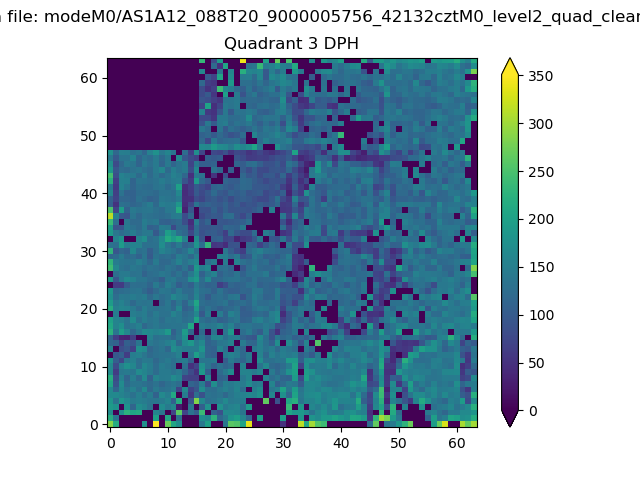 |
 |
Quadrant C |
| Plot type | Count rate plots | Images |
|---|---|---|
| Comparison with Poisson distribution Blue bars denote a histogram of data divided into 1 sec bins. Red curve is a Poisson curve with rate = median count rate of data. |
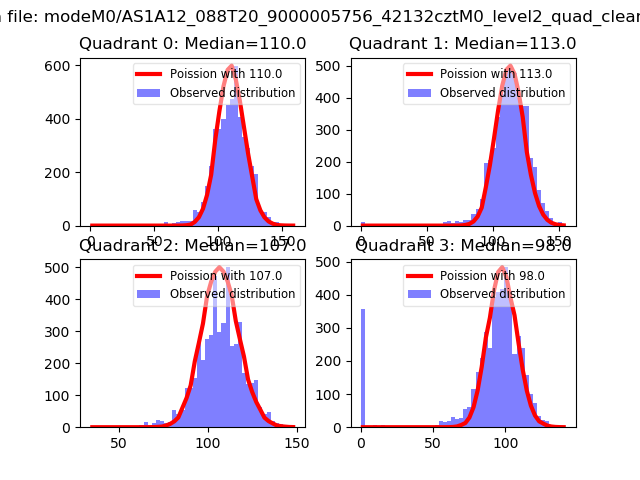 |
 |
| Quadrant-wise count rates Data is divided into 100 sec bins |
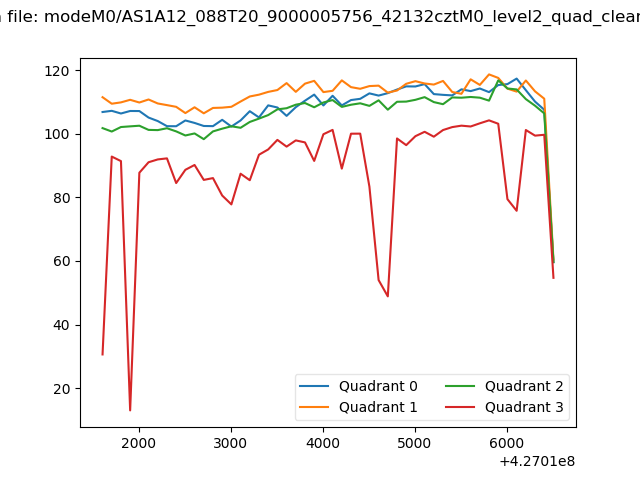 |
|
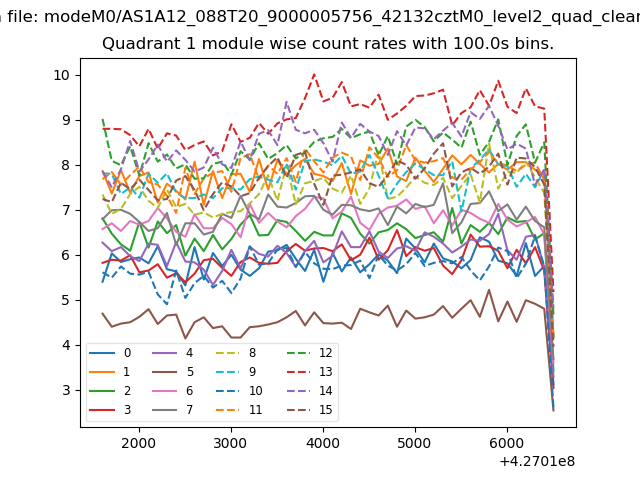
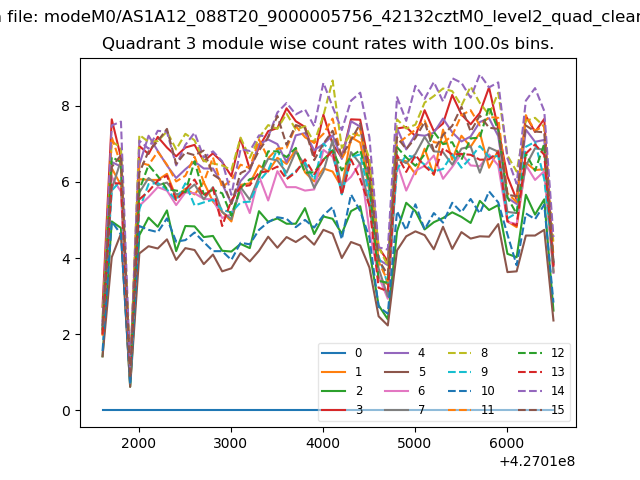
| Module-wise count rates for Quadrant A Data is divided into 100 sec bins |
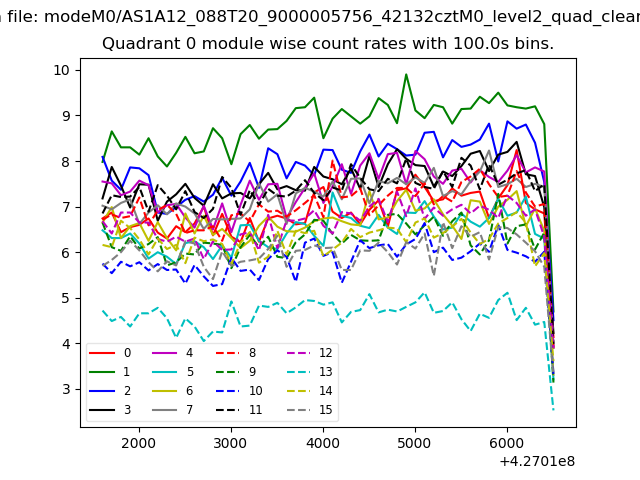 |
 |
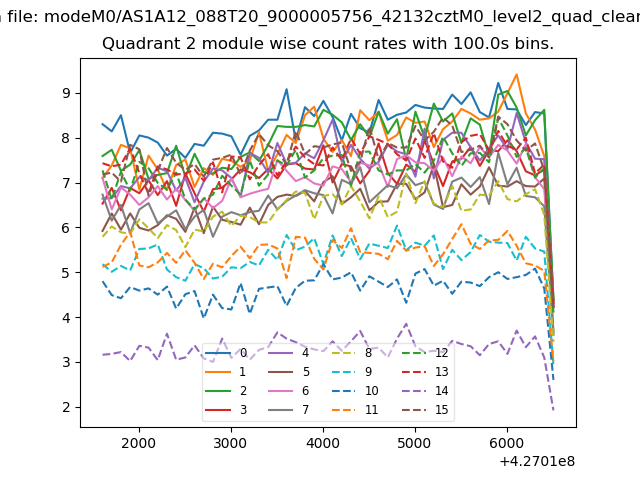
| Module-wise count rates for Quadrant B Data is divided into 100 sec bins |
 |
 |
| Module-wise count rates for Quadrant C Data is divided into 100 sec bins |
 |
 |
| Module-wise count rates for Quadrant D Data is divided into 100 sec bins |
 |
 |
| Parameter | Plot |
|---|---|
| CZT HV Monitor | 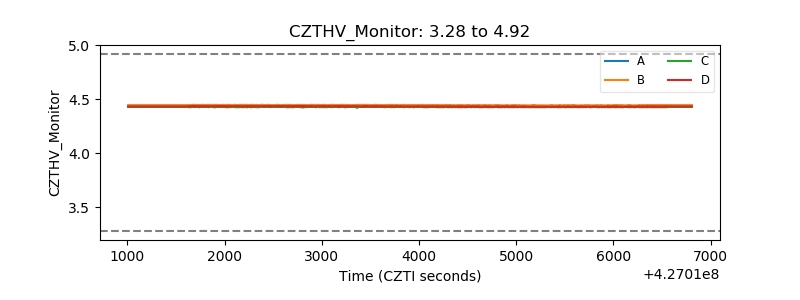 |
| D_VDD | 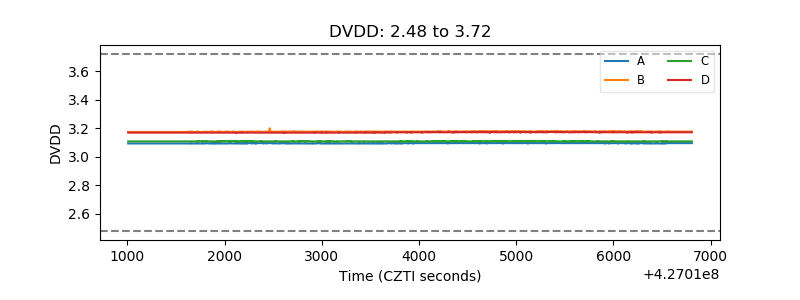 |
| Temperature 1 | 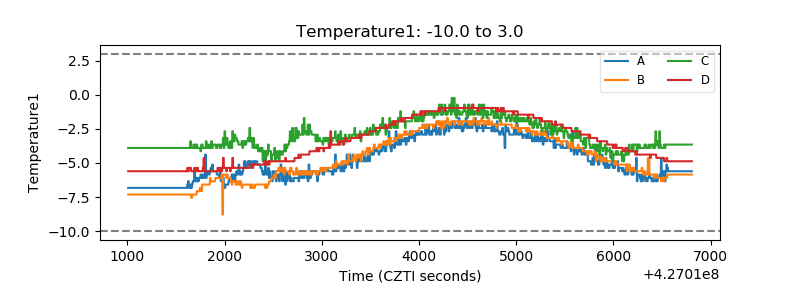 |
| Veto HV Monitor | 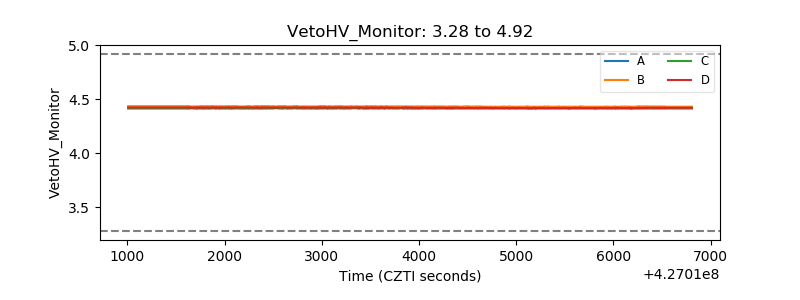 |
| Veto LLD | 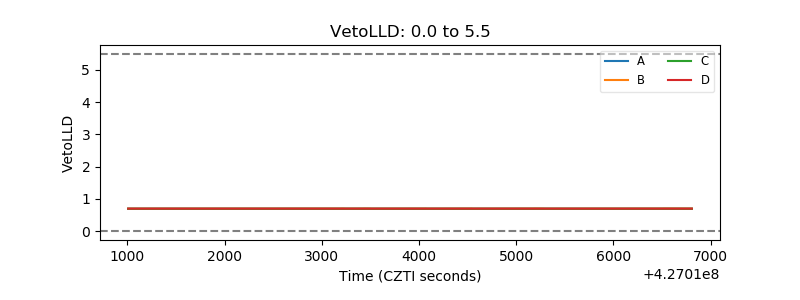 |
| Alpha Counter | 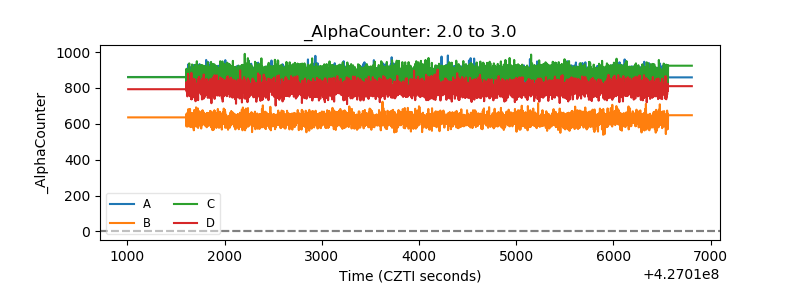 |
| _CPM_Rate | 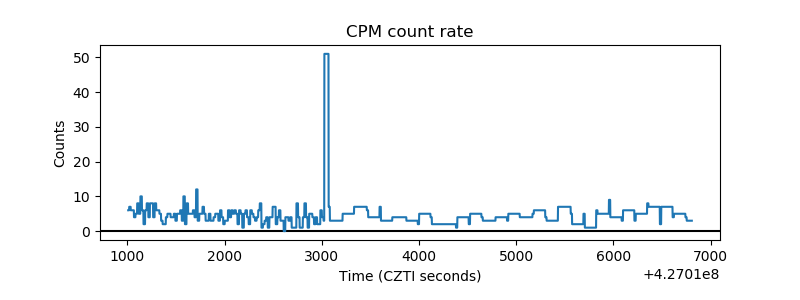 |
| CZT Counter | 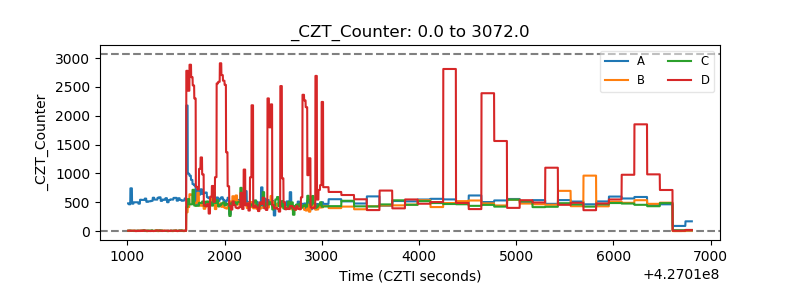 |
| +2.5 Volts monitor | 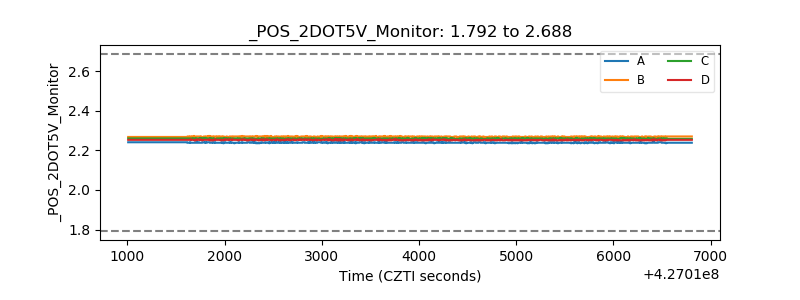 |
| +5 Volts monitor |  |
| _ROLL_ROT | 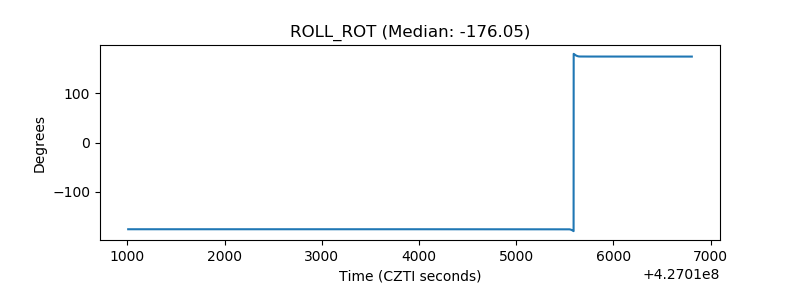 |
| _Roll_DEC | 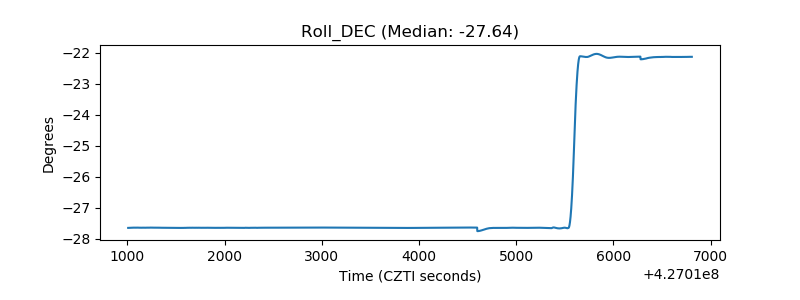 |
| _Roll_RA | 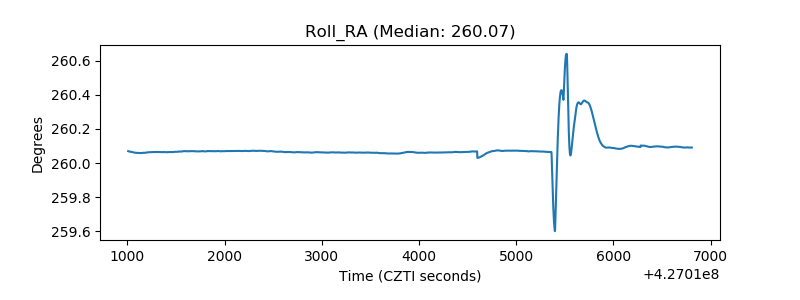 |
| Veto Counter | 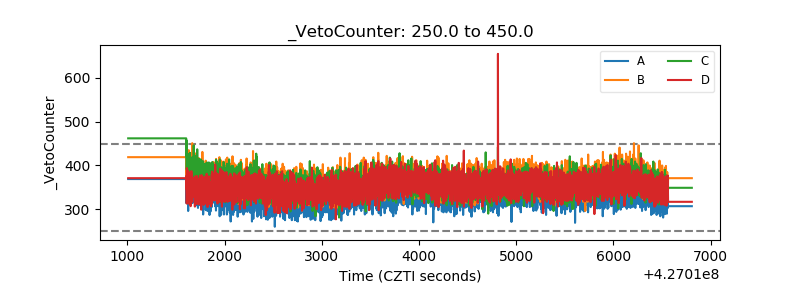 |