| Param | Original file | Final file |
|---|---|---|
| Filename | modeM0/AS1A12_088T20_9000005756_42135cztM0_level2.fits | modeM0/AS1A12_088T20_9000005756_42135cztM0_level2_quad_clean.evt |
| Size (bytes) | 23,555,520 | 6,583,680 |
| Size | 22.5 MB | 6.3 MB |
| Events in quadrant A | 194,534 | 42,484 |
| Events in quadrant B | 203,621 | 43,598 |
| Events in quadrant C | 180,302 | 41,764 |
| Events in quadrant D | 259,762 | 36,829 |
| Mode SS | |||
|---|---|---|---|
| Quadrant | BADHDUFLAG | Total packets | Discarded packets |
| A | 0 | 10 | 0 |
| B | 0 | 10 | 0 |
| C | 0 | 10 | 0 |
| D | 0 | 10 | 0 |
| Mode M9 | |||
|---|---|---|---|
| Quadrant | BADHDUFLAG | Total packets | Discarded packets |
| A | 0 | 3 | 0 |
| B | 0 | 3 | 0 |
| C | 0 | 3 | 0 |
| D | 0 | 3 | 0 |
| Mode M0 | |||
|---|---|---|---|
| Quadrant | BADHDUFLAG | Total packets | Discarded packets |
| A | 0 | 784 | 0 |
| B | 0 | 856 | 0 |
| C | 0 | 775 | 0 |
| D | 0 | 1049 | 0 |
| Quadrant | Total seconds | Saturated seconds | Saturation percentage |
|---|---|---|---|
| A | 386 | 0 | 0.000000% |
| B | 386 | 6 | 1.554404% |
| C | 387 | 0 | 0.000000% |
| D | 387 | 21 | 5.426357% |
Noise dominated data is calculated using 1-second bins in cleaned event files. If a bin has >2000 counts, and if more than 50% of those come from <1% of pixels, then it is considered to be noise-dominated and hence unusable.
| Quadrant | # 1 sec bins | Bins with >0 counts | Bins with >2000 counts | High rate bins dominated by noise | Noise dominated (total time) | Noise dominated (detector-on time) | Marked lightcurve |
|---|---|---|---|---|---|---|---|
| A | 386 | 386 | 0 | 0 | 0.00% | 0.00% | 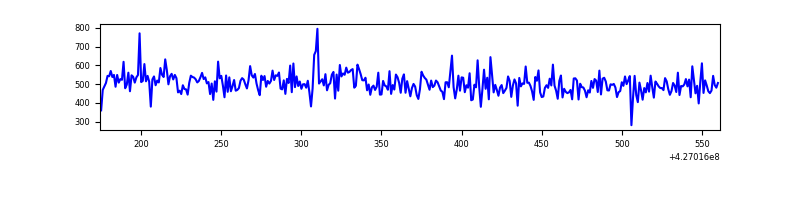 |
| B | 386 | 386 | 5 | 5 | 1.30% | 1.30% | 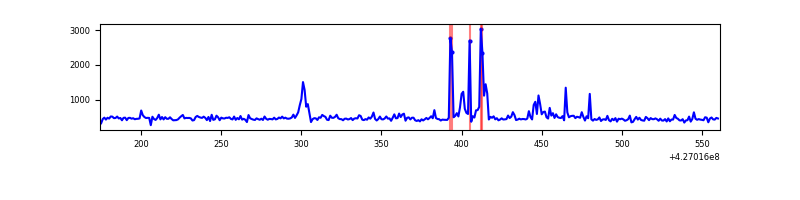 |
| C | 387 | 387 | 0 | 0 | 0.00% | 0.00% | 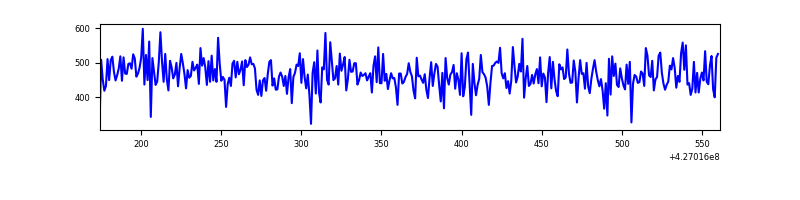 |
| D | 387 | 387 | 21 | 21 | 5.43% | 5.43% | 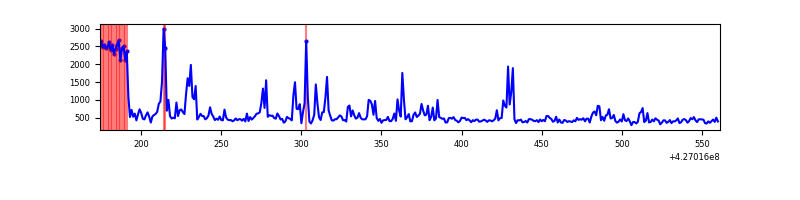 |
Top three noisy pixels from each quadrant. If the there are fewer than three noisy pixels in the level2.evt file, extra rows are filled as -1
| Pixel properties | Quadrant properties | ||||||
|---|---|---|---|---|---|---|---|
| Quadrant | DetID | PixID | Counts | Sigma | Mean | Median | Sigma |
| A | 10 | 83 | 25756 | 2299.12 | 42 | 41 | 11.2 |
| A | 13 | 6 | 1991 | 174.35 | 42 | 41 | 11.2 |
| A | 13 | 248 | 679 | 57.04 | 42 | 41 | 11.2 |
| B | 5 | 255 | 24243 | 2271.45 | 43 | 42 | 10.7 |
| B | 15 | 54 | 6810 | 635.23 | 43 | 42 | 10.7 |
| B | 3 | 112 | 1577 | 144.07 | 43 | 42 | 10.7 |
| C | 15 | 214 | 14967 | 1240.3 | 42 | 42 | 12.0 |
| C | 13 | 61 | 288 | 20.44 | 42 | 42 | 12.0 |
| C | 6 | 66 | 103 | 5.07 | 42 | 42 | 12.0 |
| D | 13 | 249 | 73616 | 6274.52 | 39 | 38 | 11.7 |
| D | 1 | 52 | 27615 | 2351.69 | 39 | 38 | 11.7 |
| D | 2 | 249 | 3469 | 292.59 | 39 | 38 | 11.7 |
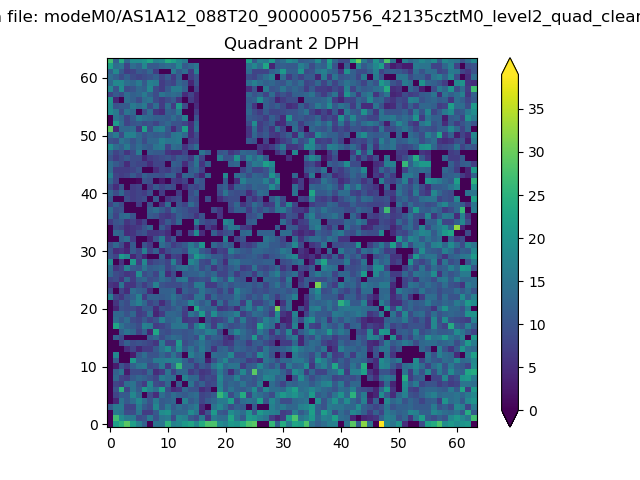
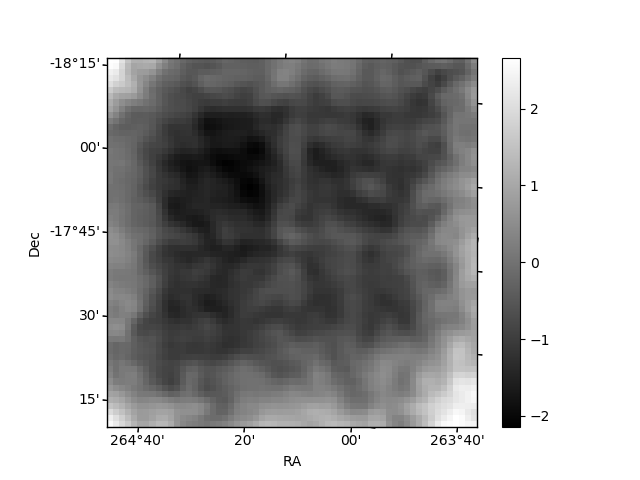
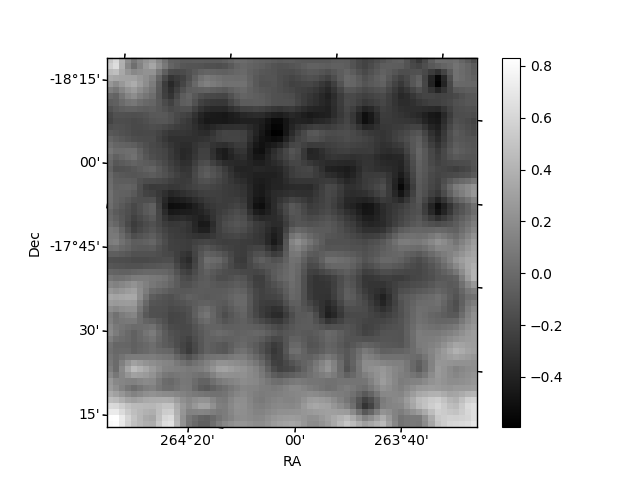
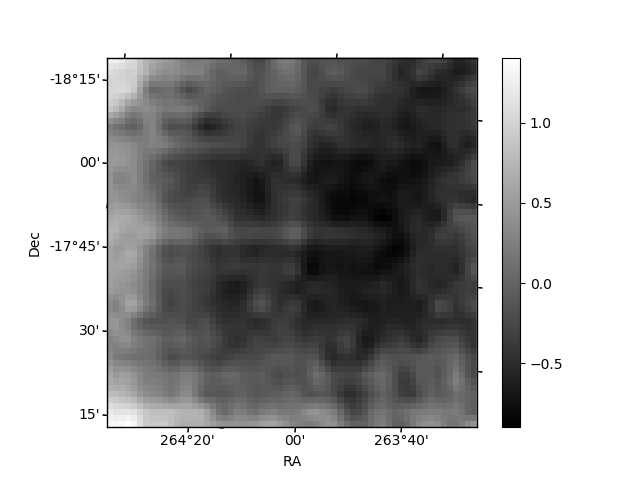
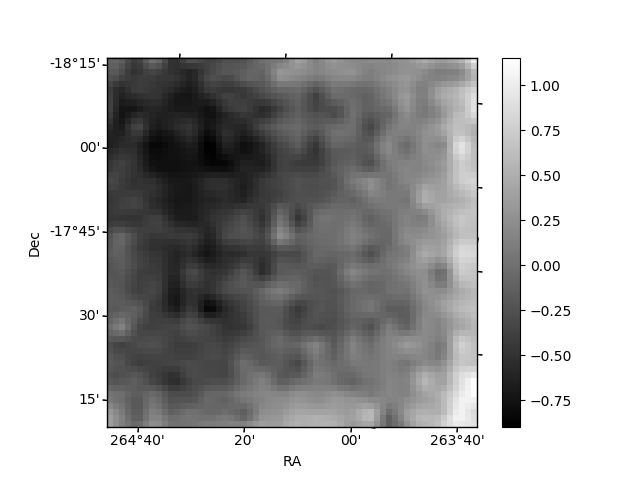
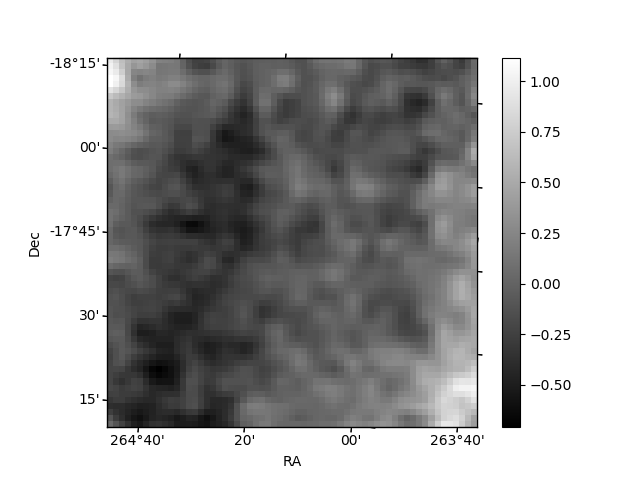
Histogram calculated using DETX and DETY for each event in the final _common_clean file
| Quadrant A | 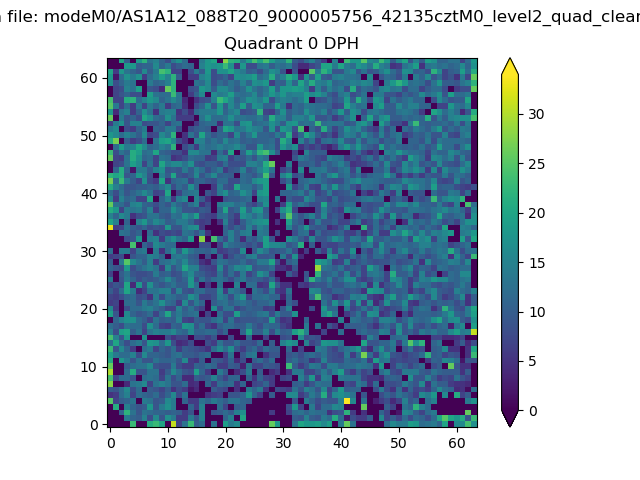 |
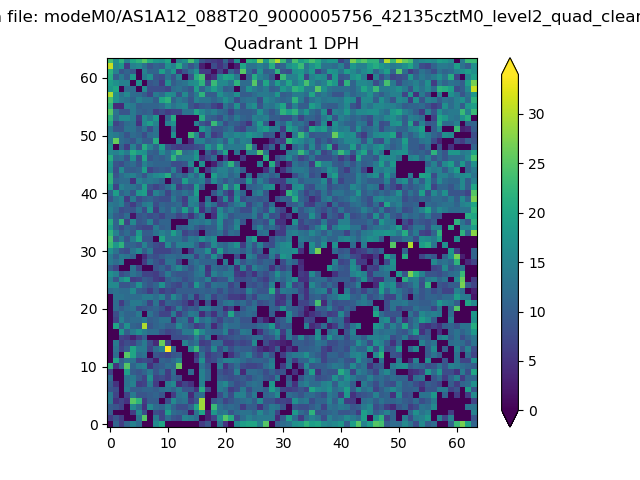 |
Quadrant B |
|---|---|---|---|
| Quadrant D | 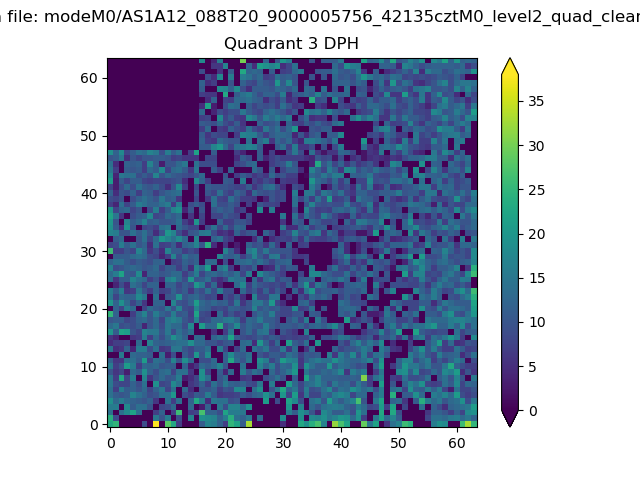 |
 |
Quadrant C |
| Plot type | Count rate plots | Images |
|---|---|---|
| Comparison with Poisson distribution Blue bars denote a histogram of data divided into 1 sec bins. Red curve is a Poisson curve with rate = median count rate of data. |
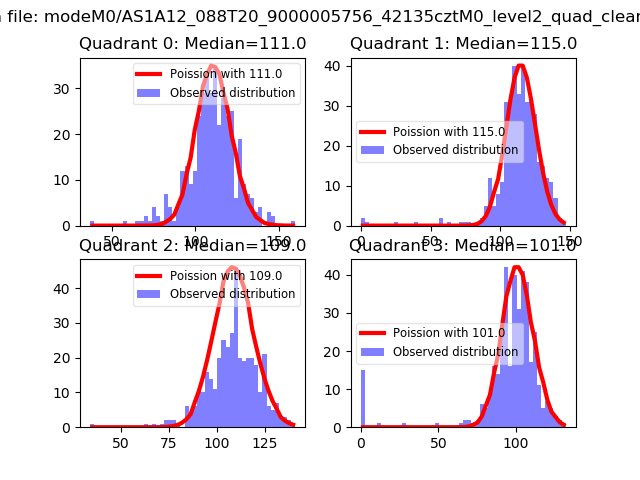 |
 |
| Quadrant-wise count rates Data is divided into 100 sec bins |
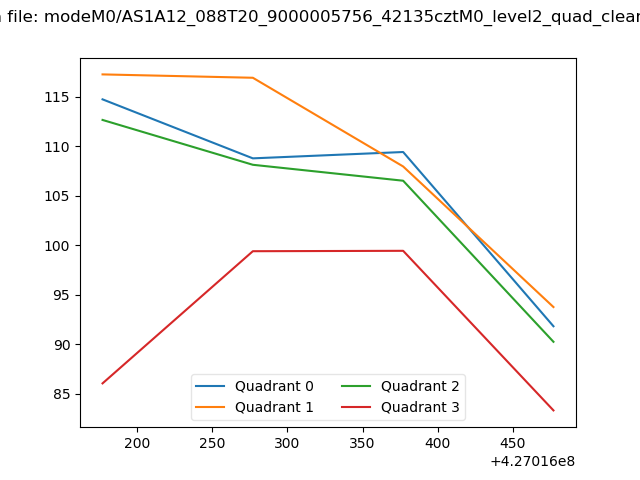 |
|
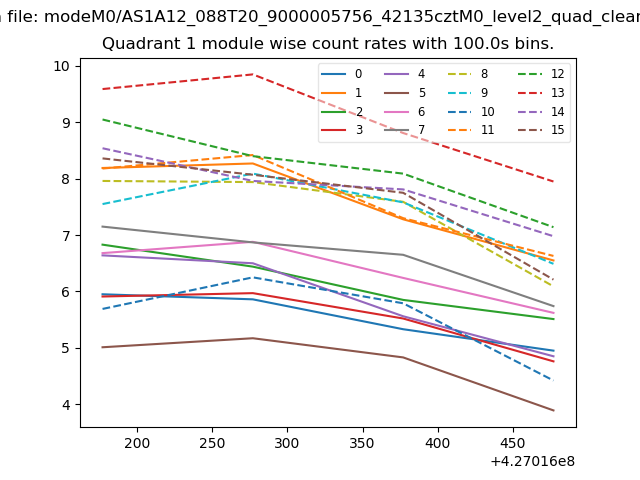
| Module-wise count rates for Quadrant A Data is divided into 100 sec bins |
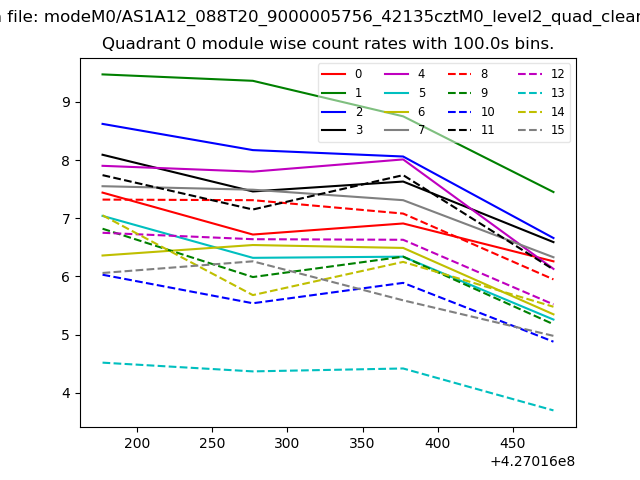 |
 |
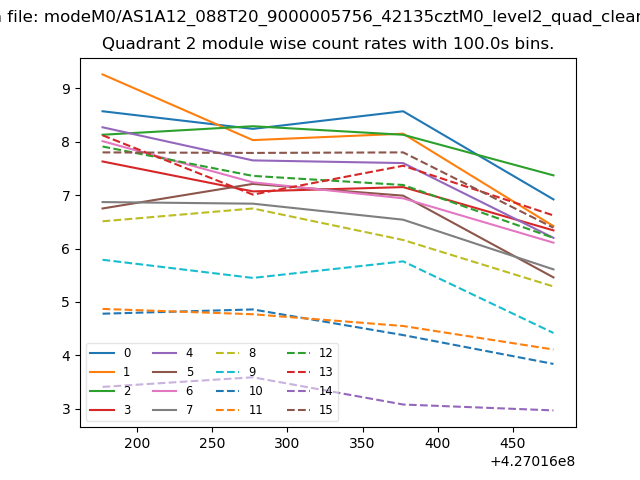
| Module-wise count rates for Quadrant B Data is divided into 100 sec bins |
 |
 |
| Module-wise count rates for Quadrant C Data is divided into 100 sec bins |
 |
 |
| Module-wise count rates for Quadrant D Data is divided into 100 sec bins |
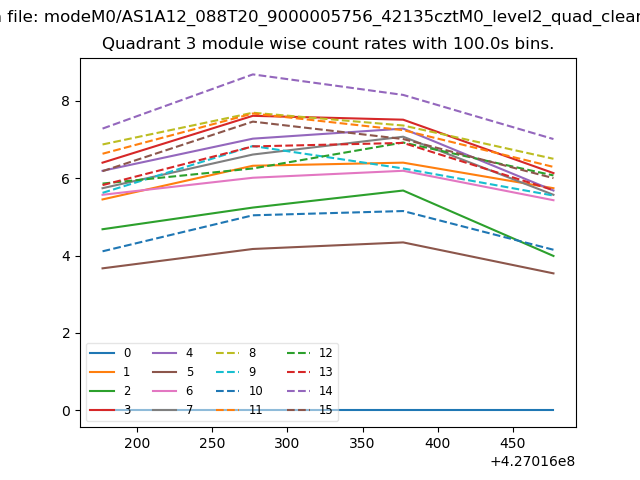 |
 |
| Parameter | Plot |
|---|---|
| CZT HV Monitor | 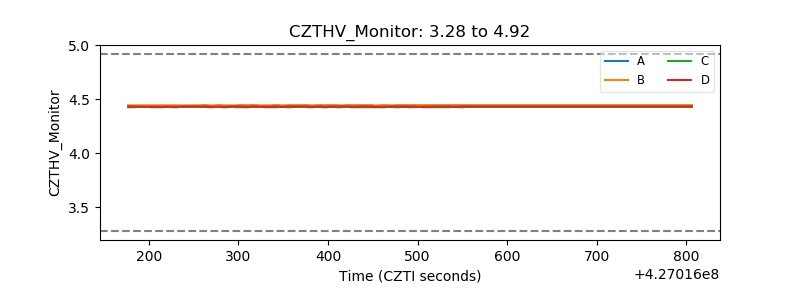 |
| D_VDD | 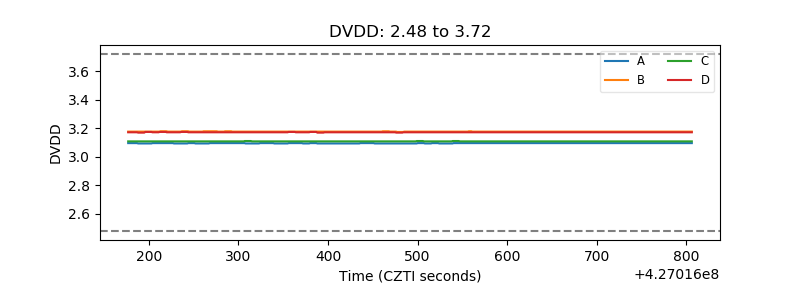 |
| Temperature 1 | 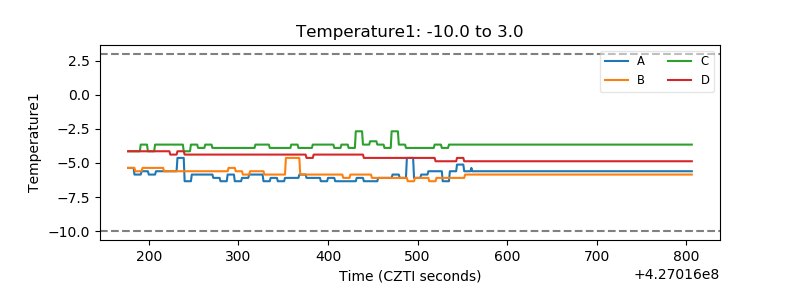 |
| Veto HV Monitor | 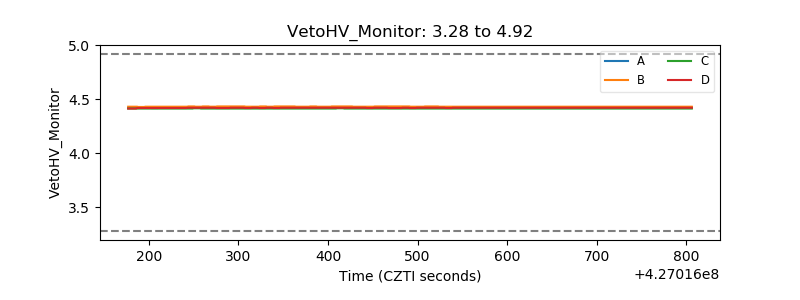 |
| Veto LLD | 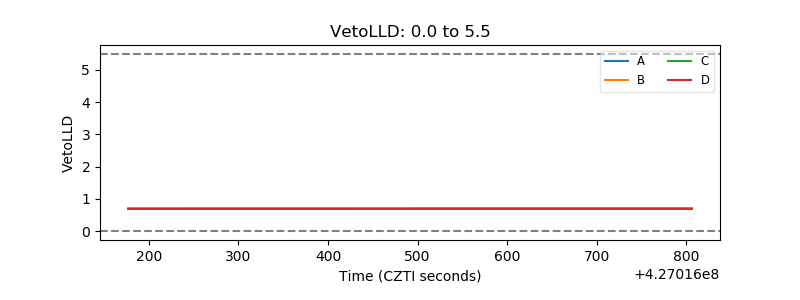 |
| Alpha Counter | 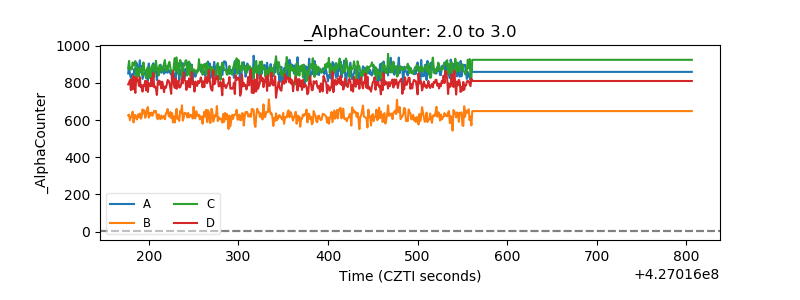 |
| _CPM_Rate | 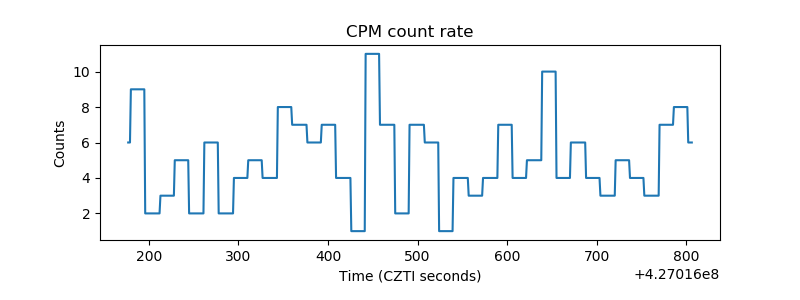 |
| CZT Counter | 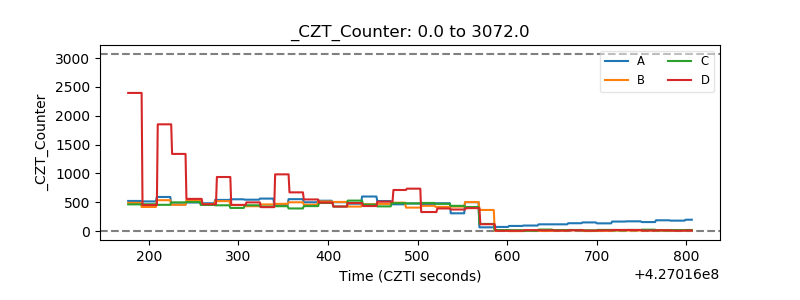 |
| +2.5 Volts monitor | 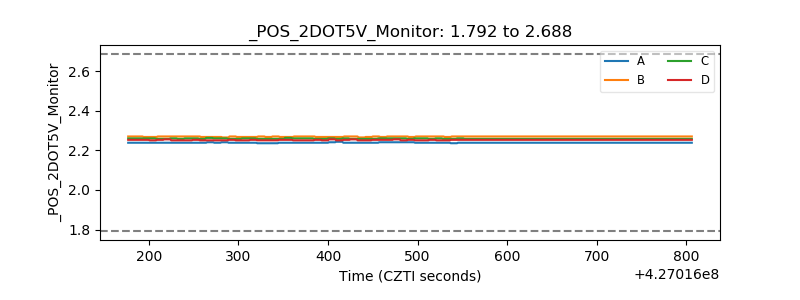 |
| +5 Volts monitor | 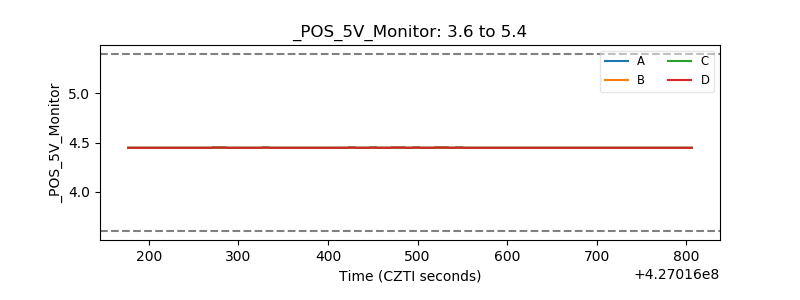 |
| _ROLL_ROT | 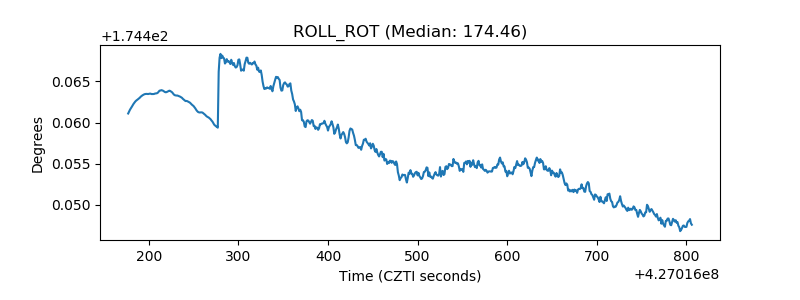 |
| _Roll_DEC | 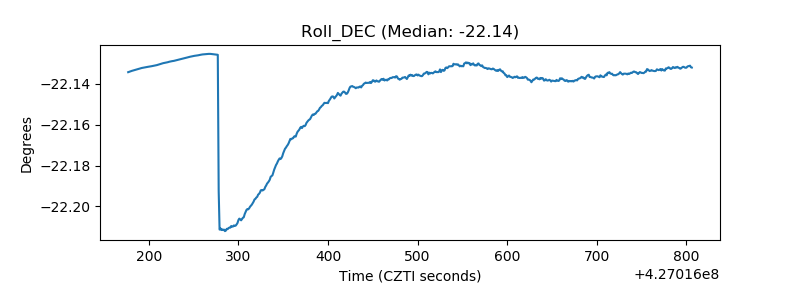 |
| _Roll_RA | 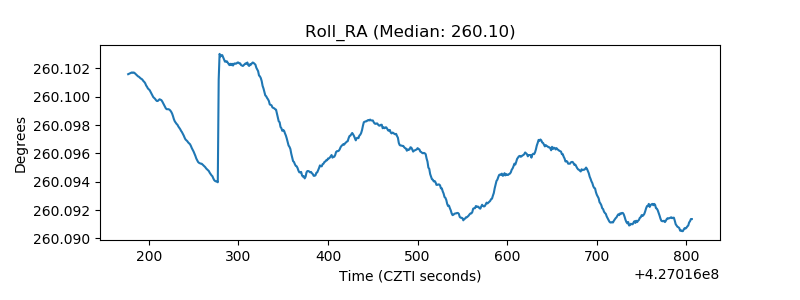 |
| Veto Counter | 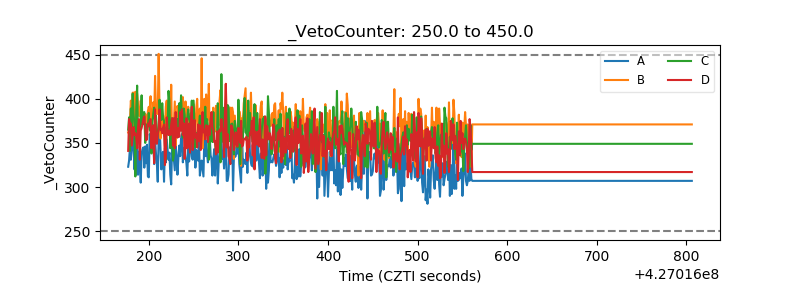 |