| Param | Original file | Final file |
|---|---|---|
| Filename | modeM0/AS1A12_088T22_9000005758_42132cztM0_level2.fits | modeM0/AS1A12_088T22_9000005758_42132cztM0_level2_quad_clean.evt |
| Size (bytes) | 56,188,800 | 15,266,880 |
| Size | 53.6 MB | 14.6 MB |
| Events in quadrant A | 560,528 | 99,777 |
| Events in quadrant B | 434,315 | 105,514 |
| Events in quadrant C | 450,241 | 96,156 |
| Events in quadrant D | 557,578 | 87,726 |
| Mode M9 | |||
|---|---|---|---|
| Quadrant | BADHDUFLAG | Total packets | Discarded packets |
| A | 0 | 6 | 0 |
| B | 0 | 6 | 0 |
| C | 0 | 6 | 0 |
| D | 0 | 6 | 0 |
| Mode SS | |||
|---|---|---|---|
| Quadrant | BADHDUFLAG | Total packets | Discarded packets |
| A | 0 | 18 | 0 |
| B | 0 | 18 | 0 |
| C | 0 | 18 | 0 |
| D | 0 | 18 | 0 |
| Mode M0 | |||
|---|---|---|---|
| Quadrant | BADHDUFLAG | Total packets | Discarded packets |
| A | 0 | 2229 | 1 |
| B | 0 | 1930 | 1 |
| C | 0 | 1911 | 1 |
| D | 0 | 2342 | 1 |
| Quadrant | Total seconds | Saturated seconds | Saturation percentage |
|---|---|---|---|
| A | 950 | 3 | 0.315789% |
| B | 950 | 1 | 0.105263% |
| C | 950 | 1 | 0.105263% |
| D | 950 | 29 | 3.052632% |
Noise dominated data is calculated using 1-second bins in cleaned event files. If a bin has >2000 counts, and if more than 50% of those come from <1% of pixels, then it is considered to be noise-dominated and hence unusable.
| Quadrant | # 1 sec bins | Bins with >0 counts | Bins with >2000 counts | High rate bins dominated by noise | Noise dominated (total time) | Noise dominated (detector-on time) | Marked lightcurve |
|---|---|---|---|---|---|---|---|
| A | 950 | 950 | 1 | 1 | 0.11% | 0.11% | 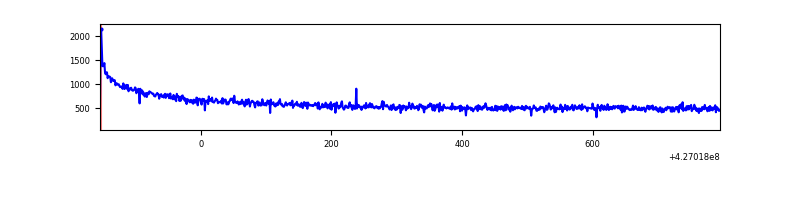 |
| B | 950 | 950 | 0 | 0 | 0.00% | 0.00% | 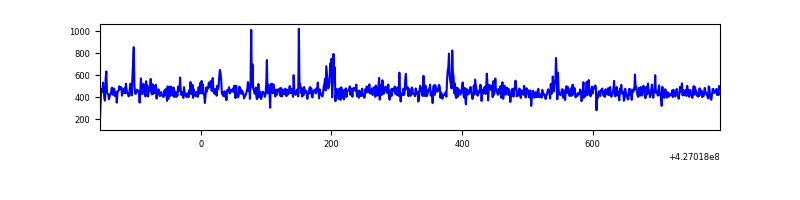 |
| C | 950 | 950 | 0 | 0 | 0.00% | 0.00% | 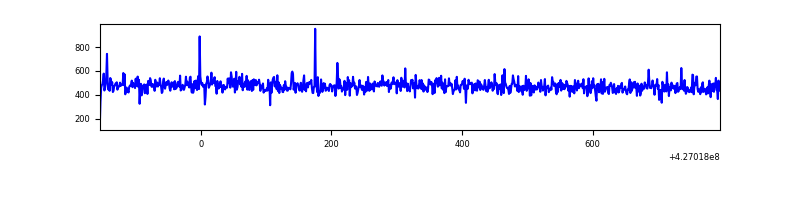 |
| D | 950 | 950 | 24 | 24 | 2.53% | 2.53% | 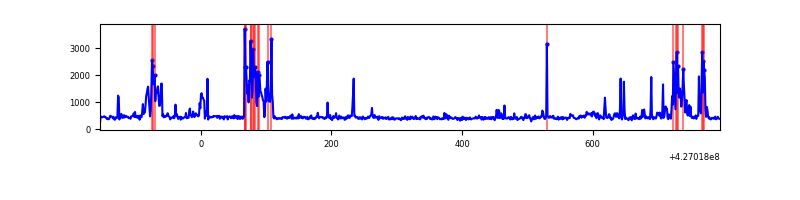 |
Top three noisy pixels from each quadrant. If the there are fewer than three noisy pixels in the level2.evt file, extra rows are filled as -1
| Pixel properties | Quadrant properties | ||||||
|---|---|---|---|---|---|---|---|
| Quadrant | DetID | PixID | Counts | Sigma | Mean | Median | Sigma |
| A | 10 | 83 | 155805 | 6566.43 | 104 | 102 | 23.7 |
| A | 10 | 67 | 1511 | 59.42 | 104 | 102 | 23.7 |
| A | 3 | 137 | 1277 | 49.55 | 104 | 102 | 23.7 |
| B | 5 | 255 | 13060 | 569.52 | 105 | 102 | 22.8 |
| B | 0 | 229 | 5100 | 219.67 | 105 | 102 | 22.8 |
| B | 12 | 111 | 2728 | 115.42 | 105 | 102 | 22.8 |
| C | 15 | 214 | 44192 | 1691.97 | 103 | 103 | 26.1 |
| C | 12 | 249 | 1750 | 63.21 | 103 | 103 | 26.1 |
| C | 13 | 61 | 727 | 23.95 | 103 | 103 | 26.1 |
| D | 13 | 249 | 99795 | 3738.48 | 99 | 96 | 26.7 |
| D | 12 | 6 | 53172 | 1990.23 | 99 | 96 | 26.7 |
| D | 2 | 249 | 15308 | 570.41 | 99 | 96 | 26.7 |
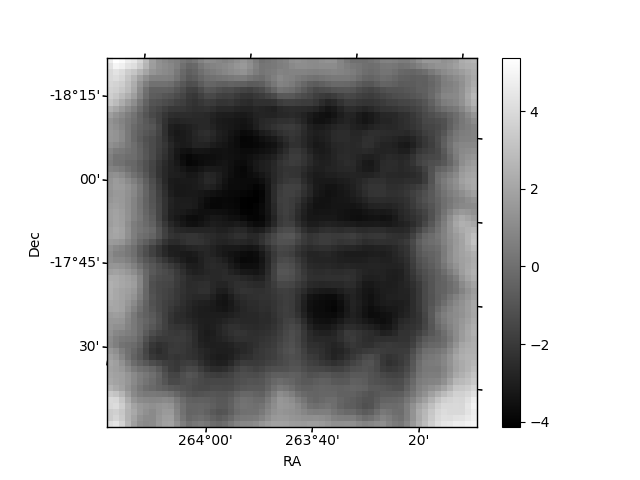
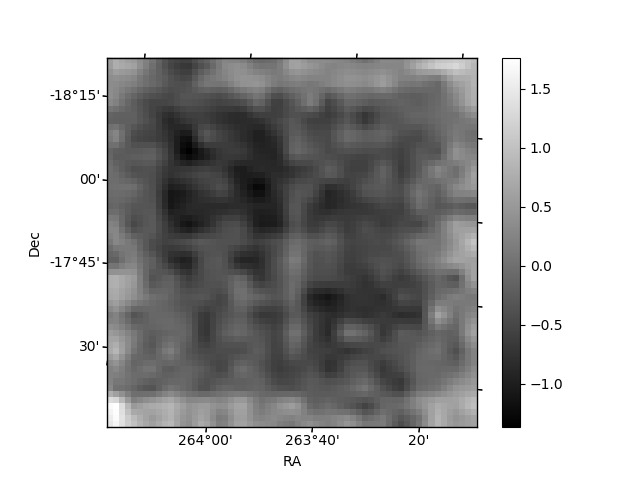
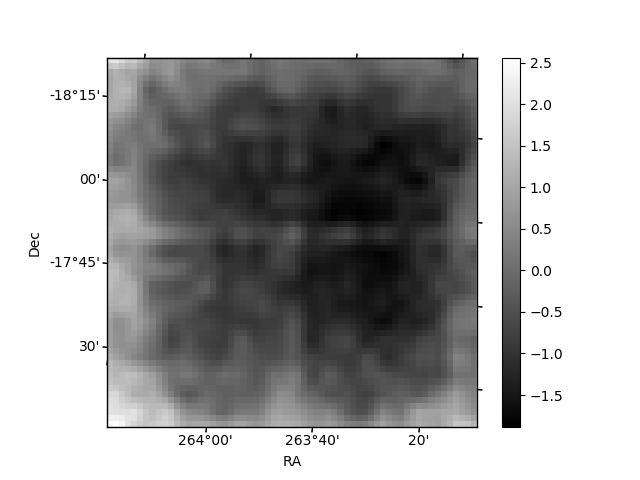
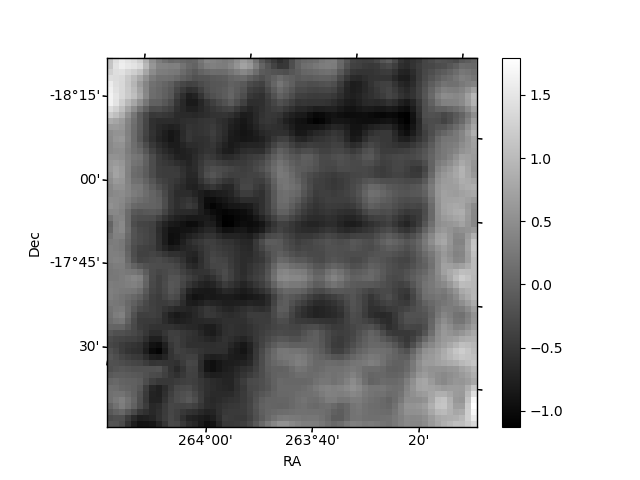
Histogram calculated using DETX and DETY for each event in the final _common_clean file
| Quadrant A | 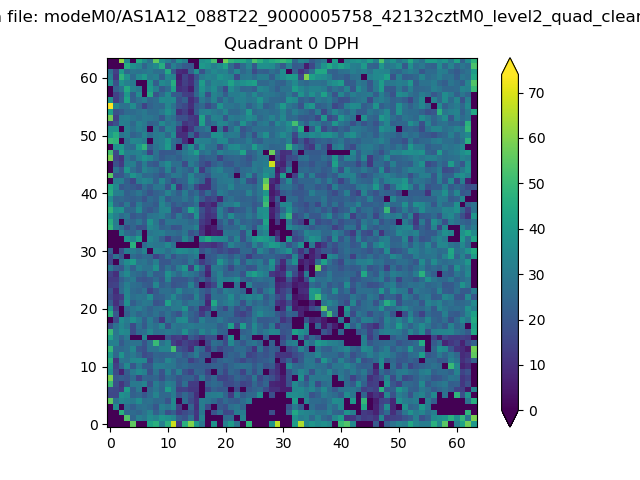 |
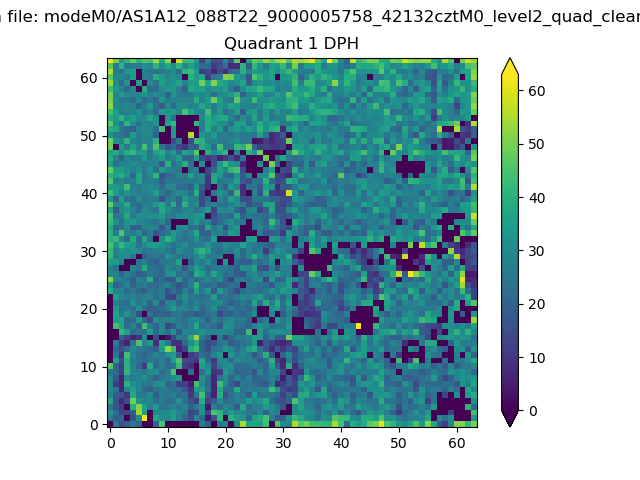 |
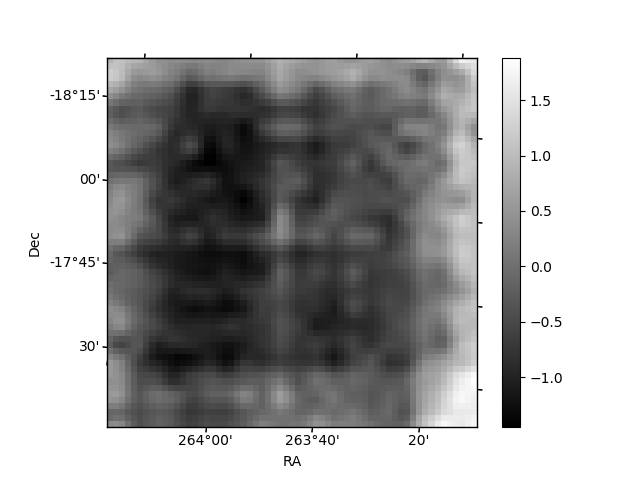
Quadrant B |
|---|---|---|---|
| Quadrant D | 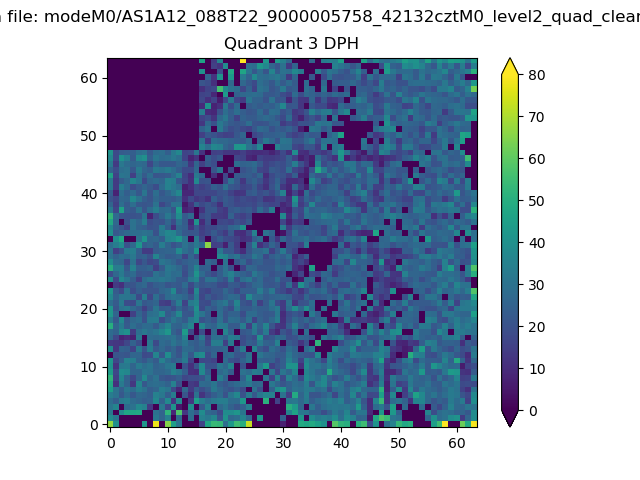 |
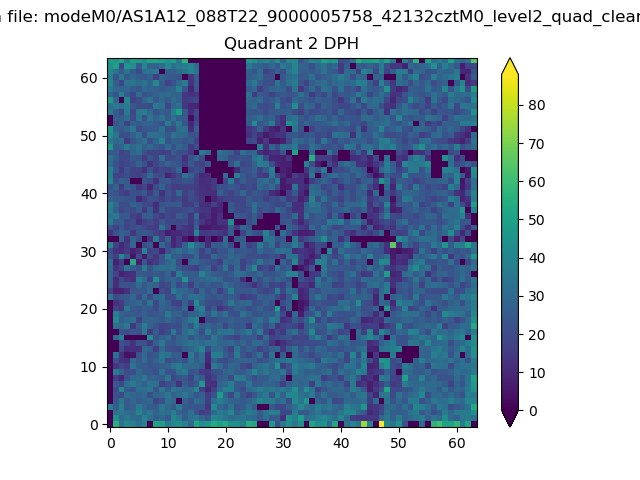 |
Quadrant C |
| Plot type | Count rate plots | Images |
|---|---|---|
| Comparison with Poisson distribution Blue bars denote a histogram of data divided into 1 sec bins. Red curve is a Poisson curve with rate = median count rate of data. |
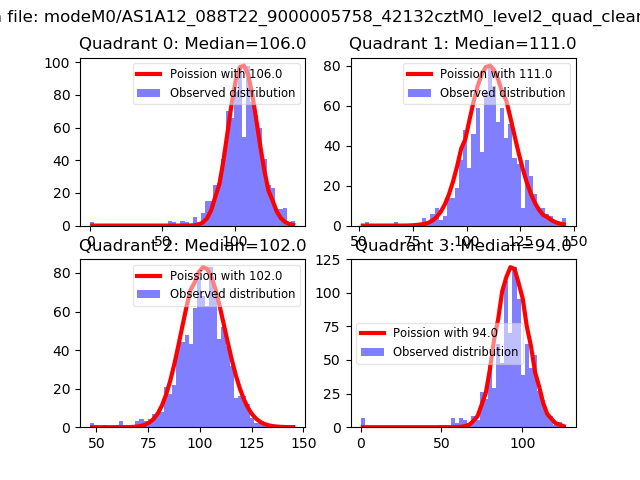 |
 |
| Quadrant-wise count rates Data is divided into 100 sec bins |
 |
|
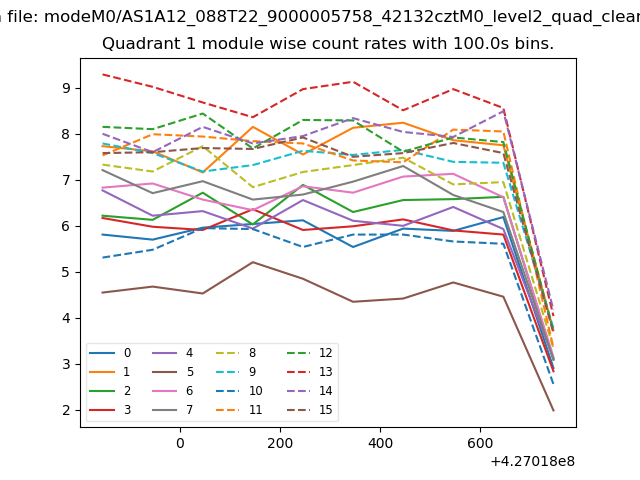
| Module-wise count rates for Quadrant A Data is divided into 100 sec bins |
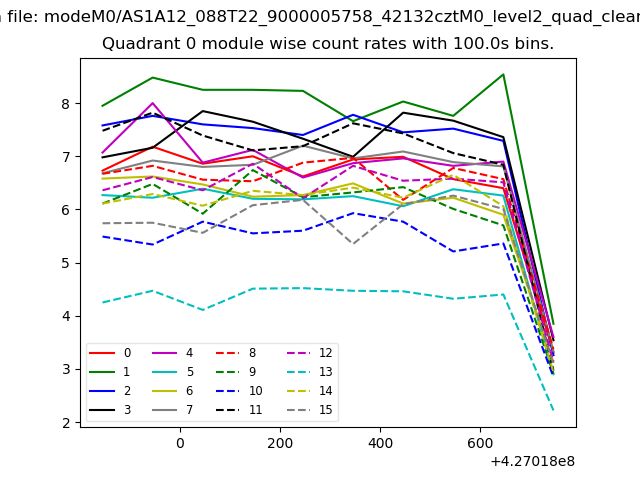 |
 |
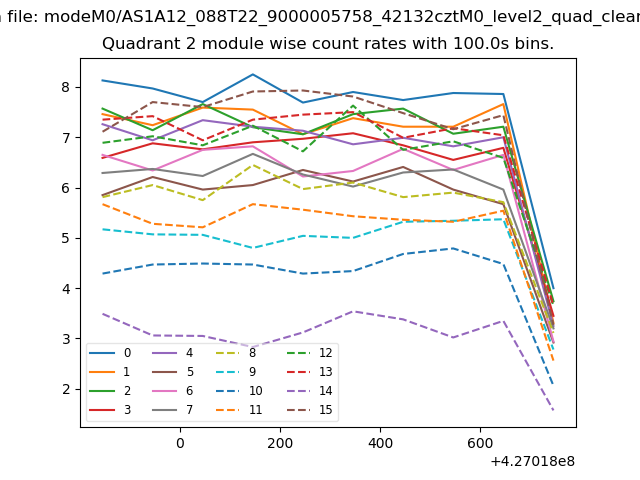
| Module-wise count rates for Quadrant B Data is divided into 100 sec bins |
 |
 |
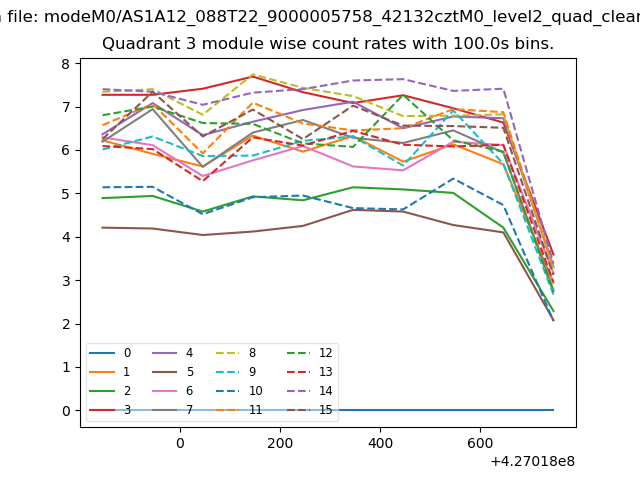
| Module-wise count rates for Quadrant C Data is divided into 100 sec bins |
 |
 |
| Module-wise count rates for Quadrant D Data is divided into 100 sec bins |
 |
 |
| Parameter | Plot |
|---|---|
| CZT HV Monitor | 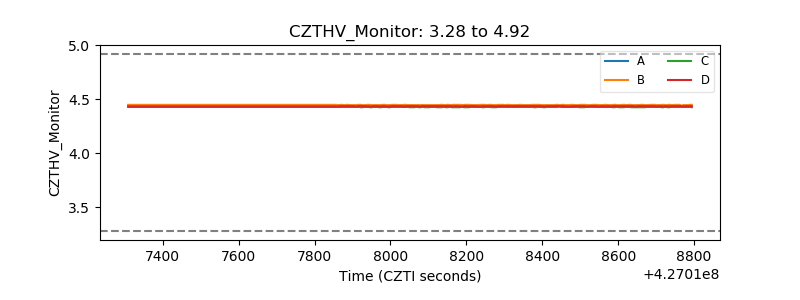 |
| D_VDD | 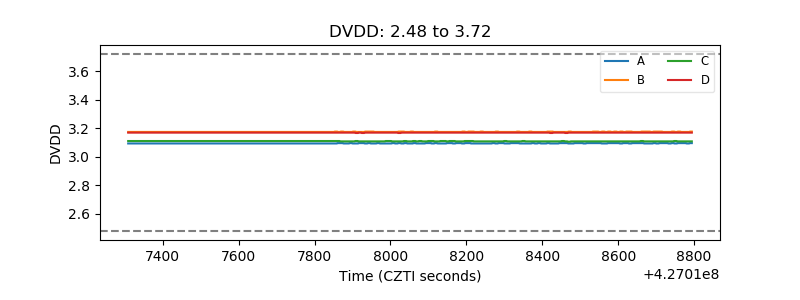 |
| Temperature 1 | 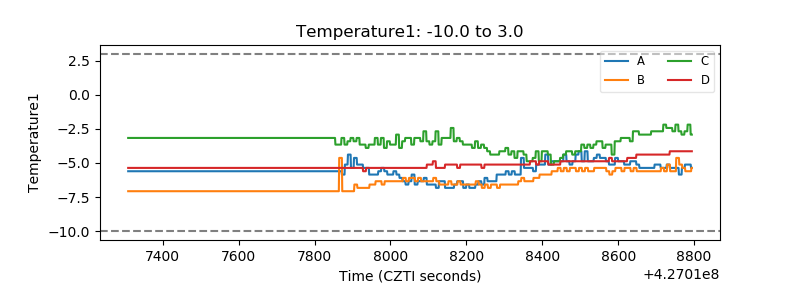 |
| Veto HV Monitor | 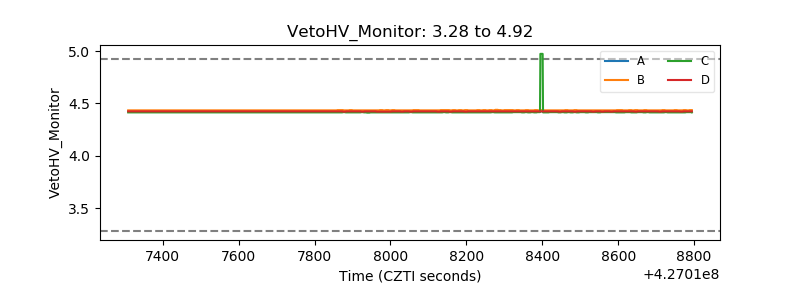 |
| Veto LLD | 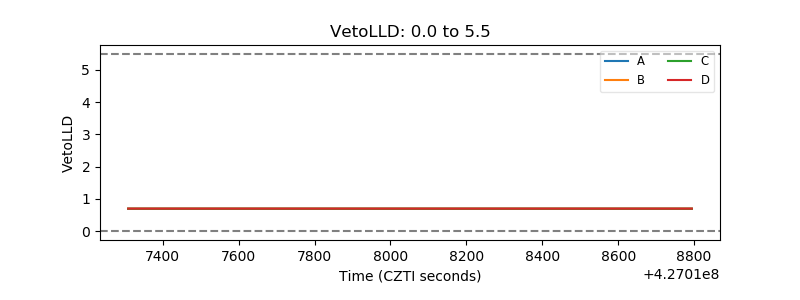 |
| Alpha Counter | 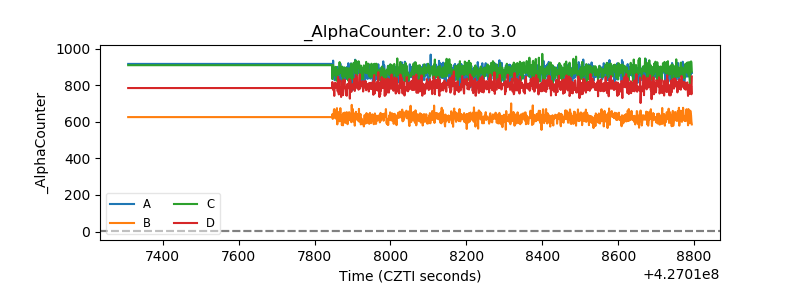 |
| _CPM_Rate | 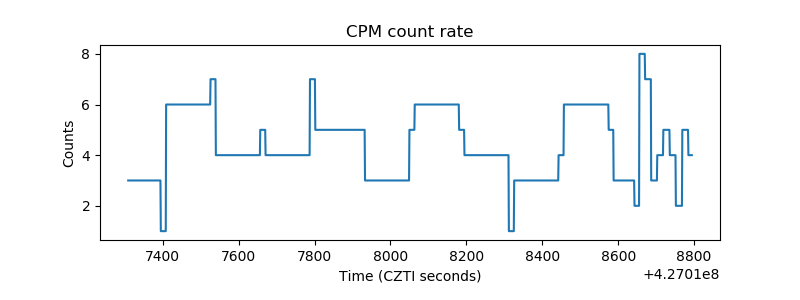 |
| CZT Counter | 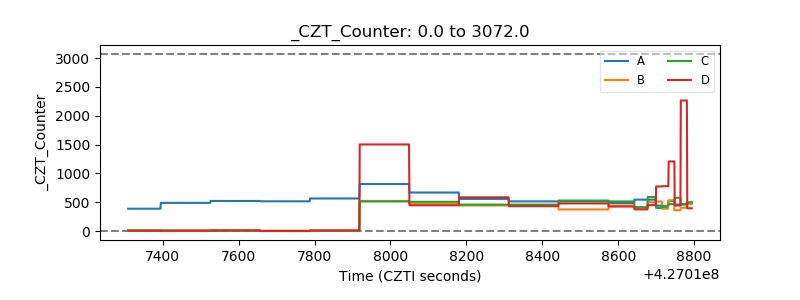 |
| +2.5 Volts monitor | 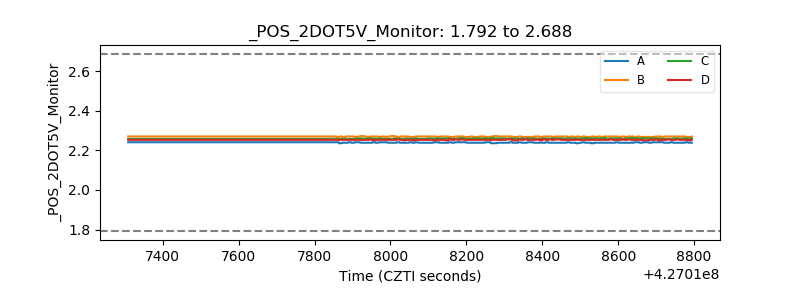 |
| +5 Volts monitor | 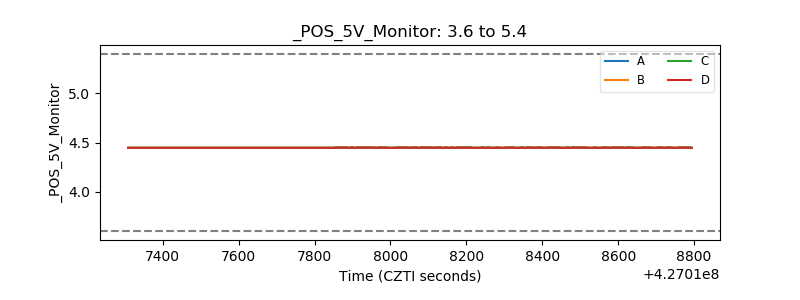 |
| _ROLL_ROT | 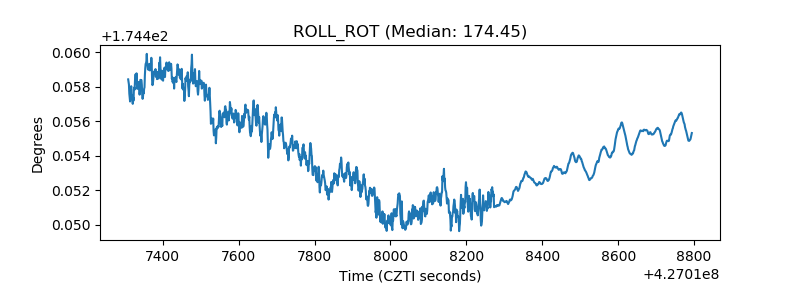 |
| _Roll_DEC | 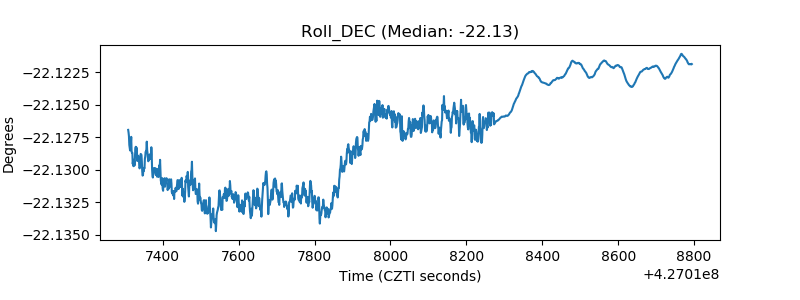 |
| _Roll_RA | 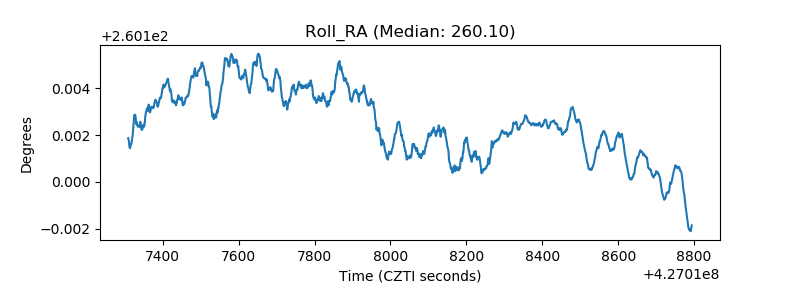 |
| Veto Counter | 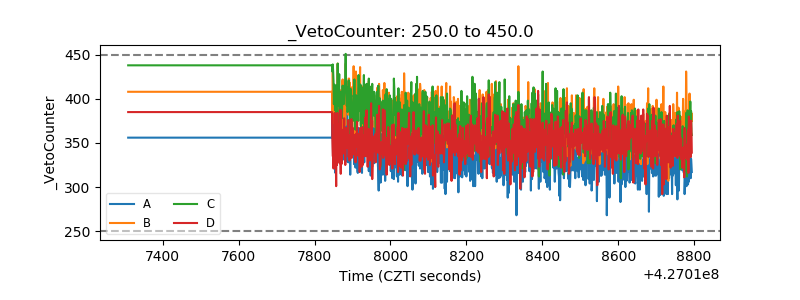 |