| Param | Original file | Final file |
|---|---|---|
| Filename | modeM0/AS1A12_088T22_9000005758_42135cztM0_level2.fits | modeM0/AS1A12_088T22_9000005758_42135cztM0_level2_quad_clean.evt |
| Size (bytes) | 344,064,960 | 79,444,800 |
| Size | 328.1 MB | 75.8 MB |
| Events in quadrant A | 3,225,539 | 542,679 |
| Events in quadrant B | 2,308,414 | 565,670 |
| Events in quadrant C | 2,303,052 | 529,291 |
| Events in quadrant D | 4,512,739 | 420,283 |
| Mode M9 | |||
|---|---|---|---|
| Quadrant | BADHDUFLAG | Total packets | Discarded packets |
| A | 0 | 10 | 0 |
| B | 0 | 10 | 0 |
| C | 0 | 10 | 0 |
| D | 0 | 10 | 0 |
| Mode SS | |||
|---|---|---|---|
| Quadrant | BADHDUFLAG | Total packets | Discarded packets |
| A | 0 | 100 | 0 |
| B | 0 | 100 | 0 |
| C | 0 | 100 | 0 |
| D | 0 | 100 | 0 |
| Mode M0 | |||
|---|---|---|---|
| Quadrant | BADHDUFLAG | Total packets | Discarded packets |
| A | 0 | 12456 | 1 |
| B | 0 | 10161 | 1 |
| C | 0 | 9951 | 1 |
| D | 0 | 16808 | 1 |
| Quadrant | Total seconds | Saturated seconds | Saturation percentage |
|---|---|---|---|
| A | 4958 | 12 | 0.242033% |
| B | 4958 | 2 | 0.040339% |
| C | 4958 | 2 | 0.040339% |
| D | 4958 | 738 | 14.885034% |
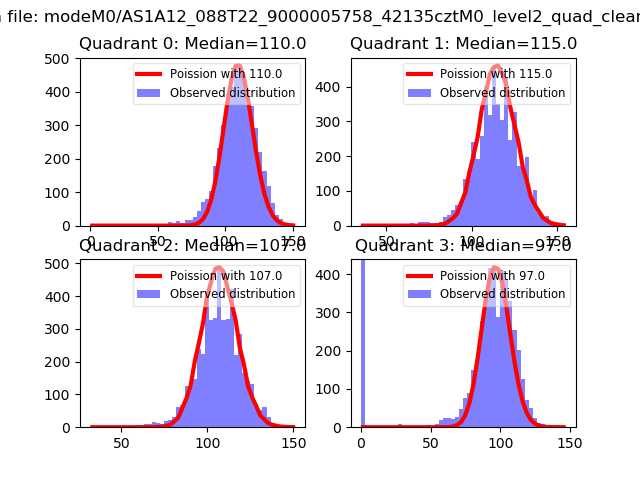
Noise dominated data is calculated using 1-second bins in cleaned event files. If a bin has >2000 counts, and if more than 50% of those come from <1% of pixels, then it is considered to be noise-dominated and hence unusable.
| Quadrant | # 1 sec bins | Bins with >0 counts | Bins with >2000 counts | High rate bins dominated by noise | Noise dominated (total time) | Noise dominated (detector-on time) | Marked lightcurve |
|---|---|---|---|---|---|---|---|
| A | 4958 | 4958 | 1 | 1 | 0.02% | 0.02% | 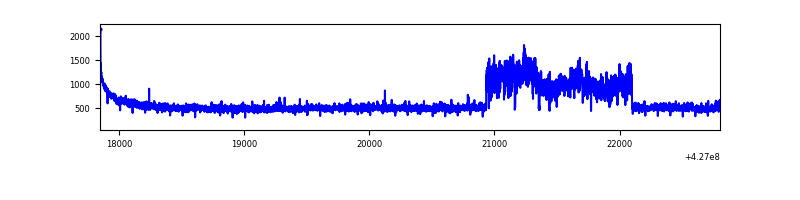 |
| B | 4958 | 4958 | 0 | 0 | 0.00% | 0.00% | 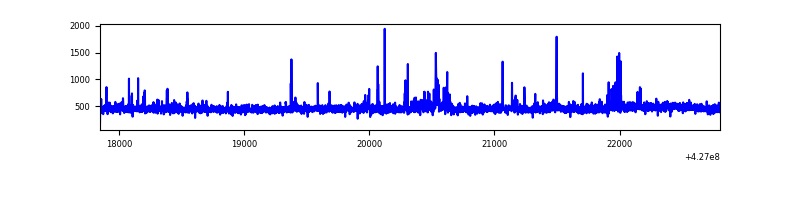 |
| C | 4958 | 4958 | 0 | 0 | 0.00% | 0.00% | 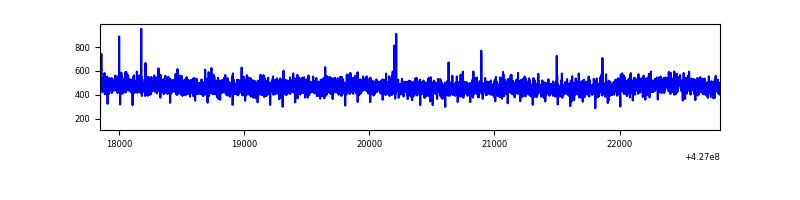 |
| D | 4958 | 4958 | 650 | 650 | 13.11% | 13.11% | 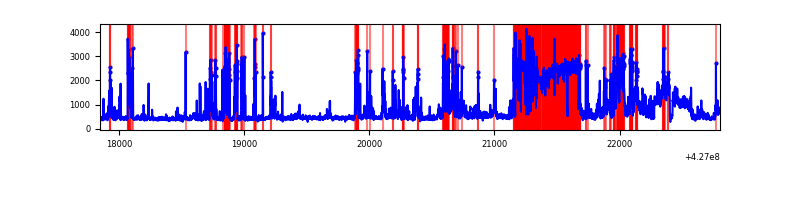 |
Top three noisy pixels from each quadrant. If the there are fewer than three noisy pixels in the level2.evt file, extra rows are filled as -1
| Pixel properties | Quadrant properties | ||||||
|---|---|---|---|---|---|---|---|
| Quadrant | DetID | PixID | Counts | Sigma | Mean | Median | Sigma |
| A | 15 | 223 | 651221 | 5608.13 | 555 | 543 | 116.0 |
| A | 10 | 83 | 430334 | 3704.32 | 555 | 543 | 116.0 |
| A | 3 | 137 | 6332 | 49.89 | 555 | 543 | 116.0 |
| B | 5 | 255 | 36410 | 324.79 | 551 | 535 | 110.5 |
| B | 3 | 112 | 28151 | 250.02 | 551 | 535 | 110.5 |
| B | 0 | 229 | 26451 | 234.62 | 551 | 535 | 110.5 |
| C | 15 | 214 | 202042 | 1573.85 | 537 | 540 | 128.0 |
| C | 12 | 249 | 4815 | 33.39 | 537 | 540 | 128.0 |
| C | 13 | 61 | 3591 | 23.83 | 537 | 540 | 128.0 |
| D | 13 | 249 | 1629383 | 13459.66 | 487 | 473 | 121.0 |
| D | 1 | 52 | 425559 | 3512.48 | 487 | 473 | 121.0 |
| D | 12 | 6 | 218834 | 1804.31 | 487 | 473 | 121.0 |
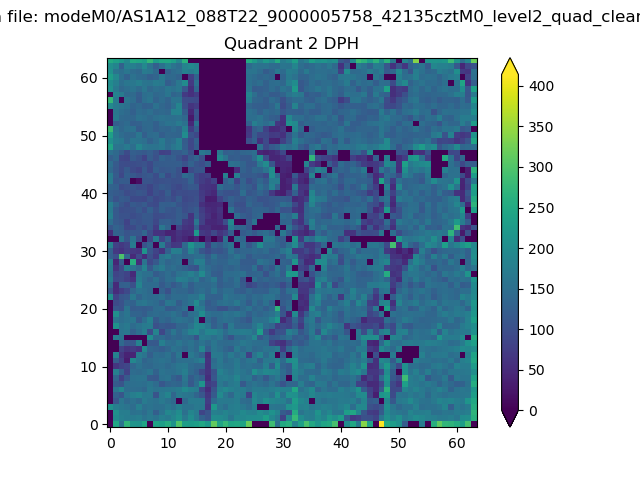
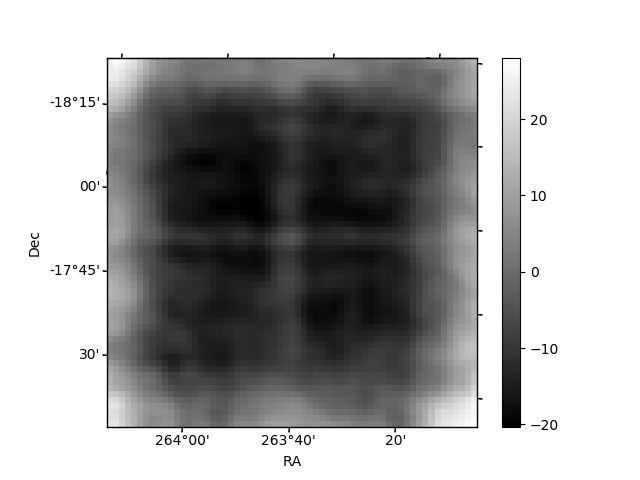
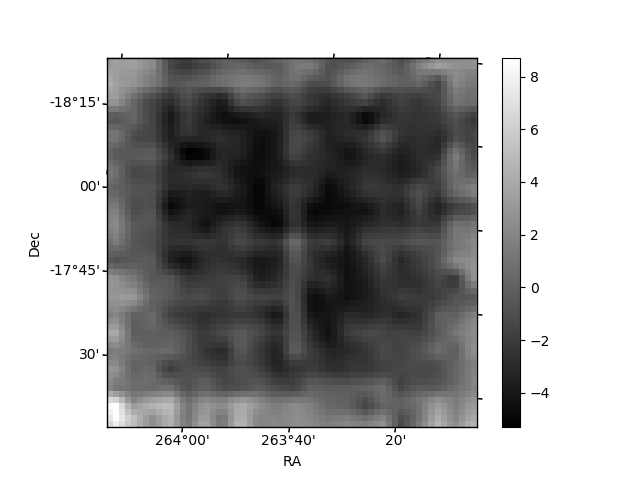
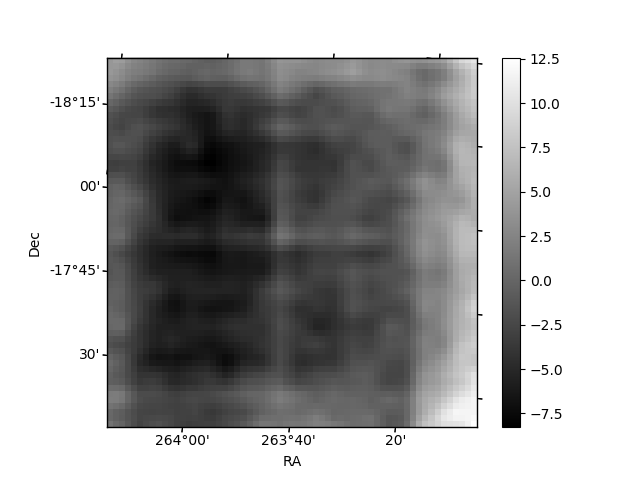
Histogram calculated using DETX and DETY for each event in the final _common_clean file
| Quadrant A | 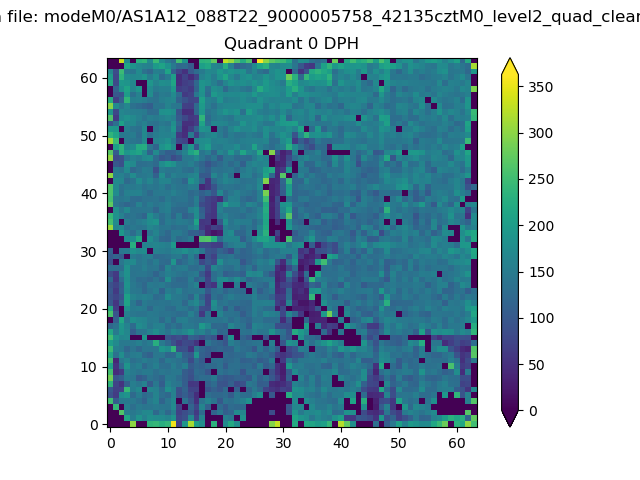 |
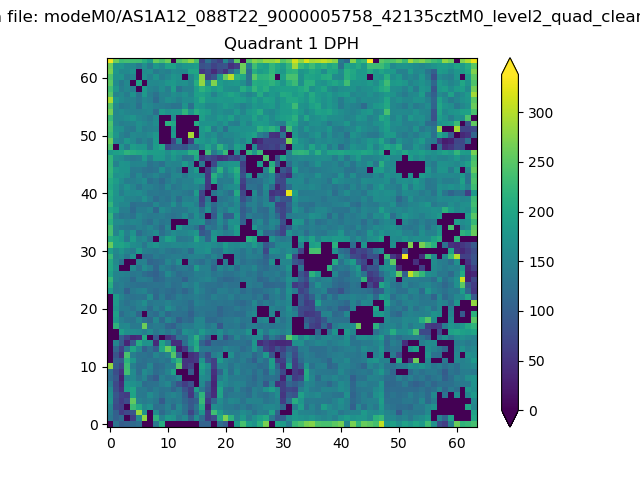 |
Quadrant B |
|---|---|---|---|
| Quadrant D | 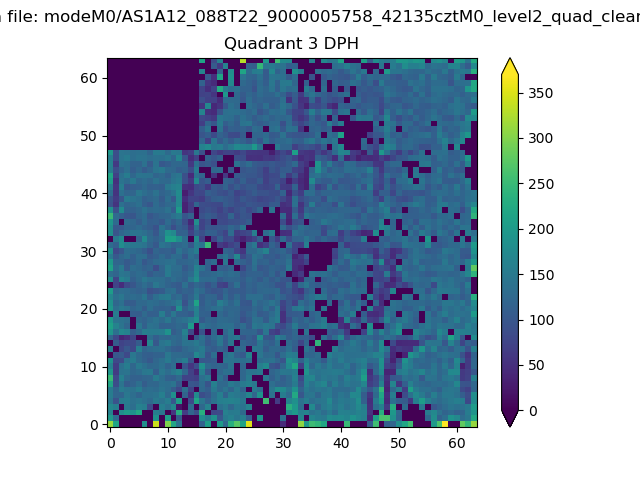 |
 |
Quadrant C |
| Plot type | Count rate plots | Images |
|---|---|---|
| Comparison with Poisson distribution Blue bars denote a histogram of data divided into 1 sec bins. Red curve is a Poisson curve with rate = median count rate of data. |
 |
 |
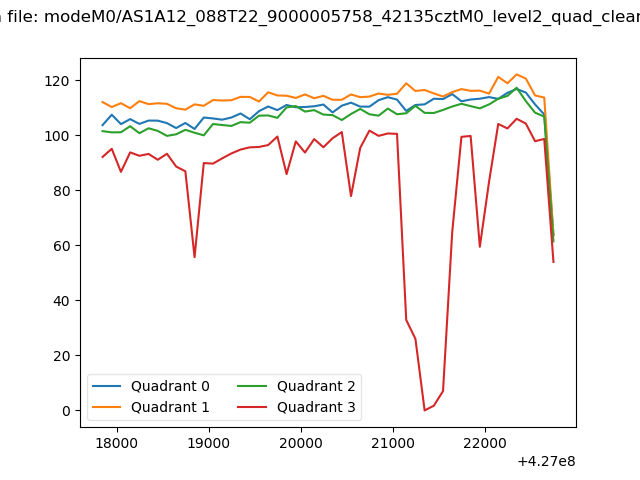
| Quadrant-wise count rates Data is divided into 100 sec bins |
 |
|
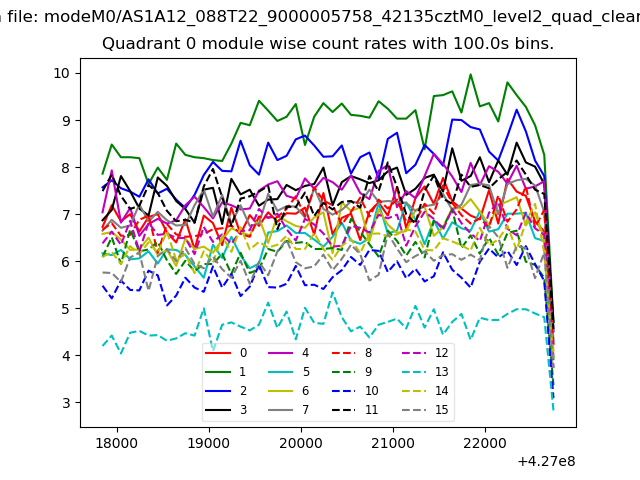
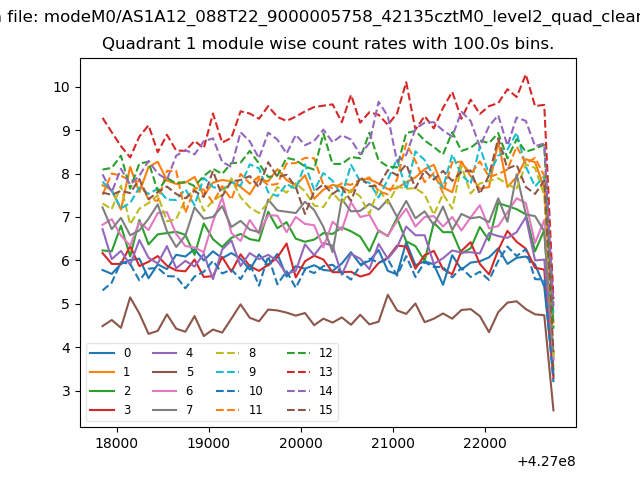
| Module-wise count rates for Quadrant A Data is divided into 100 sec bins |
 |
 |
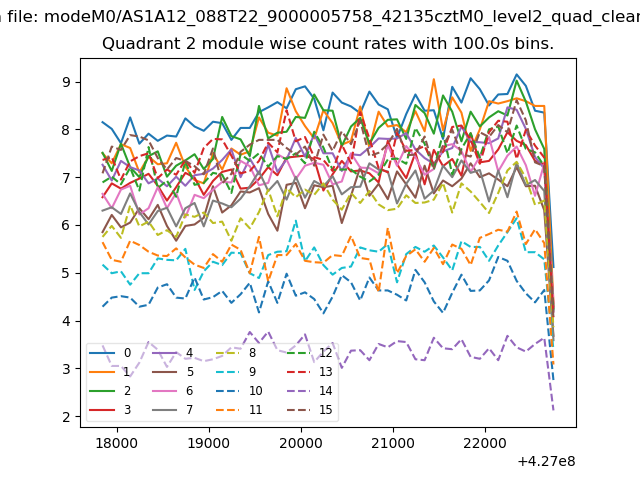
| Module-wise count rates for Quadrant B Data is divided into 100 sec bins |
 |
 |
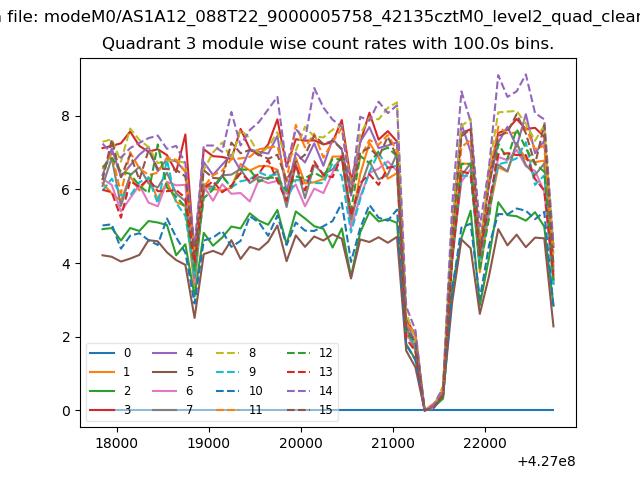
| Module-wise count rates for Quadrant C Data is divided into 100 sec bins |
 |
 |
| Module-wise count rates for Quadrant D Data is divided into 100 sec bins |
 |
 |
| Parameter | Plot |
|---|---|
| CZT HV Monitor | 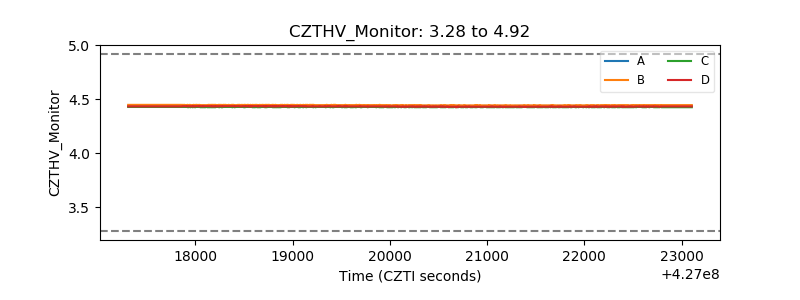 |
| D_VDD | 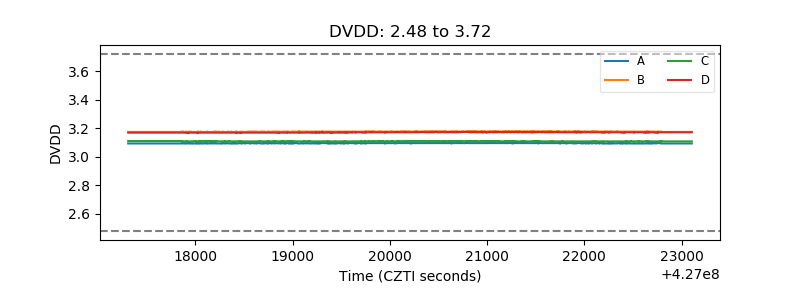 |
| Temperature 1 | 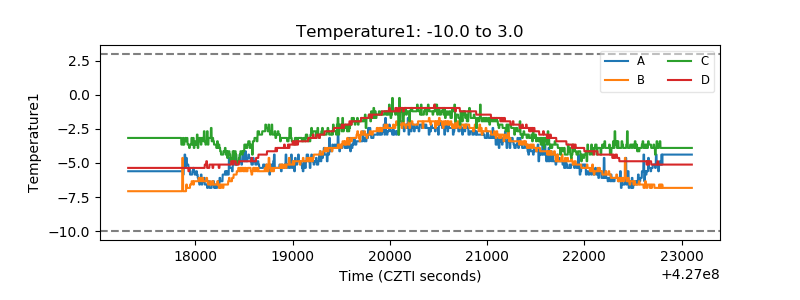 |
| Veto HV Monitor | 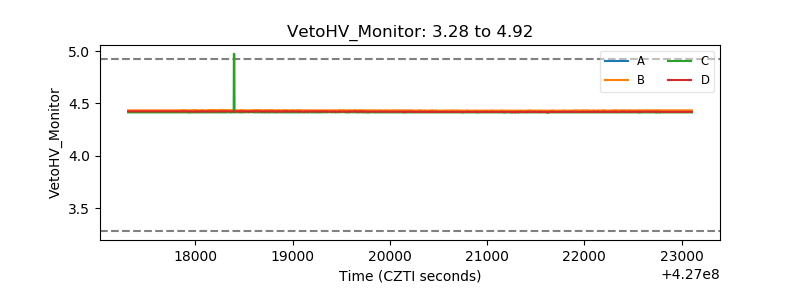 |
| Veto LLD | 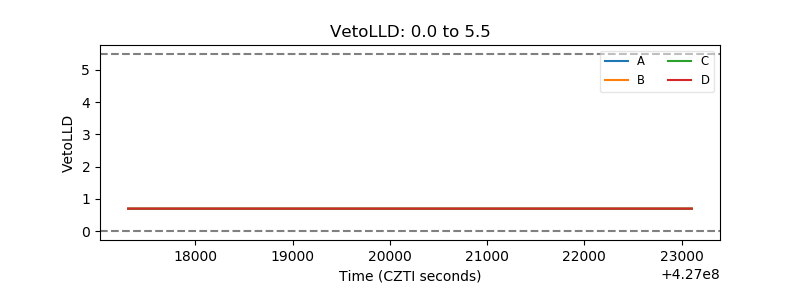 |
| Alpha Counter | 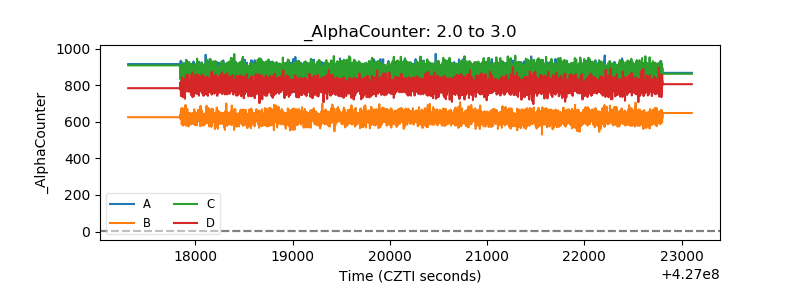 |
| _CPM_Rate | 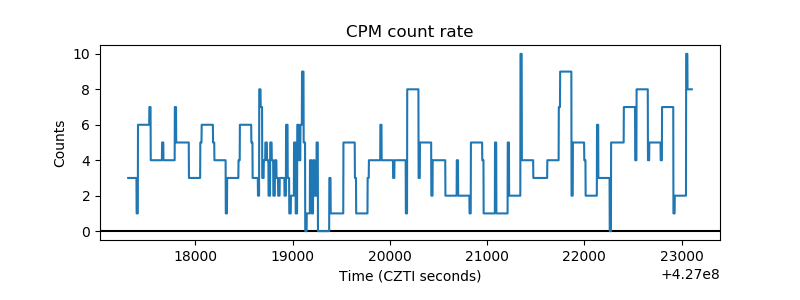 |
| CZT Counter | 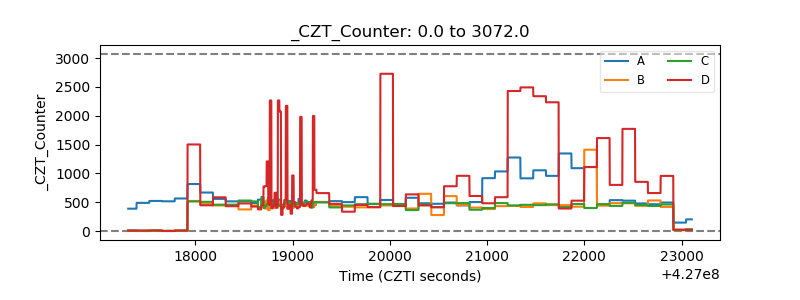 |
| +2.5 Volts monitor | 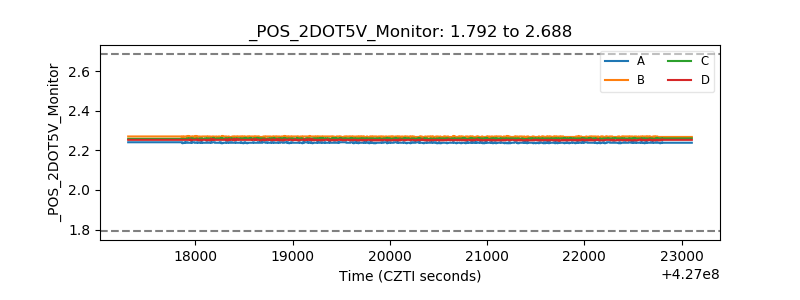 |
| +5 Volts monitor | 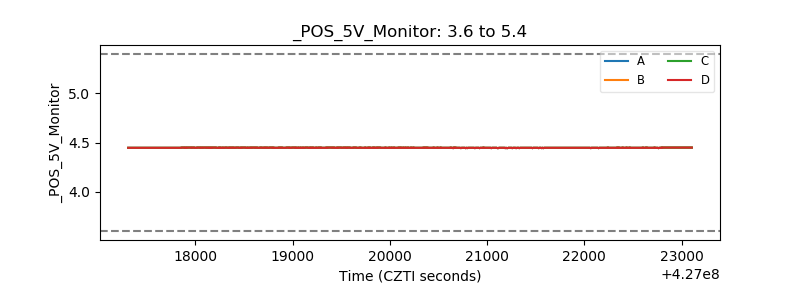 |
| _ROLL_ROT | 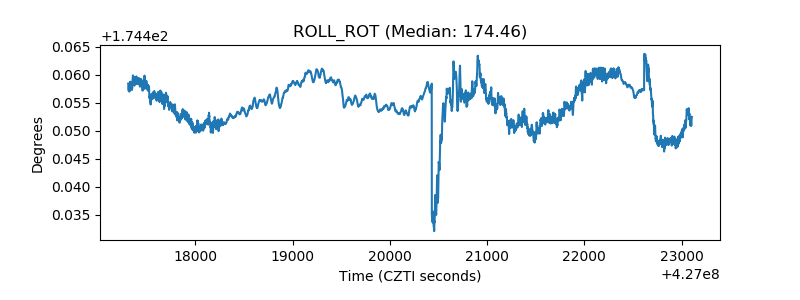 |
| _Roll_DEC | 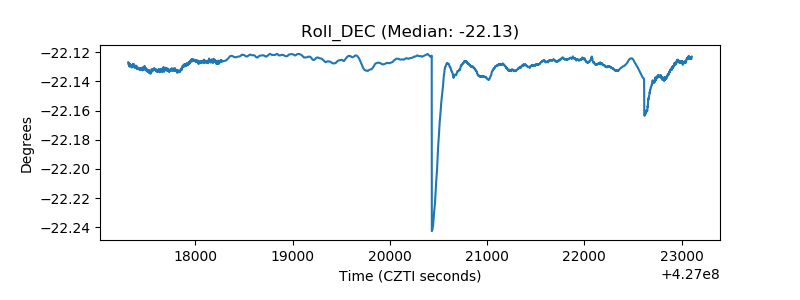 |
| _Roll_RA | 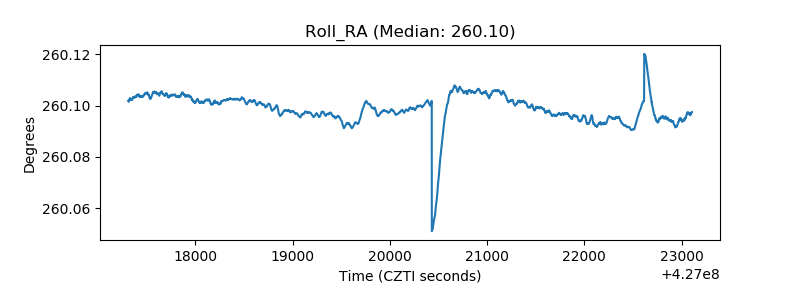 |
| Veto Counter | 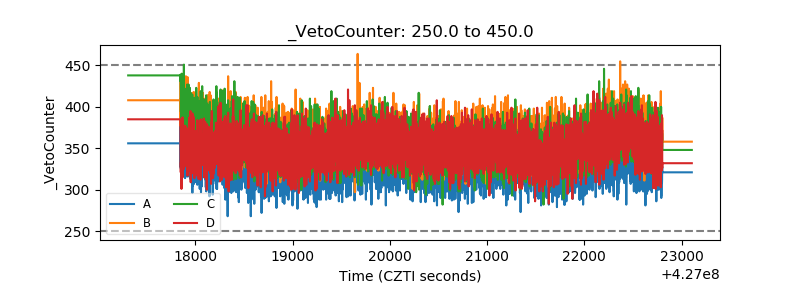 |