| Param | Original file | Final file |
|---|---|---|
| Filename | modeM0/AS1C07_001T11_9000005760_42138cztM0_level2.fits | modeM0/AS1C07_001T11_9000005760_42138cztM0_level2_quad_clean.evt |
| Size (bytes) | 369,774,720 | 86,155,200 |
| Size | 352.6 MB | 82.2 MB |
| Events in quadrant A | 2,920,903 | 592,902 |
| Events in quadrant B | 2,710,063 | 592,563 |
| Events in quadrant C | 2,475,615 | 585,115 |
| Events in quadrant D | 5,171,649 | 469,841 |
| Mode M0 | |||
|---|---|---|---|
| Quadrant | BADHDUFLAG | Total packets | Discarded packets |
| A | 0 | 12062 | 2 |
| B | 0 | 11690 | 2 |
| C | 0 | 10756 | 2 |
| D | 0 | 19130 | 2 |
| Mode M9 | |||
|---|---|---|---|
| Quadrant | BADHDUFLAG | Total packets | Discarded packets |
| A | 0 | 24 | 0 |
| B | 0 | 25 | 0 |
| C | 0 | 25 | 0 |
| D | 0 | 25 | 0 |
| Mode SS | |||
|---|---|---|---|
| Quadrant | BADHDUFLAG | Total packets | Discarded packets |
| A | 0 | 106 | 0 |
| B | 0 | 106 | 0 |
| C | 0 | 106 | 0 |
| D | 0 | 106 | 0 |
| Quadrant | Total seconds | Saturated seconds | Saturation percentage |
|---|---|---|---|
| A | 5260 | 22 | 0.418251% |
| B | 5259 | 101 | 1.920517% |
| C | 5259 | 4 | 0.076060% |
| D | 5259 | 819 | 15.573303% |
Noise dominated data is calculated using 1-second bins in cleaned event files. If a bin has >2000 counts, and if more than 50% of those come from <1% of pixels, then it is considered to be noise-dominated and hence unusable.
| Quadrant | # 1 sec bins | Bins with >0 counts | Bins with >2000 counts | High rate bins dominated by noise | Noise dominated (total time) | Noise dominated (detector-on time) | Marked lightcurve |
|---|---|---|---|---|---|---|---|
| A | 7023 | 5261 | 6 | 6 | 0.09% | 0.11% | 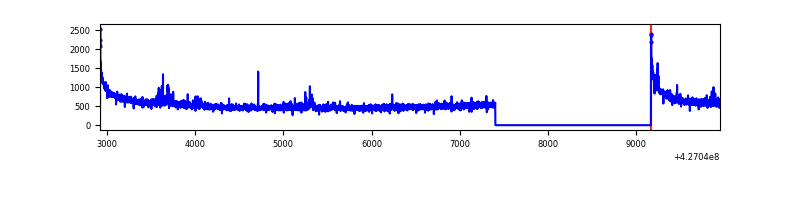 |
| B | 7022 | 5260 | 80 | 80 | 1.14% | 1.52% | 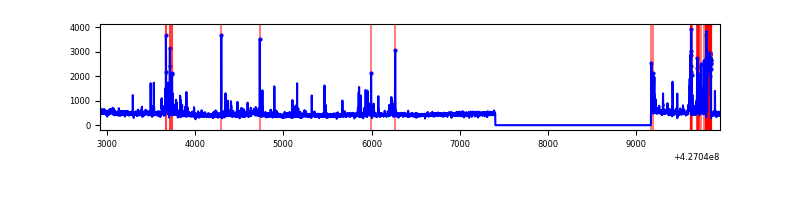 |
| C | 7022 | 5260 | 2 | 2 | 0.03% | 0.04% | 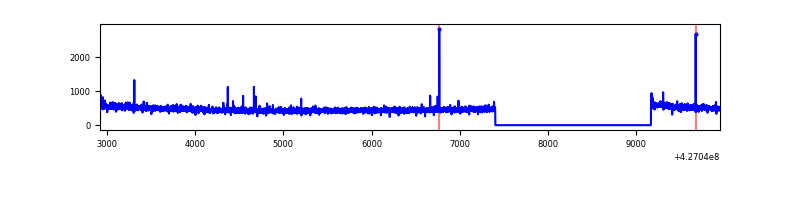 |
| D | 7022 | 5260 | 728 | 728 | 10.37% | 13.84% | 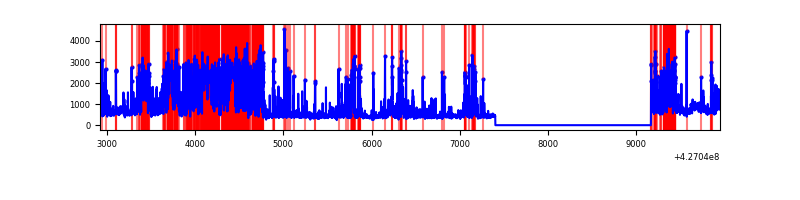 |
Top three noisy pixels from each quadrant. If the there are fewer than three noisy pixels in the level2.evt file, extra rows are filled as -1
| Pixel properties | Quadrant properties | ||||||
|---|---|---|---|---|---|---|---|
| Quadrant | DetID | PixID | Counts | Sigma | Mean | Median | Sigma |
| A | 10 | 83 | 612126 | 5226.51 | 572 | 560 | 117.0 |
| A | 12 | 189 | 53392 | 451.51 | 572 | 560 | 117.0 |
| A | 13 | 6 | 16480 | 136.05 | 572 | 560 | 117.0 |
| B | 15 | 35 | 302890 | 2798.24 | 564 | 549 | 108.0 |
| B | 3 | 112 | 63589 | 583.45 | 564 | 549 | 108.0 |
| B | 5 | 255 | 52514 | 480.95 | 564 | 549 | 108.0 |
| C | 15 | 214 | 219890 | 1658.42 | 566 | 567 | 132.2 |
| C | 3 | 233 | 28540 | 211.52 | 566 | 567 | 132.2 |
| C | 12 | 249 | 10900 | 78.13 | 566 | 567 | 132.2 |
| D | 2 | 249 | 790946 | 6134.53 | 529 | 513 | 128.8 |
| D | 13 | 249 | 724021 | 5615.13 | 529 | 513 | 128.8 |
| D | 1 | 47 | 642430 | 4981.9 | 529 | 513 | 128.8 |
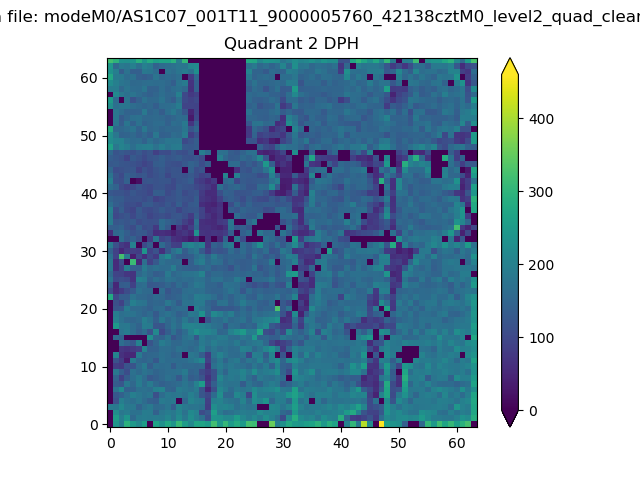
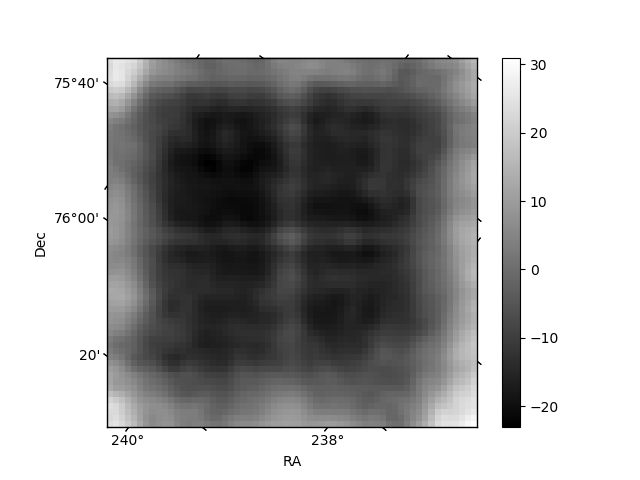
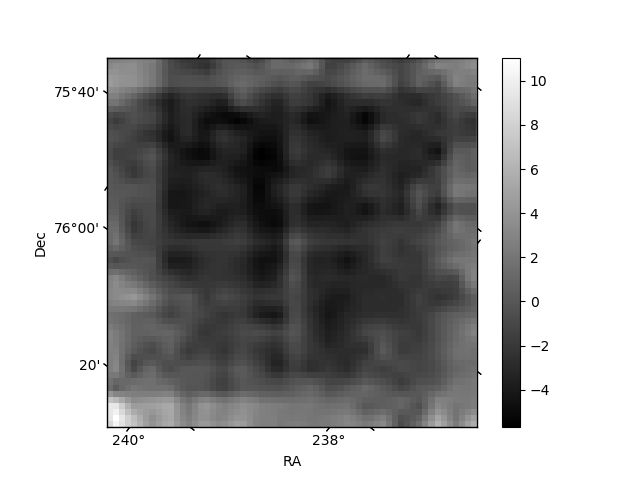
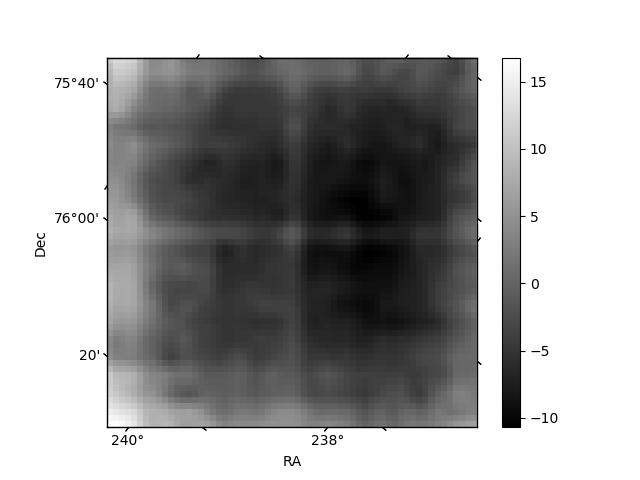
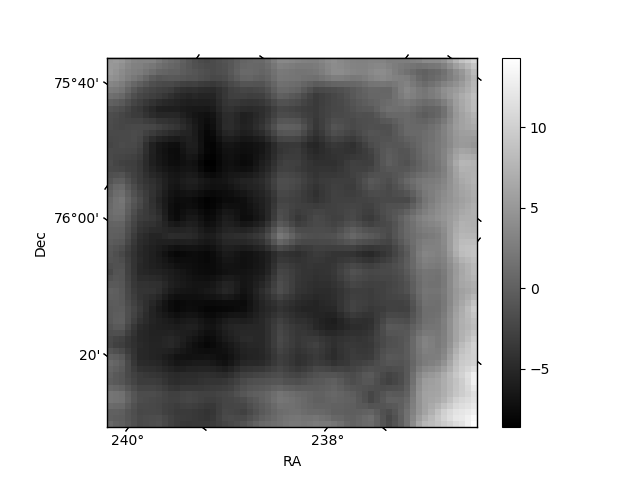
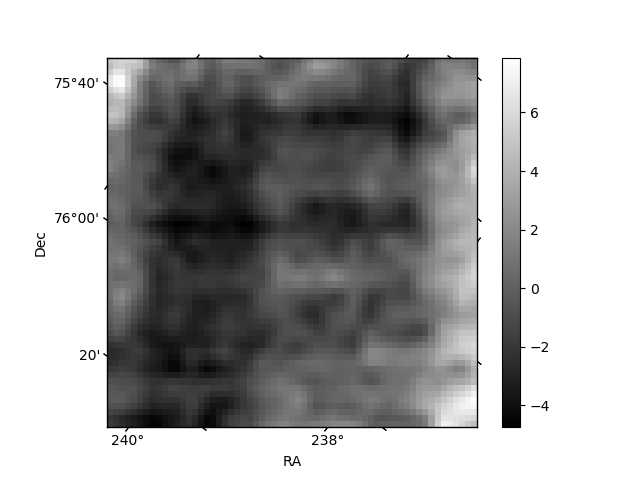
Histogram calculated using DETX and DETY for each event in the final _common_clean file
| Quadrant A | 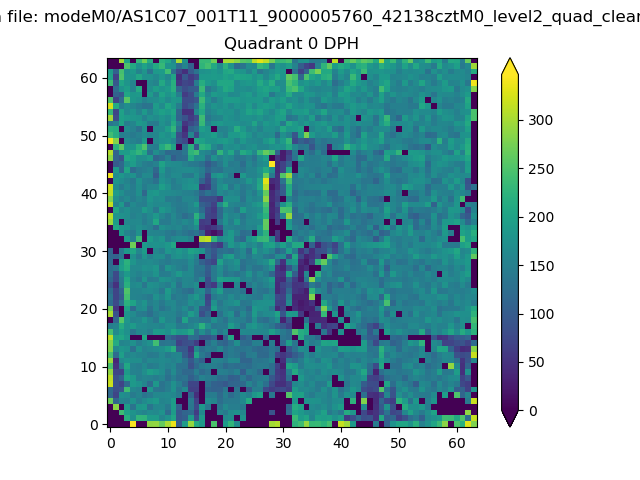 |
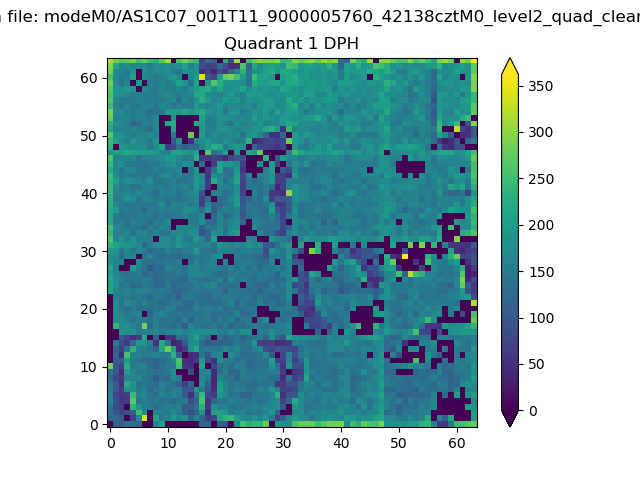 |
Quadrant B |
|---|---|---|---|
| Quadrant D | 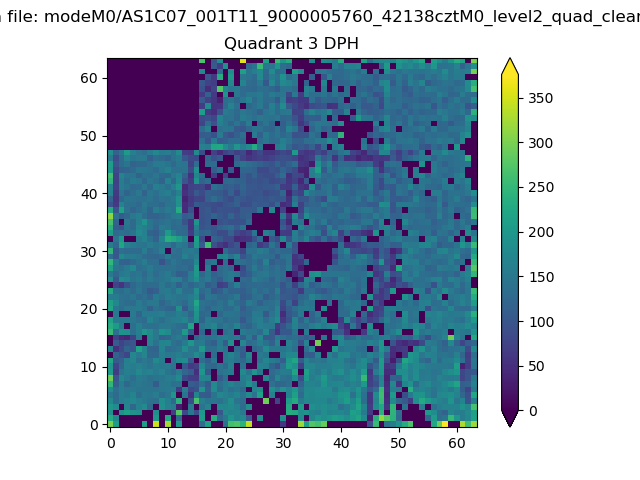 |
 |
Quadrant C |
| Plot type | Count rate plots | Images |
|---|---|---|
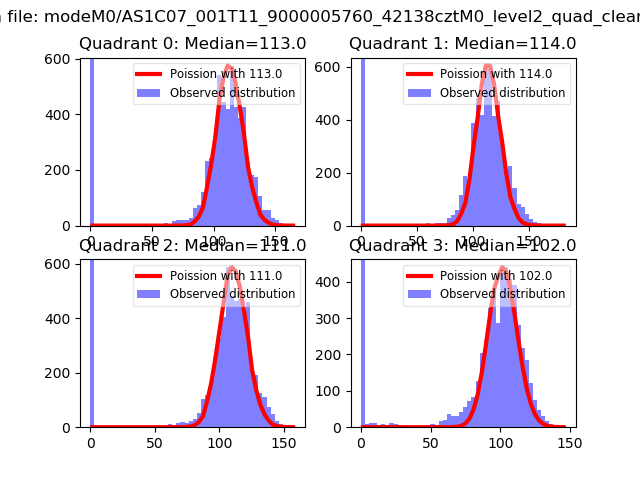
| Comparison with Poisson distribution Blue bars denote a histogram of data divided into 1 sec bins. Red curve is a Poisson curve with rate = median count rate of data. |
 |
 |
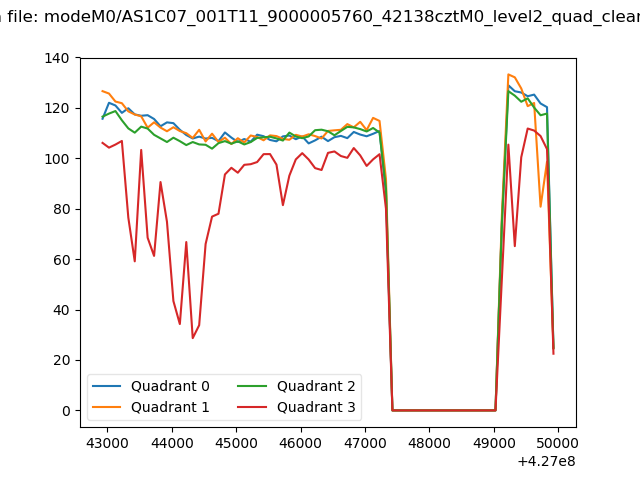
| Quadrant-wise count rates Data is divided into 100 sec bins |
 |
|
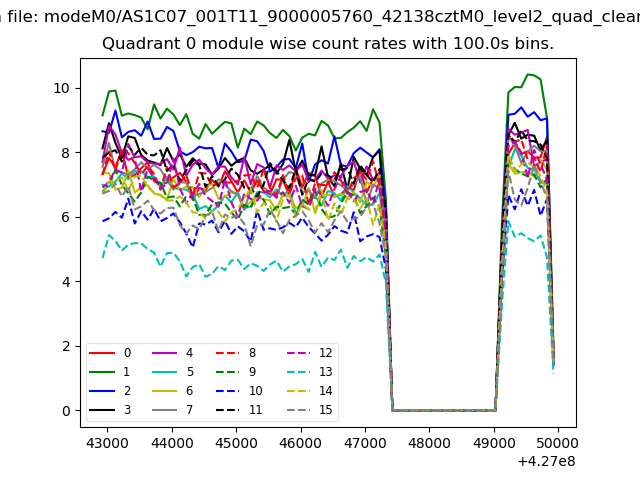
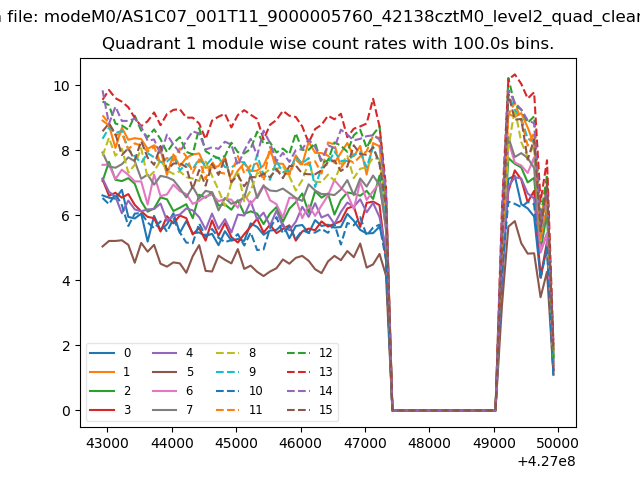
| Module-wise count rates for Quadrant A Data is divided into 100 sec bins |
 |
 |
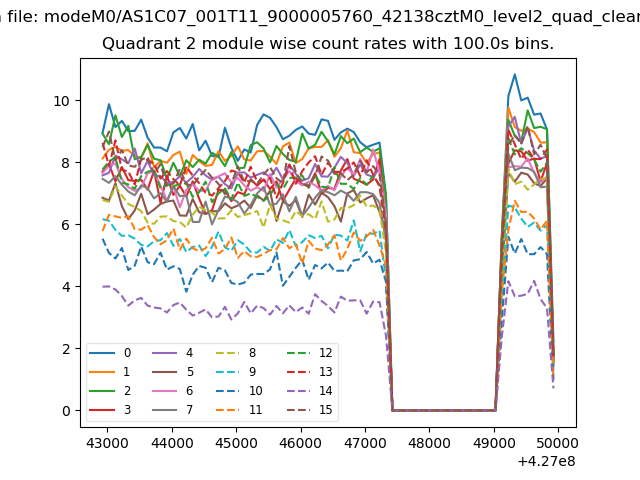
| Module-wise count rates for Quadrant B Data is divided into 100 sec bins |
 |
 |
| Module-wise count rates for Quadrant C Data is divided into 100 sec bins |
 |
 |
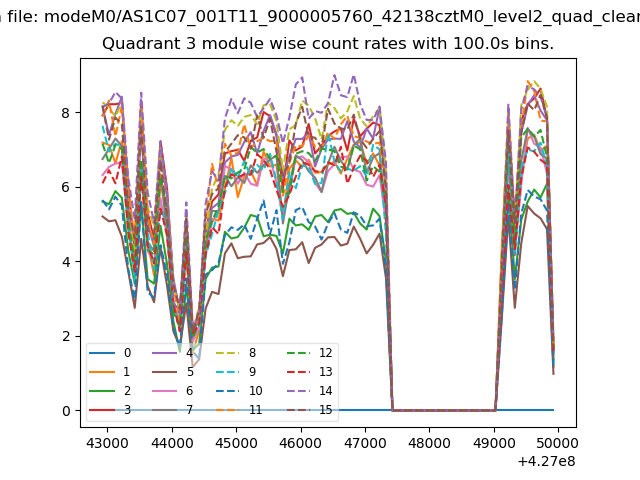
| Module-wise count rates for Quadrant D Data is divided into 100 sec bins |
 |
 |
| Parameter | Plot |
|---|---|
| CZT HV Monitor | 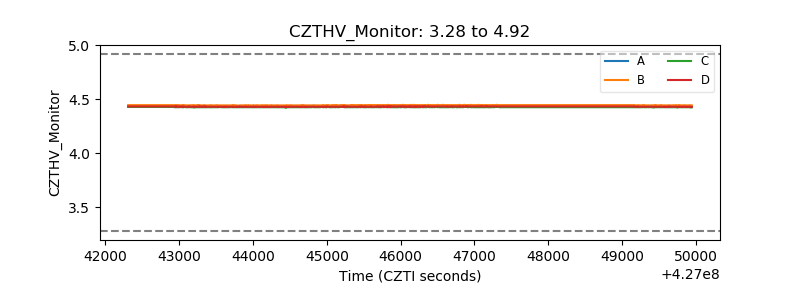 |
| D_VDD | 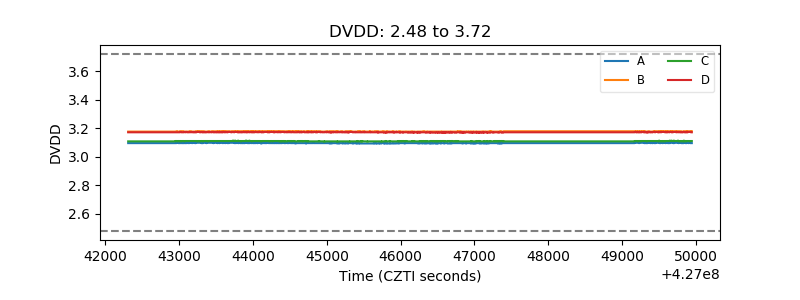 |
| Temperature 1 | 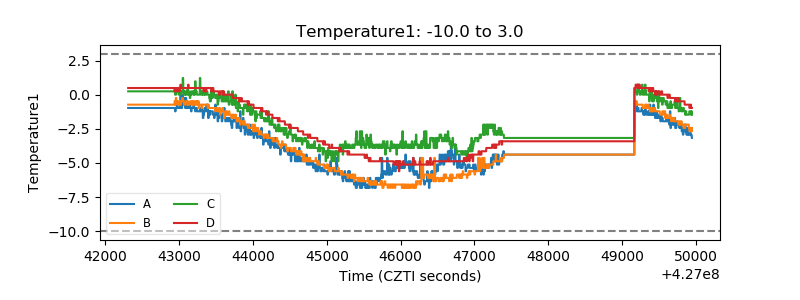 |
| Veto HV Monitor | 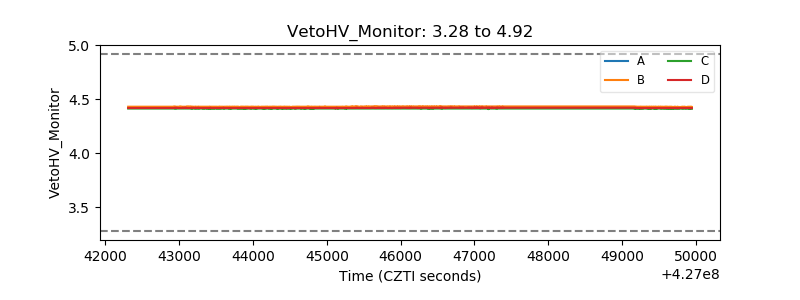 |
| Veto LLD | 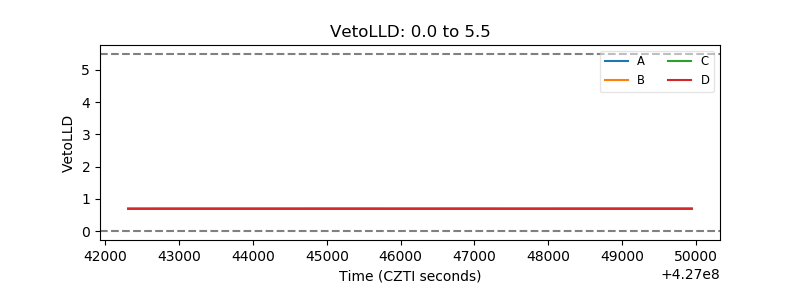 |
| Alpha Counter | 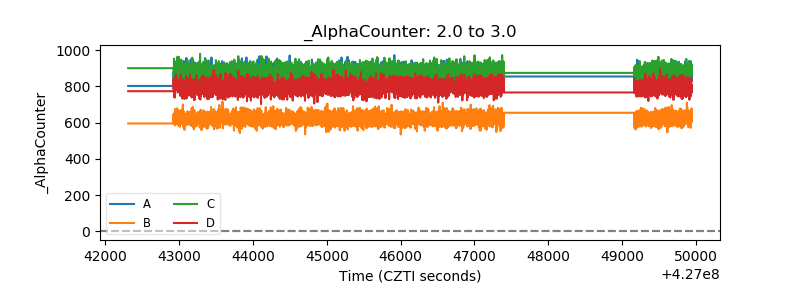 |
| _CPM_Rate | 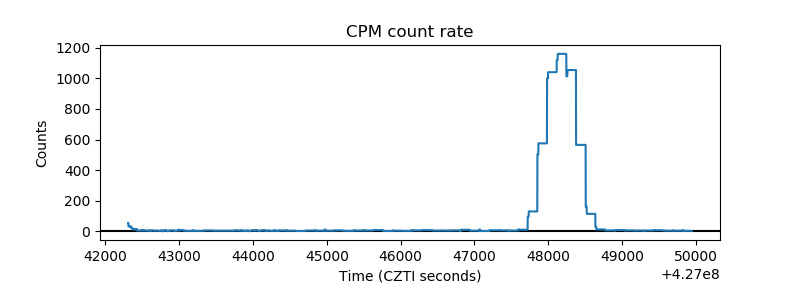 |
| CZT Counter | 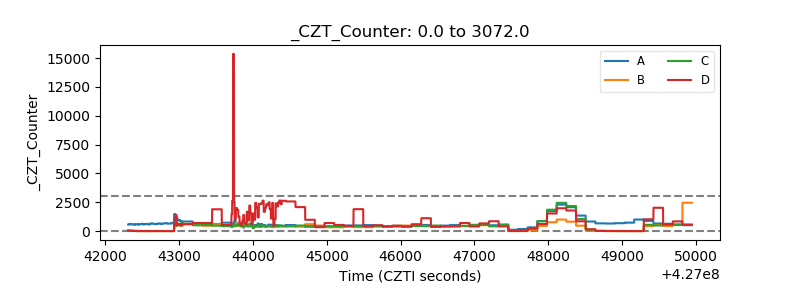 |
| +2.5 Volts monitor |  |
| +5 Volts monitor | 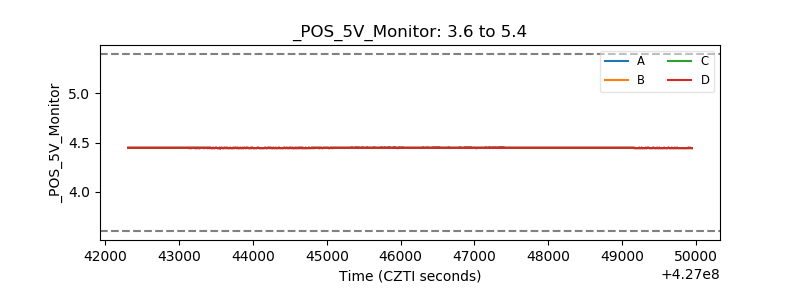 |
| _ROLL_ROT | 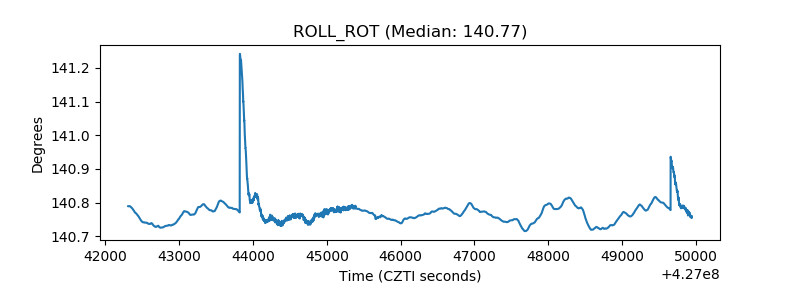 |
| _Roll_DEC | 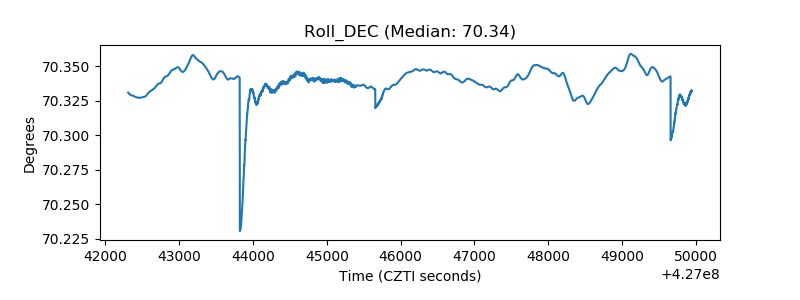 |
| _Roll_RA | 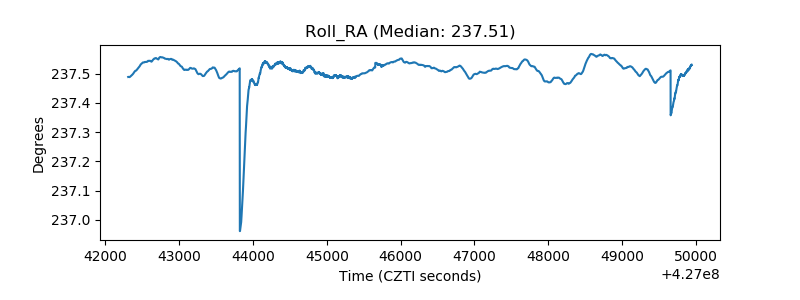 |
| Veto Counter | 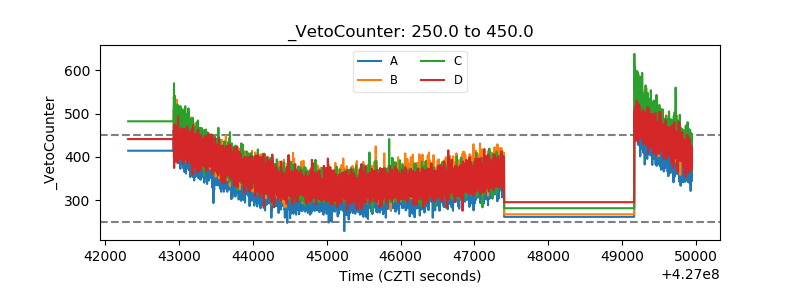 |