| Param | Original file | Final file |
|---|---|---|
| Filename | modeM0/AS1C07_001T11_9000005760_42139cztM0_level2.fits | modeM0/AS1C07_001T11_9000005760_42139cztM0_level2_quad_clean.evt |
| Size (bytes) | 320,022,720 | 88,680,960 |
| Size | 305.2 MB | 84.6 MB |
| Events in quadrant A | 2,867,387 | 594,261 |
| Events in quadrant B | 2,641,462 | 598,946 |
| Events in quadrant C | 2,439,876 | 596,887 |
| Events in quadrant D | 3,496,942 | 534,906 |
| Mode M0 | |||
|---|---|---|---|
| Quadrant | BADHDUFLAG | Total packets | Discarded packets |
| A | 0 | 11764 | 2 |
| B | 0 | 11451 | 2 |
| C | 0 | 10534 | 2 |
| D | 0 | 13978 | 2 |
| Mode M9 | |||
|---|---|---|---|
| Quadrant | BADHDUFLAG | Total packets | Discarded packets |
| A | 0 | 28 | 0 |
| B | 0 | 29 | 0 |
| C | 0 | 29 | 0 |
| D | 0 | 29 | 0 |
| Mode SS | |||
|---|---|---|---|
| Quadrant | BADHDUFLAG | Total packets | Discarded packets |
| A | 0 | 104 | 0 |
| B | 0 | 104 | 0 |
| C | 0 | 104 | 0 |
| D | 0 | 104 | 0 |
| Quadrant | Total seconds | Saturated seconds | Saturation percentage |
|---|---|---|---|
| A | 5141 | 12 | 0.233418% |
| B | 5141 | 104 | 2.022953% |
| C | 5141 | 4 | 0.077806% |
| D | 5141 | 167 | 3.248395% |
Noise dominated data is calculated using 1-second bins in cleaned event files. If a bin has >2000 counts, and if more than 50% of those come from <1% of pixels, then it is considered to be noise-dominated and hence unusable.
| Quadrant | # 1 sec bins | Bins with >0 counts | Bins with >2000 counts | High rate bins dominated by noise | Noise dominated (total time) | Noise dominated (detector-on time) | Marked lightcurve |
|---|---|---|---|---|---|---|---|
| A | 7024 | 5142 | 6 | 6 | 0.09% | 0.12% | 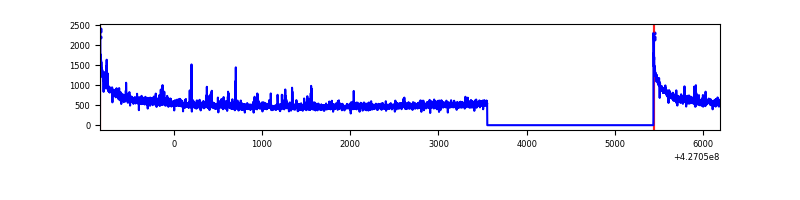 |
| B | 7024 | 5142 | 83 | 83 | 1.18% | 1.61% |  |
| C | 7024 | 5142 | 1 | 1 | 0.01% | 0.02% | 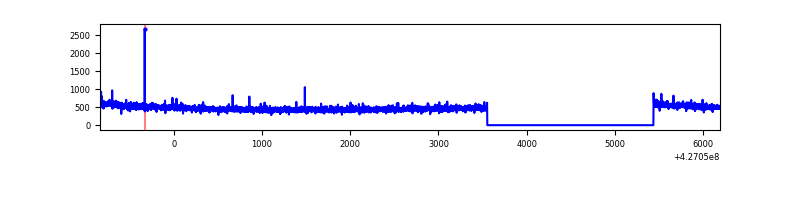 |
| D | 7024 | 5142 | 159 | 159 | 2.26% | 3.09% |  |
Top three noisy pixels from each quadrant. If the there are fewer than three noisy pixels in the level2.evt file, extra rows are filled as -1
| Pixel properties | Quadrant properties | ||||||
|---|---|---|---|---|---|---|---|
| Quadrant | DetID | PixID | Counts | Sigma | Mean | Median | Sigma |
| A | 10 | 83 | 596228 | 5263.85 | 561 | 548 | 113.2 |
| A | 12 | 189 | 40660 | 354.45 | 561 | 548 | 113.2 |
| A | 7 | 3 | 32599 | 283.22 | 561 | 548 | 113.2 |
| B | 15 | 35 | 285465 | 2687.56 | 558 | 542 | 106.0 |
| B | 3 | 112 | 73405 | 687.29 | 558 | 542 | 106.0 |
| B | 5 | 255 | 35692 | 331.55 | 558 | 542 | 106.0 |
| C | 15 | 214 | 214714 | 1655.09 | 561 | 564 | 129.4 |
| C | 3 | 233 | 30298 | 229.8 | 561 | 564 | 129.4 |
| C | 12 | 249 | 6198 | 43.54 | 561 | 564 | 129.4 |
| D | 13 | 249 | 382485 | 2806.0 | 551 | 535 | 136.1 |
| D | 1 | 52 | 380867 | 2794.11 | 551 | 535 | 136.1 |
| D | 12 | 233 | 122185 | 893.7 | 551 | 535 | 136.1 |
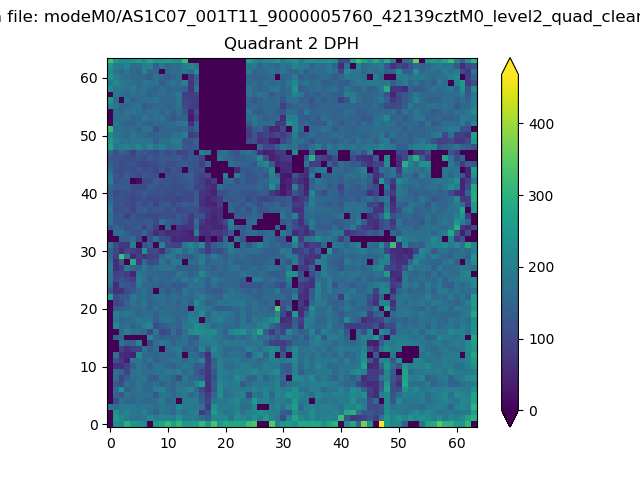
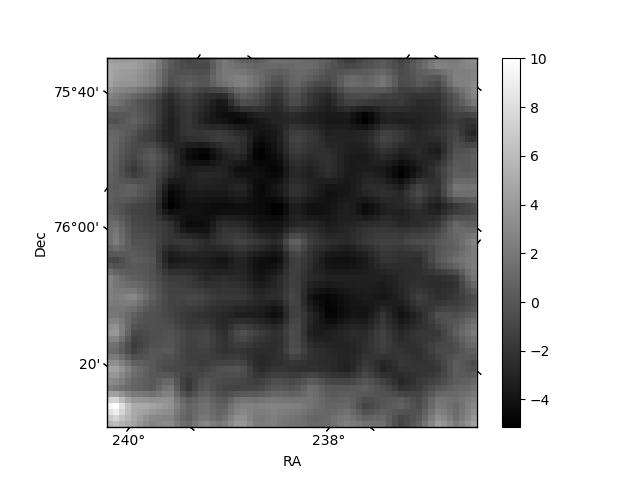
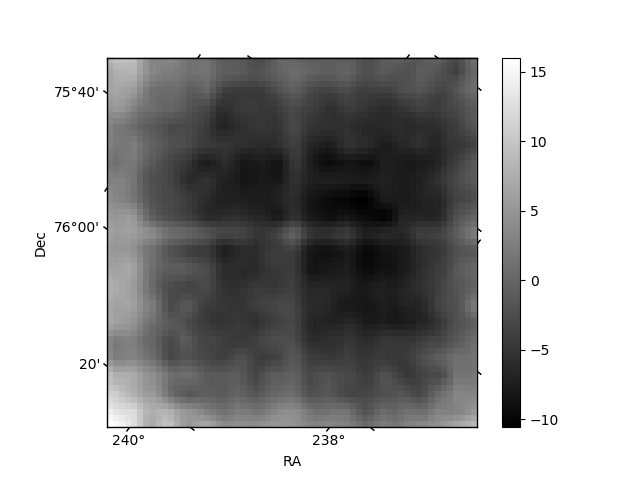
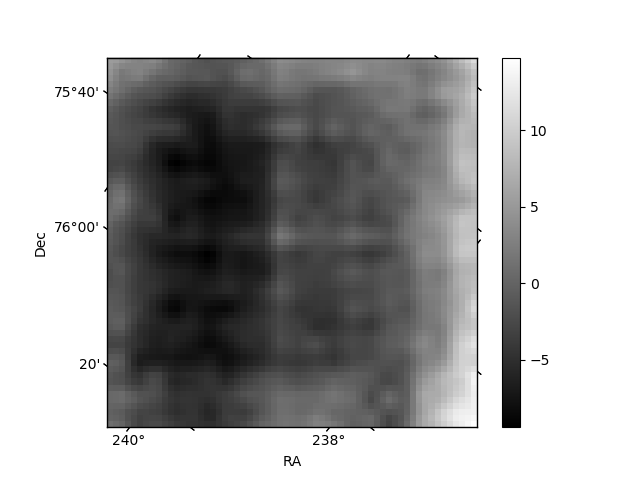
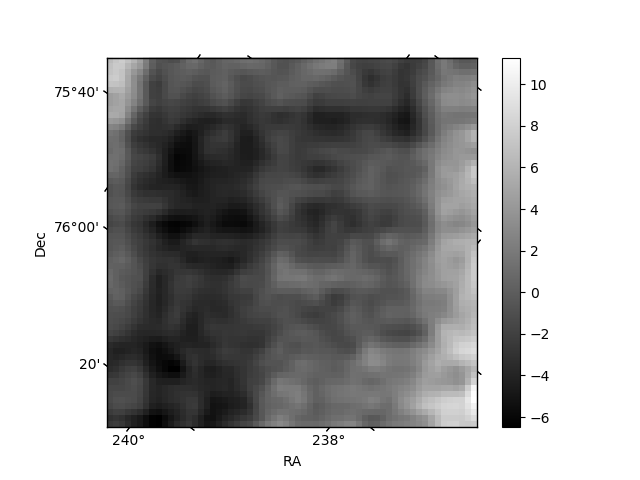
Histogram calculated using DETX and DETY for each event in the final _common_clean file
| Quadrant A | 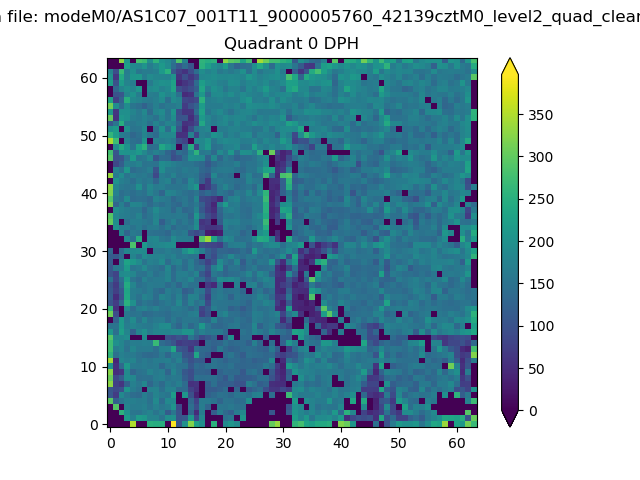 |
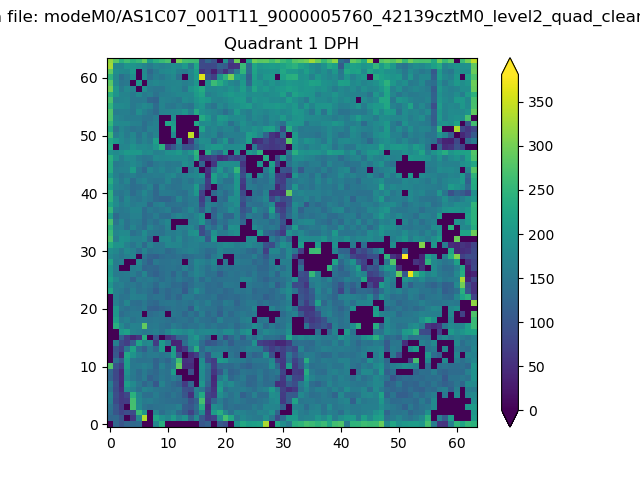 |
Quadrant B |
|---|---|---|---|
| Quadrant D | 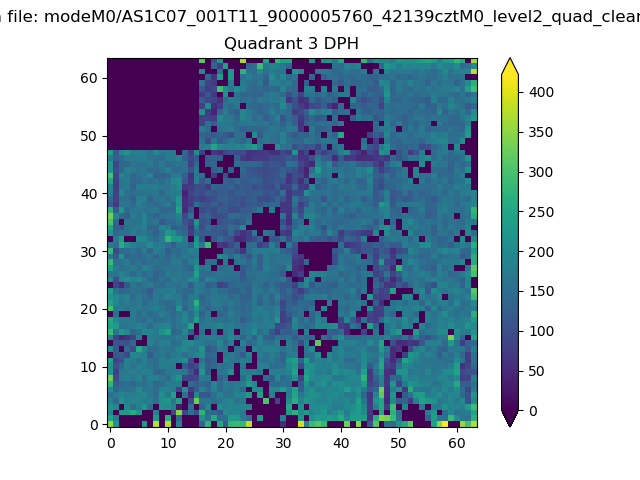 |
 |
Quadrant C |
| Plot type | Count rate plots | Images |
|---|---|---|
| Comparison with Poisson distribution Blue bars denote a histogram of data divided into 1 sec bins. Red curve is a Poisson curve with rate = median count rate of data. |
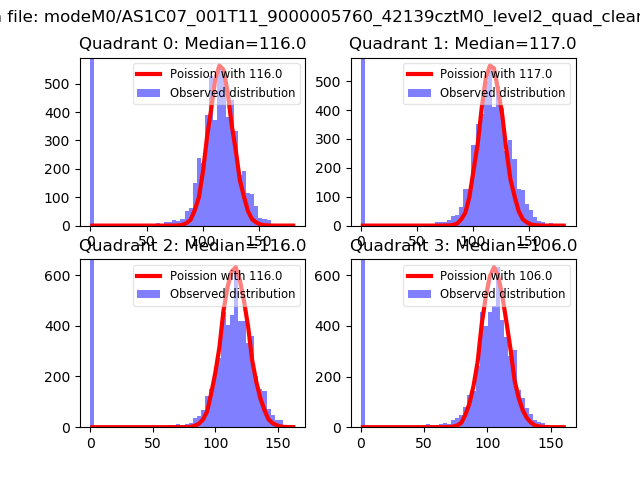 |
 |
| Quadrant-wise count rates Data is divided into 100 sec bins |
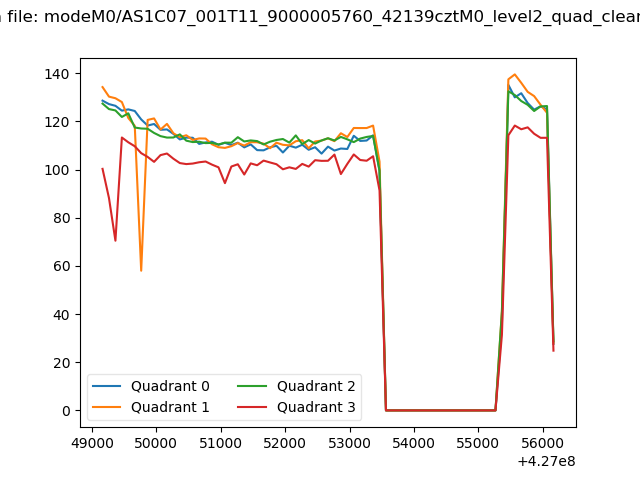 |
|
| Module-wise count rates for Quadrant A Data is divided into 100 sec bins |
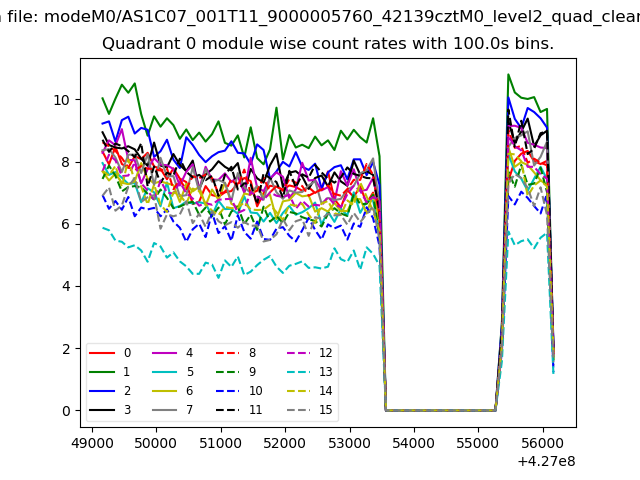 |
 |
| Module-wise count rates for Quadrant B Data is divided into 100 sec bins |
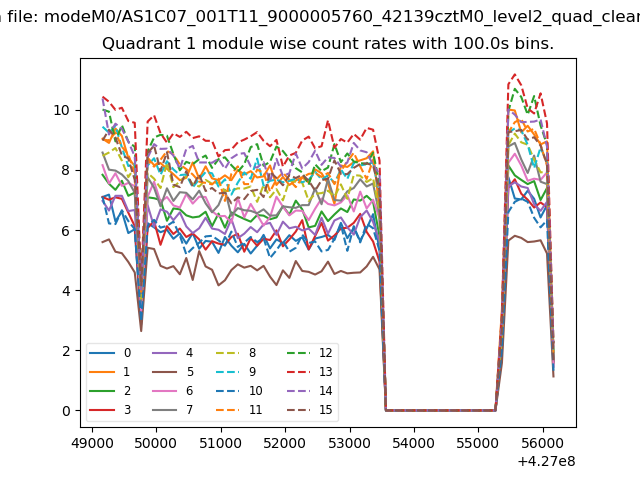 |
 |
| Module-wise count rates for Quadrant C Data is divided into 100 sec bins |
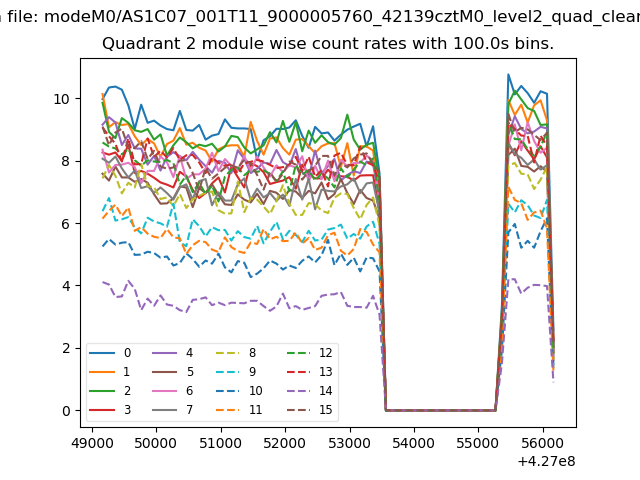 |
 |
| Module-wise count rates for Quadrant D Data is divided into 100 sec bins |
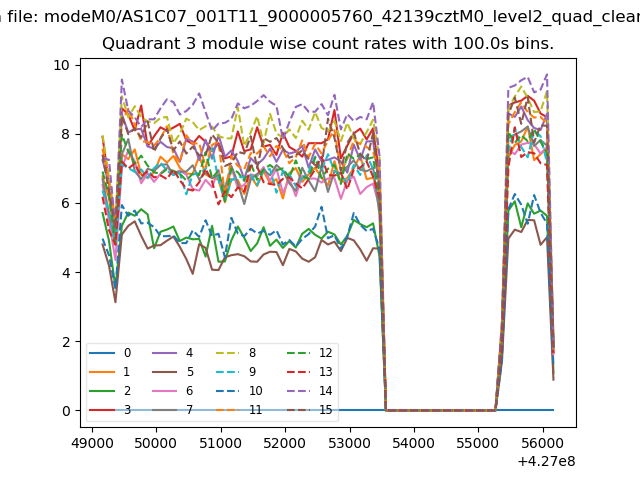 |
 |
| Parameter | Plot |
|---|---|
| CZT HV Monitor |  |
| D_VDD | 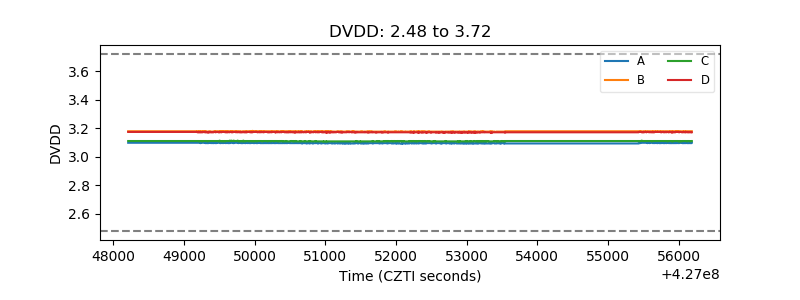 |
| Temperature 1 | 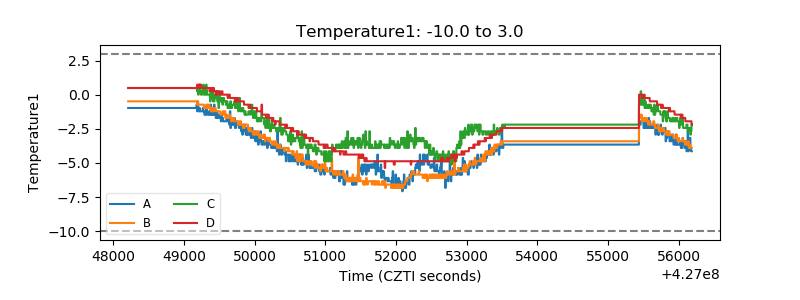 |
| Veto HV Monitor | 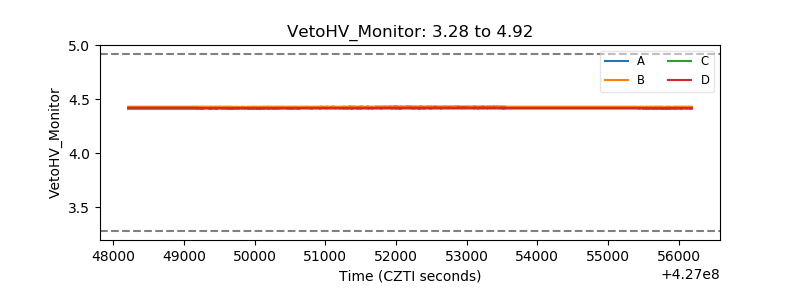 |
| Veto LLD | 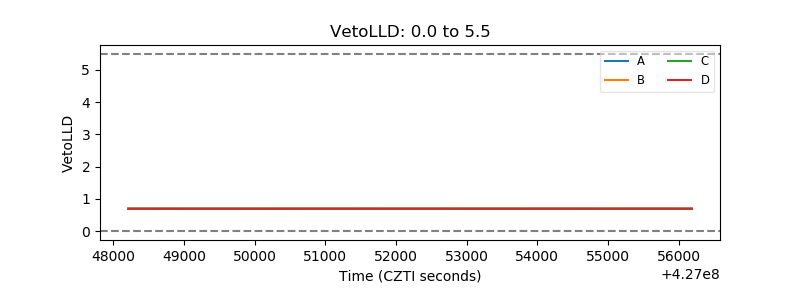 |
| Alpha Counter |  |
| _CPM_Rate |  |
| CZT Counter | 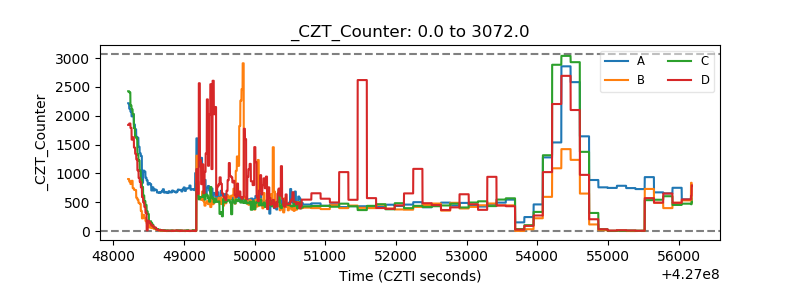 |
| +2.5 Volts monitor | 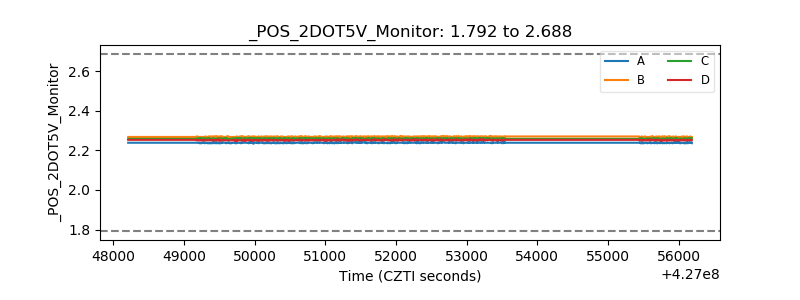 |
| +5 Volts monitor | 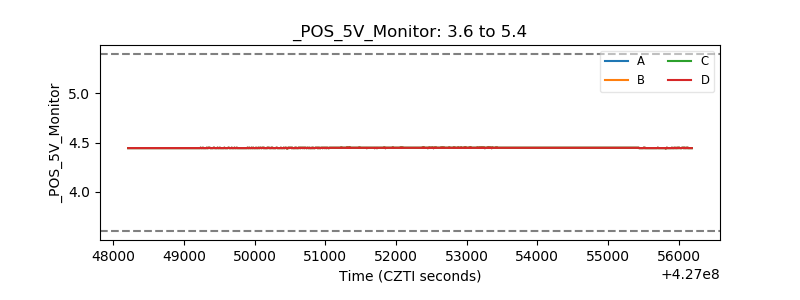 |
| _ROLL_ROT | 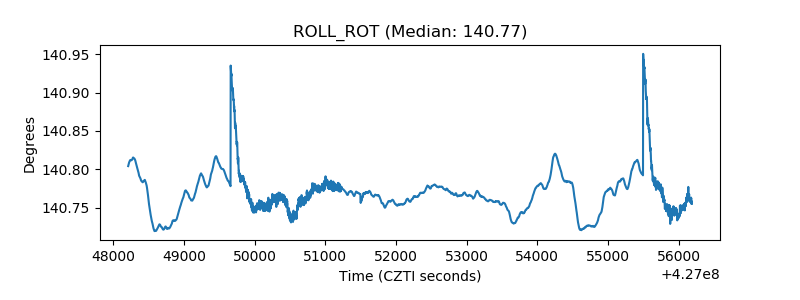 |
| _Roll_DEC | 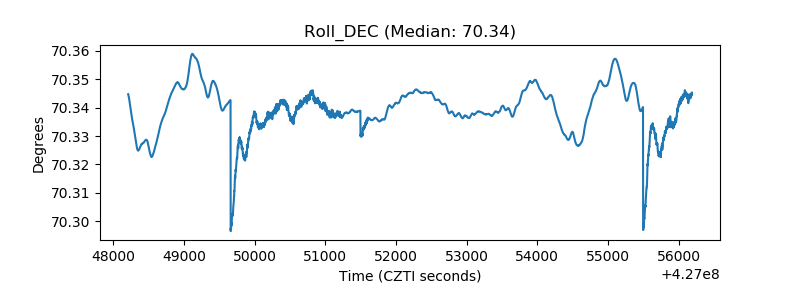 |
| _Roll_RA | 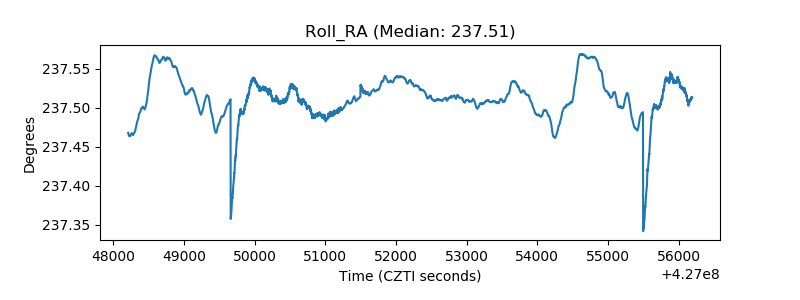 |
| Veto Counter | 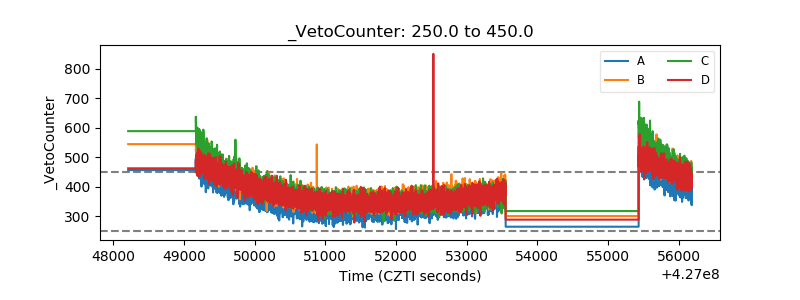 |