| Param | Original file | Final file |
|---|---|---|
| Filename | modeM0/AS1C07_001T11_9000005760_42140cztM0_level2.fits | modeM0/AS1C07_001T11_9000005760_42140cztM0_level2_quad_clean.evt |
| Size (bytes) | 310,394,880 | 88,525,440 |
| Size | 296.0 MB | 84.4 MB |
| Events in quadrant A | 2,770,741 | 590,440 |
| Events in quadrant B | 2,421,912 | 609,414 |
| Events in quadrant C | 2,402,196 | 600,271 |
| Events in quadrant D | 3,503,571 | 528,406 |
| Mode M0 | |||
|---|---|---|---|
| Quadrant | BADHDUFLAG | Total packets | Discarded packets |
| A | 0 | 11357 | 2 |
| B | 0 | 10636 | 2 |
| C | 0 | 10284 | 2 |
| D | 0 | 13928 | 2 |
| Mode M9 | |||
|---|---|---|---|
| Quadrant | BADHDUFLAG | Total packets | Discarded packets |
| A | 0 | 31 | 0 |
| B | 0 | 32 | 0 |
| C | 0 | 32 | 0 |
| D | 0 | 32 | 0 |
| Mode SS | |||
|---|---|---|---|
| Quadrant | BADHDUFLAG | Total packets | Discarded packets |
| A | 0 | 102 | 0 |
| B | 0 | 102 | 0 |
| C | 0 | 102 | 0 |
| D | 0 | 102 | 0 |
| Quadrant | Total seconds | Saturated seconds | Saturation percentage |
|---|---|---|---|
| A | 5021 | 22 | 0.438160% |
| B | 5021 | 23 | 0.458076% |
| C | 5021 | 9 | 0.179247% |
| D | 5021 | 234 | 4.660426% |
Noise dominated data is calculated using 1-second bins in cleaned event files. If a bin has >2000 counts, and if more than 50% of those come from <1% of pixels, then it is considered to be noise-dominated and hence unusable.
| Quadrant | # 1 sec bins | Bins with >0 counts | Bins with >2000 counts | High rate bins dominated by noise | Noise dominated (total time) | Noise dominated (detector-on time) | Marked lightcurve |
|---|---|---|---|---|---|---|---|
| A | 7024 | 5022 | 12 | 12 | 0.17% | 0.24% | 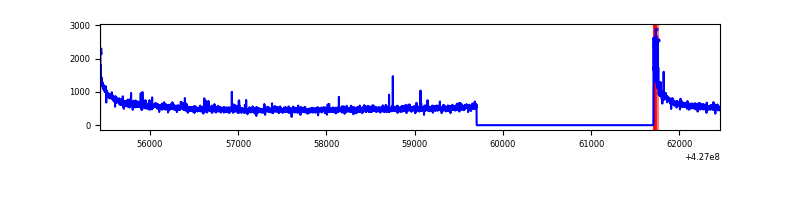 |
| B | 7024 | 5022 | 15 | 15 | 0.21% | 0.30% | 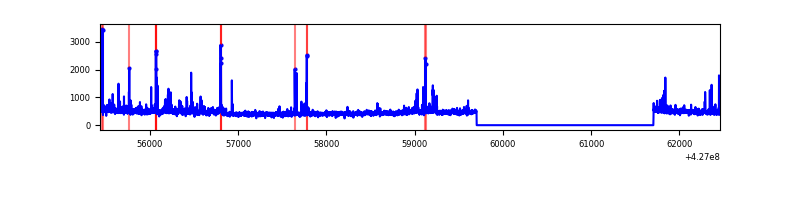 |
| C | 7024 | 5022 | 6 | 6 | 0.09% | 0.12% | 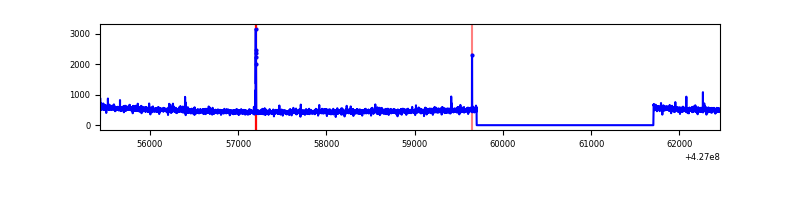 |
| D | 7024 | 5022 | 204 | 204 | 2.90% | 4.06% | 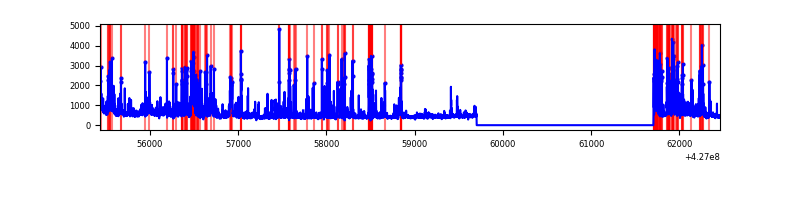 |
Top three noisy pixels from each quadrant. If the there are fewer than three noisy pixels in the level2.evt file, extra rows are filled as -1
| Pixel properties | Quadrant properties | ||||||
|---|---|---|---|---|---|---|---|
| Quadrant | DetID | PixID | Counts | Sigma | Mean | Median | Sigma |
| A | 10 | 83 | 566103 | 5055.17 | 549 | 536 | 111.9 |
| A | 12 | 189 | 27966 | 245.18 | 549 | 536 | 111.9 |
| A | 7 | 3 | 27689 | 242.7 | 549 | 536 | 111.9 |
| B | 5 | 255 | 66452 | 623.85 | 555 | 540 | 105.7 |
| B | 3 | 112 | 48008 | 449.28 | 555 | 540 | 105.7 |
| B | 0 | 156 | 36696 | 342.21 | 555 | 540 | 105.7 |
| C | 15 | 214 | 209861 | 1644.76 | 552 | 554 | 127.3 |
| C | 8 | 79 | 14784 | 111.82 | 552 | 554 | 127.3 |
| C | 12 | 249 | 12606 | 94.71 | 552 | 554 | 127.3 |
| D | 13 | 249 | 239117 | 1829.18 | 535 | 519 | 130.4 |
| D | 12 | 233 | 229680 | 1756.83 | 535 | 519 | 130.4 |
| D | 1 | 47 | 201445 | 1540.37 | 535 | 519 | 130.4 |
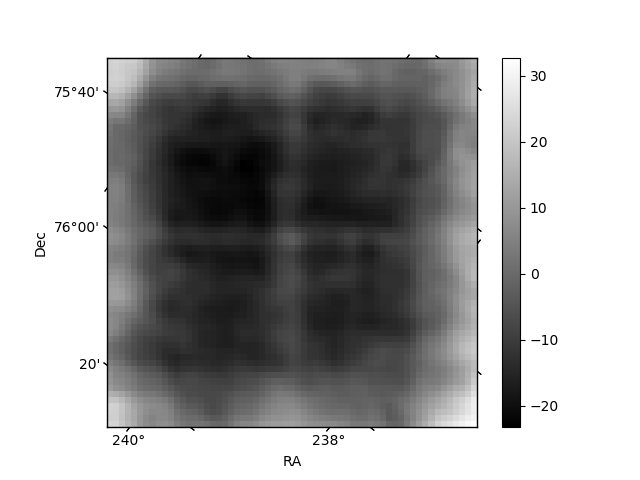
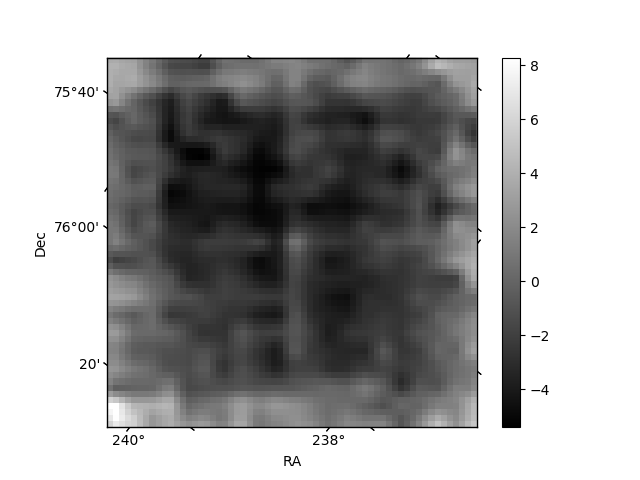
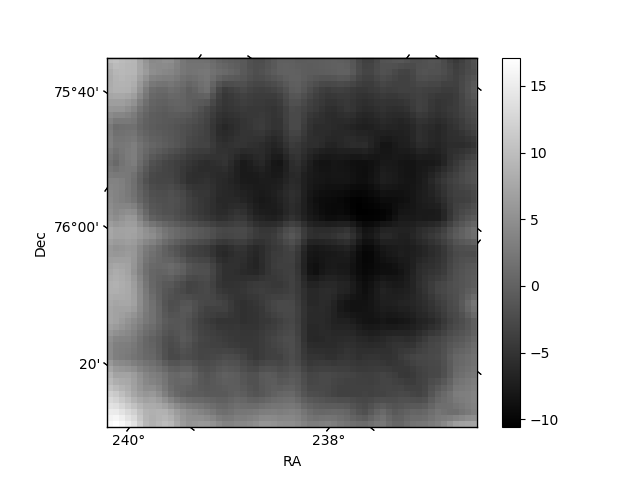
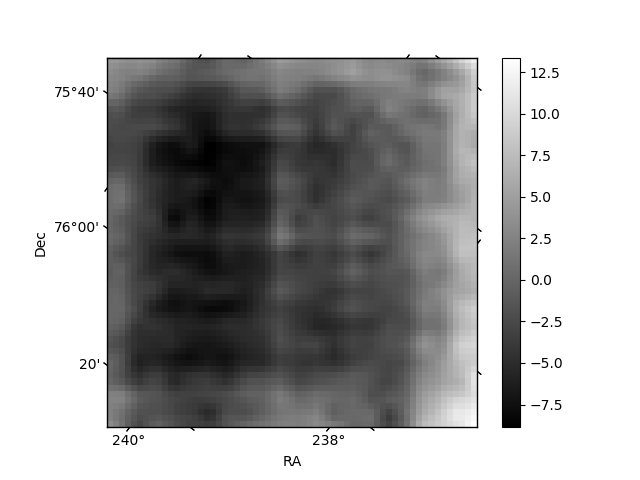
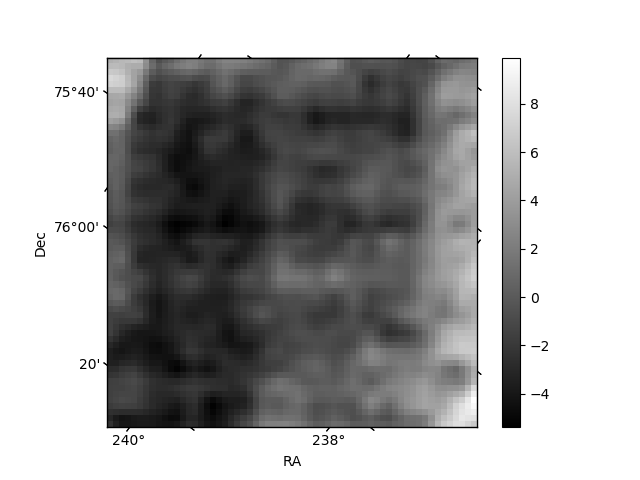
Histogram calculated using DETX and DETY for each event in the final _common_clean file
| Quadrant A | 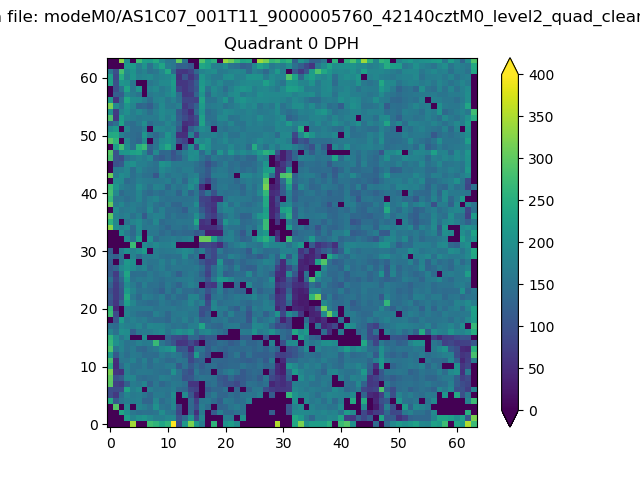 |
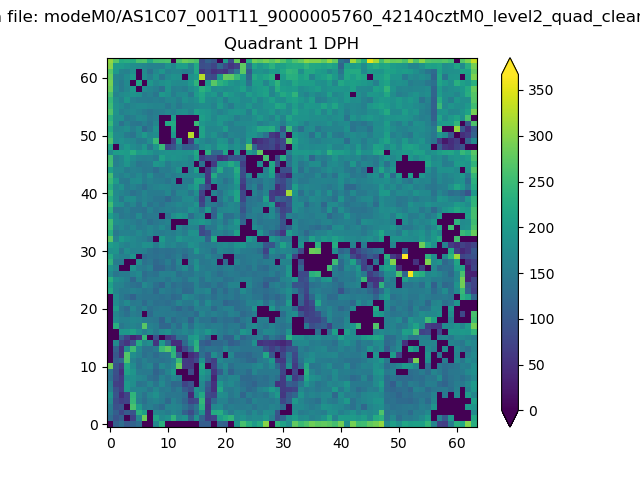 |
Quadrant B |
|---|---|---|---|
| Quadrant D | 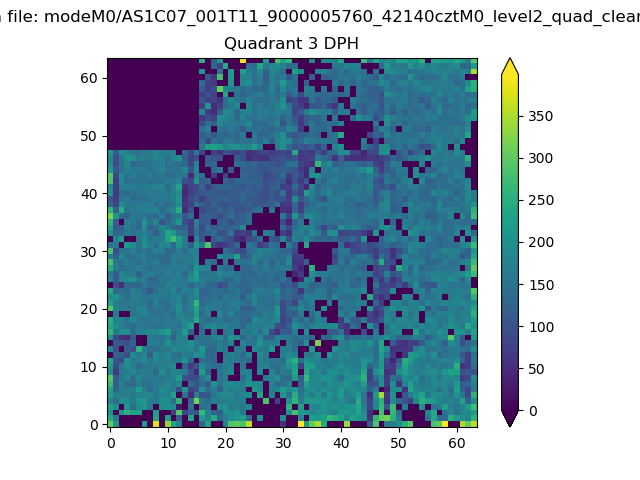 |
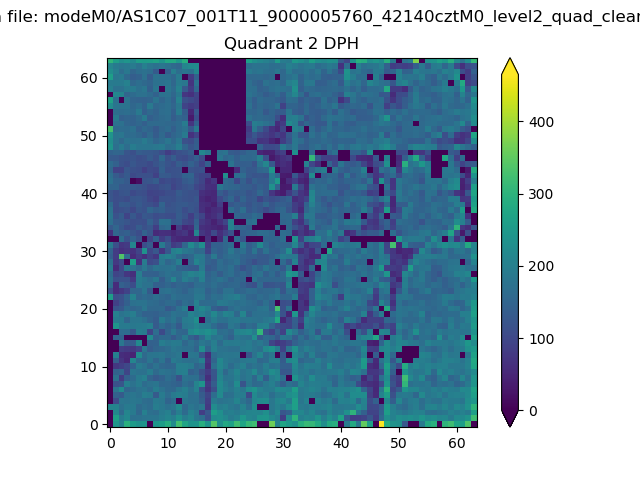 |
Quadrant C |
| Plot type | Count rate plots | Images |
|---|---|---|
| Comparison with Poisson distribution Blue bars denote a histogram of data divided into 1 sec bins. Red curve is a Poisson curve with rate = median count rate of data. |
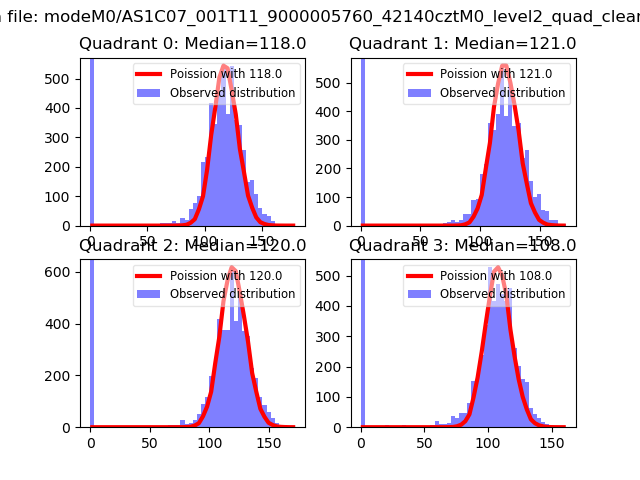 |
 |
| Quadrant-wise count rates Data is divided into 100 sec bins |
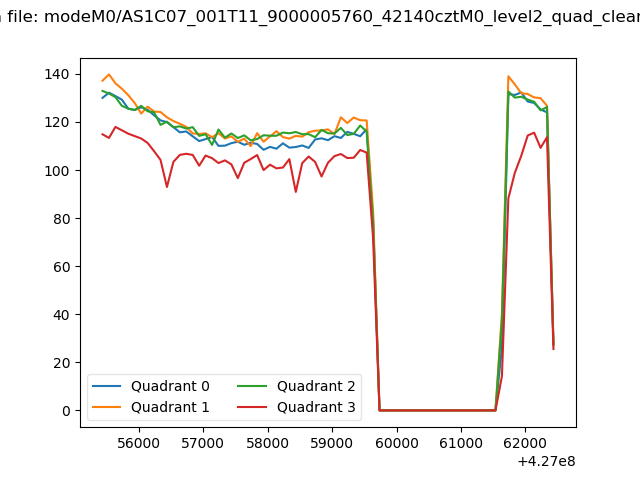 |
|
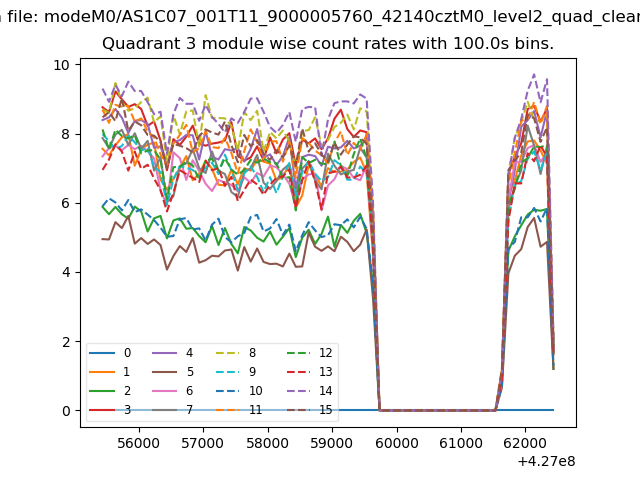
| Module-wise count rates for Quadrant A Data is divided into 100 sec bins |
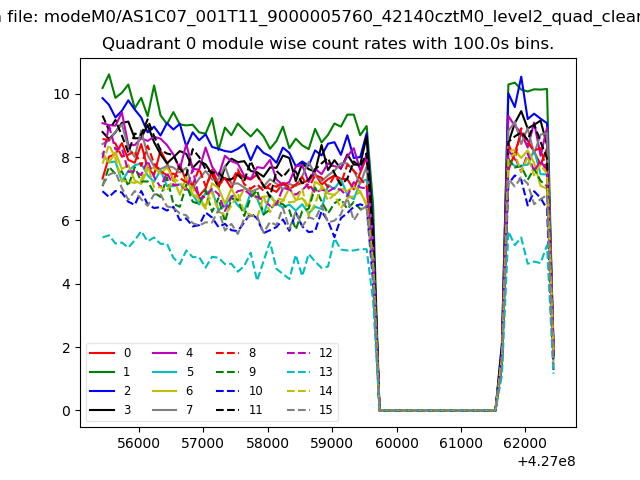 |
 |
| Module-wise count rates for Quadrant B Data is divided into 100 sec bins |
 |
 |
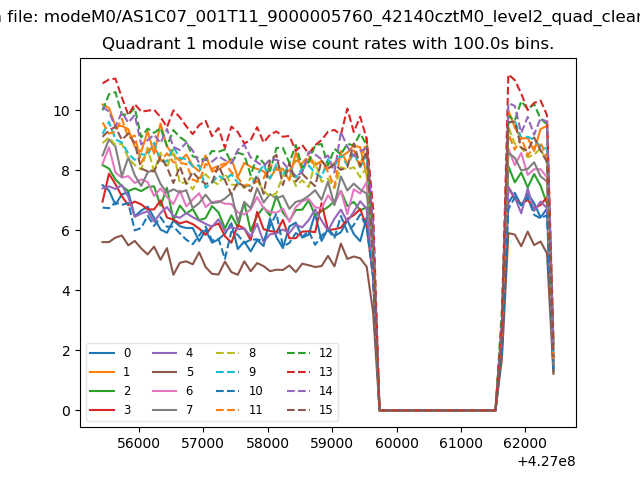
| Module-wise count rates for Quadrant C Data is divided into 100 sec bins |
 |
 |
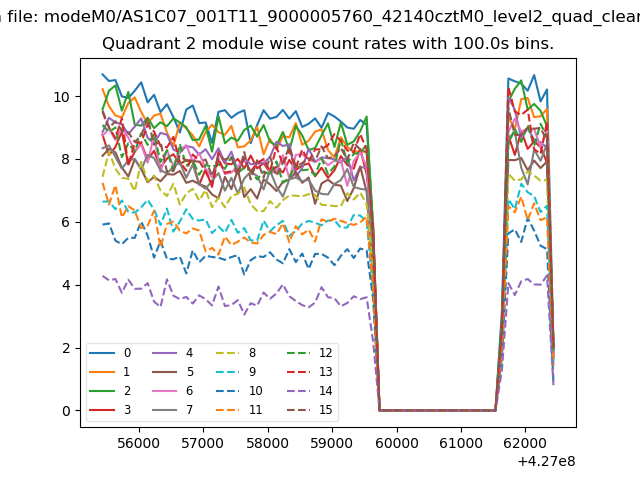
| Module-wise count rates for Quadrant D Data is divided into 100 sec bins |
 |
 |
| Parameter | Plot |
|---|---|
| CZT HV Monitor | 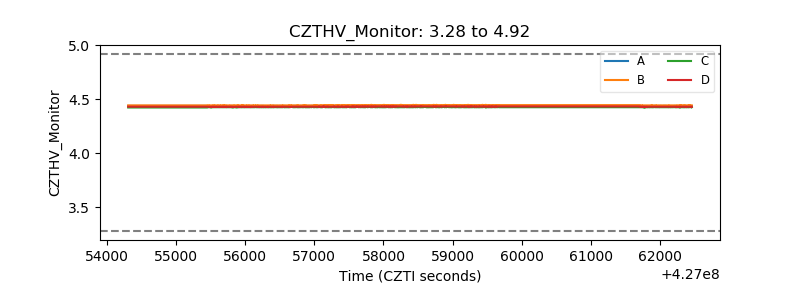 |
| D_VDD | 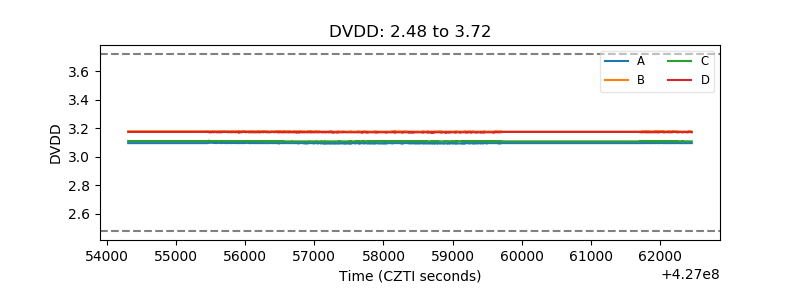 |
| Temperature 1 |  |
| Veto HV Monitor | 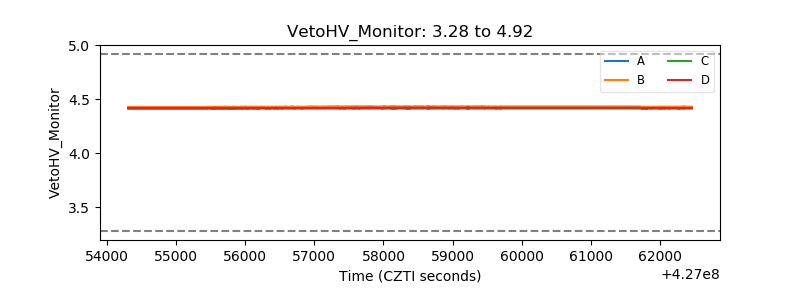 |
| Veto LLD | 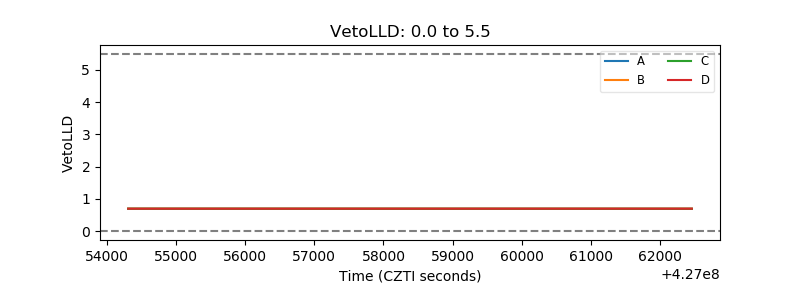 |
| Alpha Counter | 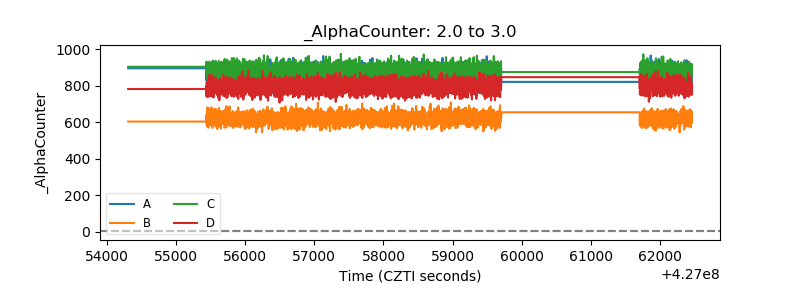 |
| _CPM_Rate | 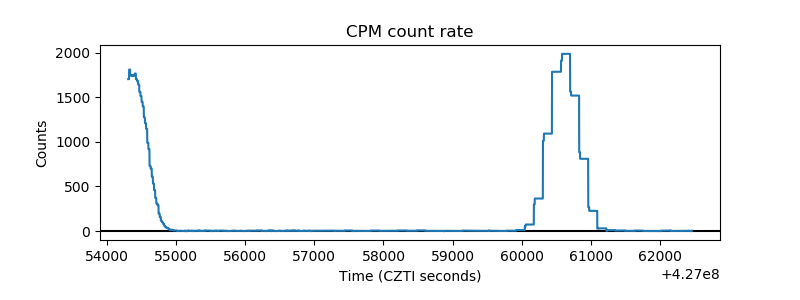 |
| CZT Counter | 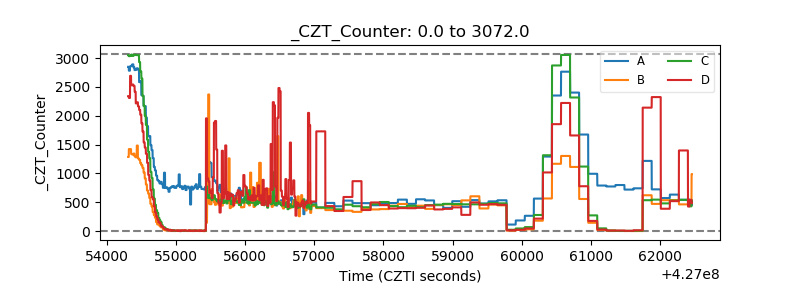 |
| +2.5 Volts monitor | 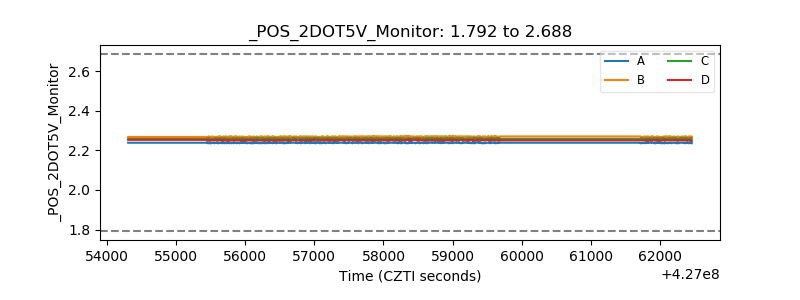 |
| +5 Volts monitor | 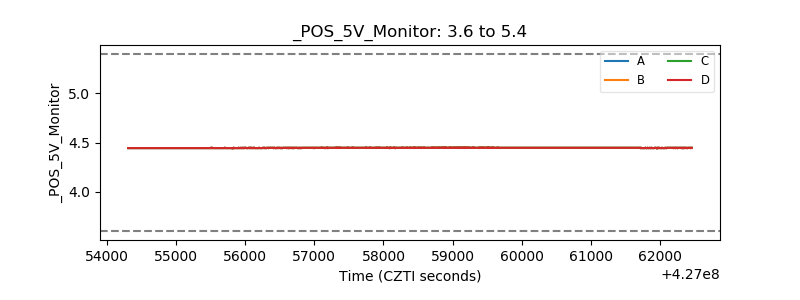 |
| _ROLL_ROT | 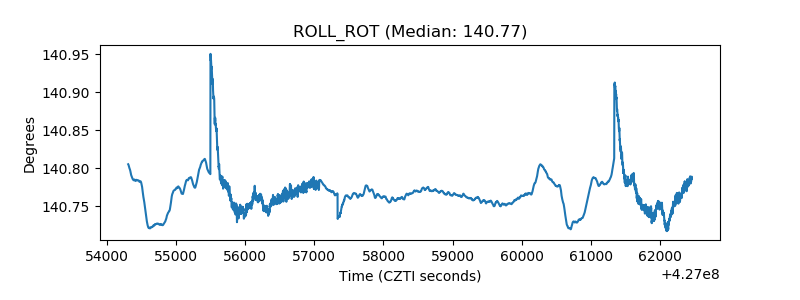 |
| _Roll_DEC | 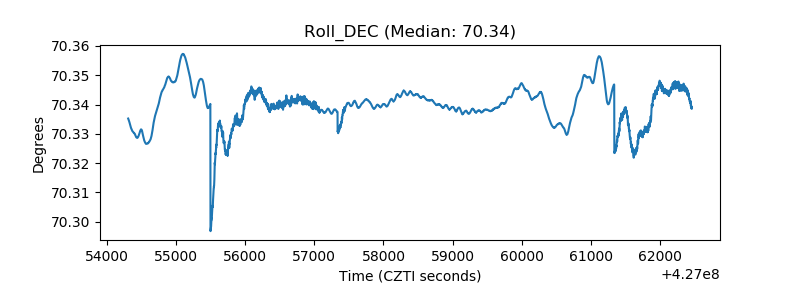 |
| _Roll_RA | 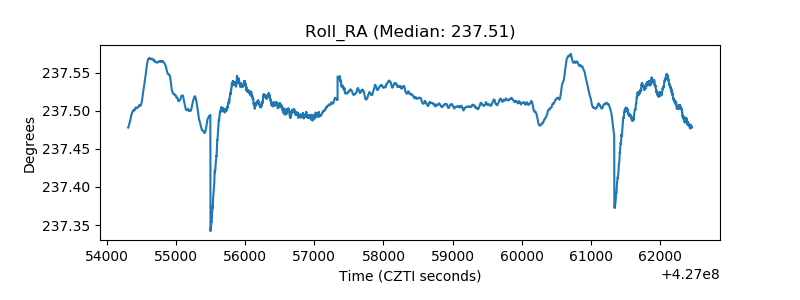 |
| Veto Counter | 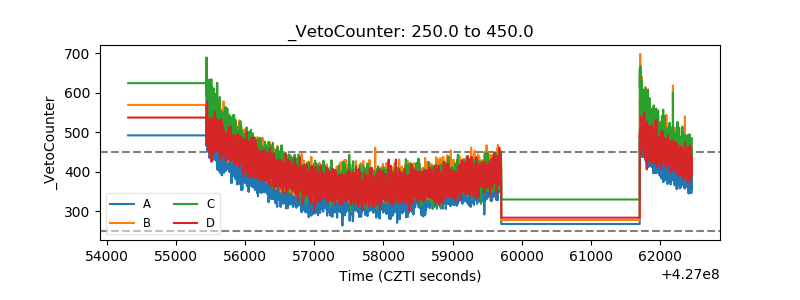 |