| Param | Original file | Final file |
|---|---|---|
| Filename | modeM0/AS1C07_001T11_9000005760_42141cztM0_level2.fits | modeM0/AS1C07_001T11_9000005760_42141cztM0_level2_quad_clean.evt |
| Size (bytes) | 285,583,680 | 85,582,080 |
| Size | 272.4 MB | 81.6 MB |
| Events in quadrant A | 2,641,443 | 568,953 |
| Events in quadrant B | 2,177,835 | 592,108 |
| Events in quadrant C | 2,357,488 | 577,706 |
| Events in quadrant D | 3,013,587 | 510,156 |
| Mode M0 | |||
|---|---|---|---|
| Quadrant | BADHDUFLAG | Total packets | Discarded packets |
| A | 0 | 10852 | 2 |
| B | 0 | 9952 | 2 |
| C | 0 | 10082 | 2 |
| D | 0 | 12379 | 2 |
| Mode M9 | |||
|---|---|---|---|
| Quadrant | BADHDUFLAG | Total packets | Discarded packets |
| A | 0 | 33 | 0 |
| B | 0 | 33 | 0 |
| C | 0 | 34 | 0 |
| D | 0 | 34 | 0 |
| Mode SS | |||
|---|---|---|---|
| Quadrant | BADHDUFLAG | Total packets | Discarded packets |
| A | 0 | 100 | 0 |
| B | 0 | 100 | 0 |
| C | 0 | 100 | 0 |
| D | 0 | 100 | 0 |
| Quadrant | Total seconds | Saturated seconds | Saturation percentage |
|---|---|---|---|
| A | 4882 | 25 | 0.512085% |
| B | 4882 | 11 | 0.225317% |
| C | 4882 | 28 | 0.573535% |
| D | 4882 | 190 | 3.891848% |
Noise dominated data is calculated using 1-second bins in cleaned event files. If a bin has >2000 counts, and if more than 50% of those come from <1% of pixels, then it is considered to be noise-dominated and hence unusable.
| Quadrant | # 1 sec bins | Bins with >0 counts | Bins with >2000 counts | High rate bins dominated by noise | Noise dominated (total time) | Noise dominated (detector-on time) | Marked lightcurve |
|---|---|---|---|---|---|---|---|
| A | 6975 | 4883 | 12 | 12 | 0.17% | 0.25% | 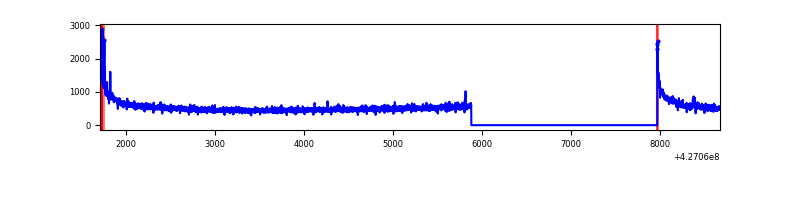 |
| B | 6975 | 4883 | 7 | 7 | 0.10% | 0.14% | 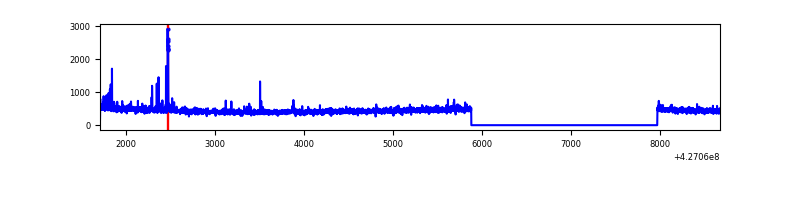 |
| C | 6975 | 4883 | 23 | 23 | 0.33% | 0.47% | 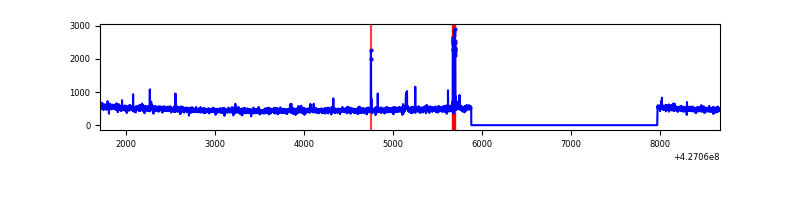 |
| D | 6975 | 4883 | 161 | 161 | 2.31% | 3.30% | 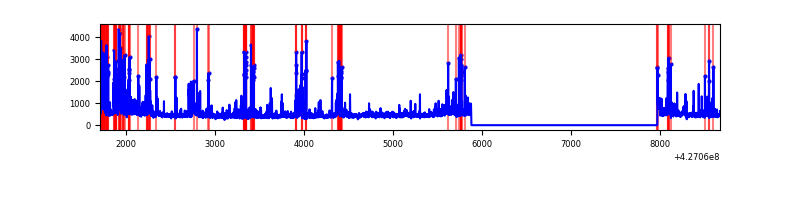 |
Top three noisy pixels from each quadrant. If the there are fewer than three noisy pixels in the level2.evt file, extra rows are filled as -1
| Pixel properties | Quadrant properties | ||||||
|---|---|---|---|---|---|---|---|
| Quadrant | DetID | PixID | Counts | Sigma | Mean | Median | Sigma |
| A | 10 | 83 | 529757 | 4944.78 | 530 | 520 | 107.0 |
| A | 7 | 3 | 27316 | 250.36 | 530 | 520 | 107.0 |
| A | 13 | 6 | 14355 | 129.26 | 530 | 520 | 107.0 |
| B | 0 | 229 | 36647 | 356.79 | 536 | 523 | 101.2 |
| B | 12 | 111 | 12237 | 115.7 | 536 | 523 | 101.2 |
| B | 15 | 35 | 11180 | 105.26 | 536 | 523 | 101.2 |
| C | 15 | 214 | 202700 | 1662.86 | 530 | 534 | 121.6 |
| C | 15 | 111 | 73147 | 597.26 | 530 | 534 | 121.6 |
| C | 12 | 249 | 6451 | 48.67 | 530 | 534 | 121.6 |
| D | 13 | 249 | 273840 | 2174.61 | 514 | 499 | 125.7 |
| D | 1 | 47 | 164658 | 1305.99 | 514 | 499 | 125.7 |
| D | 1 | 52 | 164281 | 1302.99 | 514 | 499 | 125.7 |
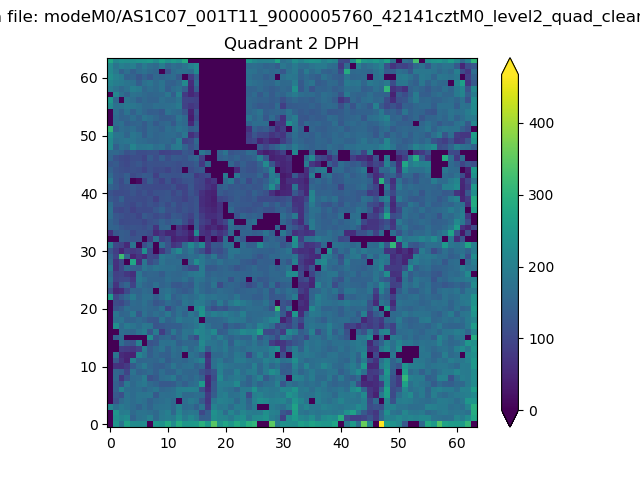
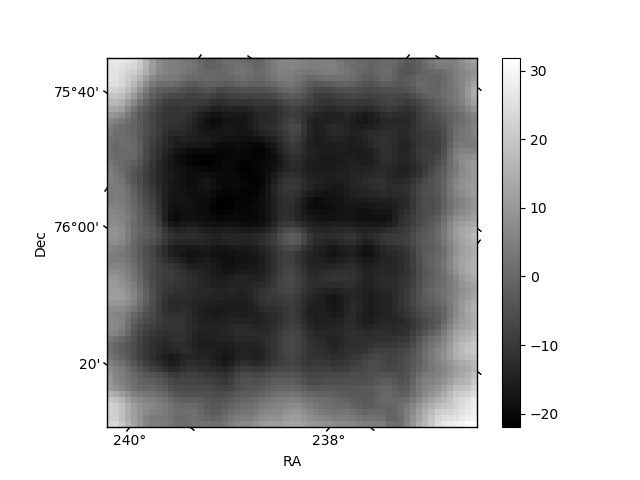
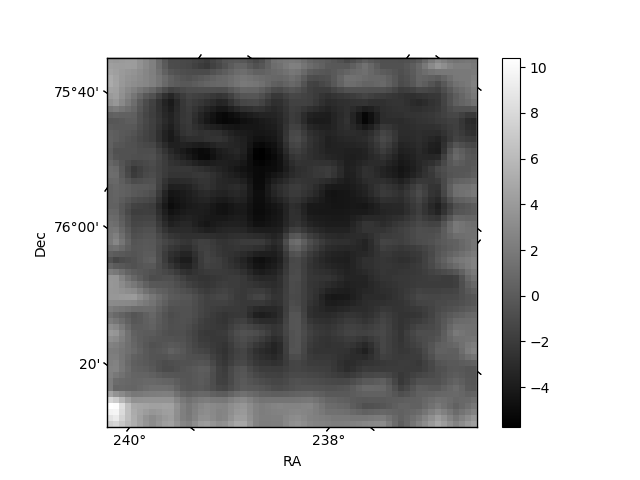
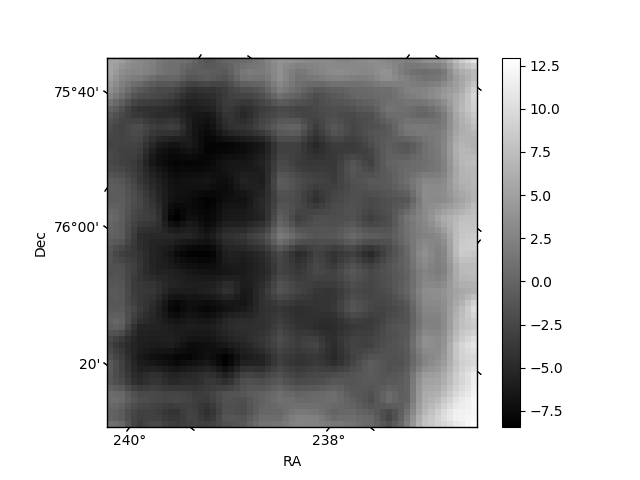
Histogram calculated using DETX and DETY for each event in the final _common_clean file
| Quadrant A | 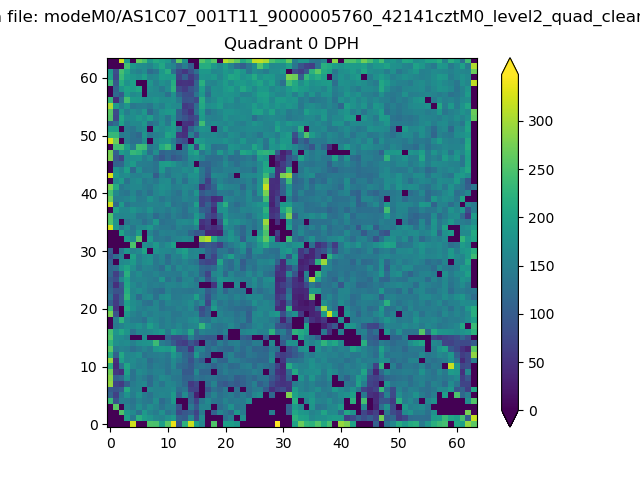 |
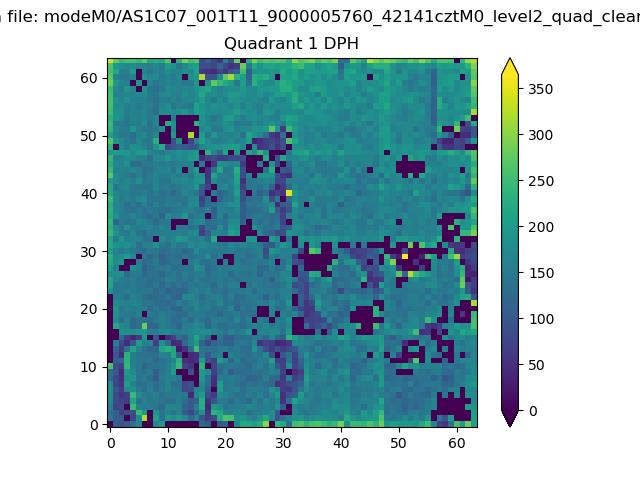 |
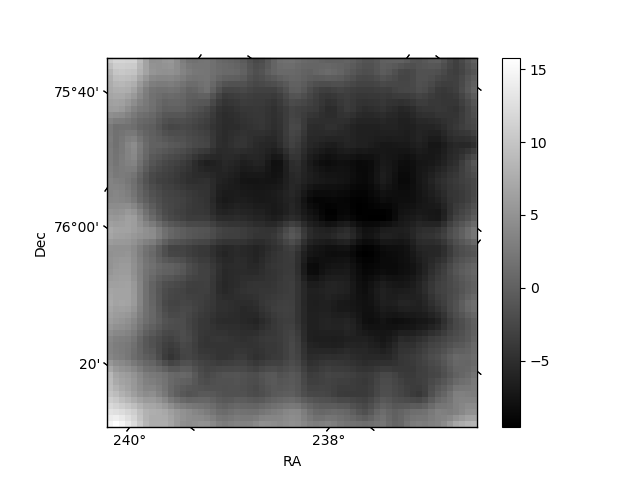
Quadrant B |
|---|---|---|---|
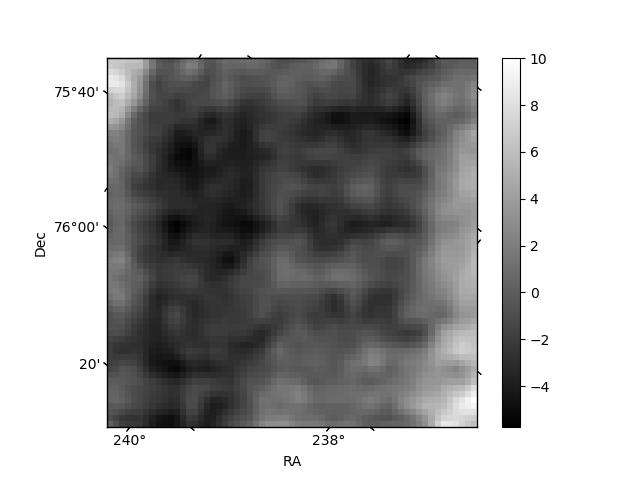
| Quadrant D | 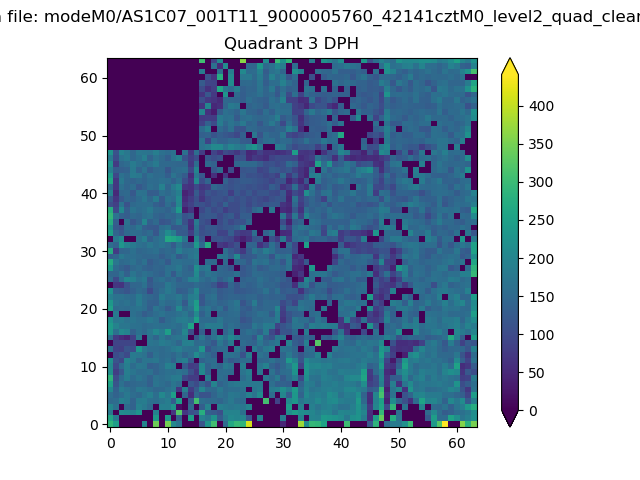 |
 |
Quadrant C |
| Plot type | Count rate plots | Images |
|---|---|---|
| Comparison with Poisson distribution Blue bars denote a histogram of data divided into 1 sec bins. Red curve is a Poisson curve with rate = median count rate of data. |
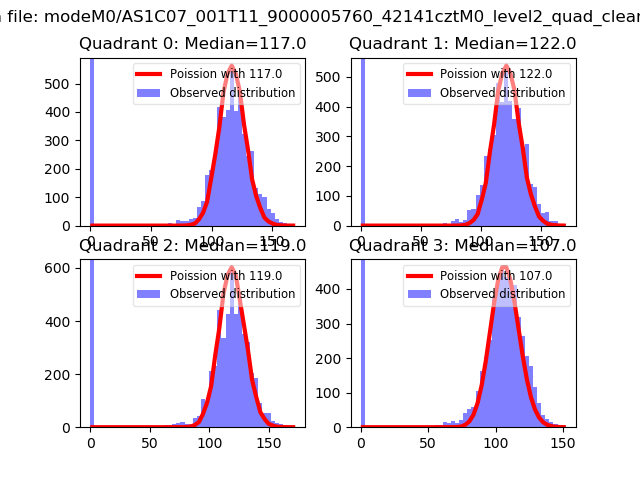 |
 |
| Quadrant-wise count rates Data is divided into 100 sec bins |
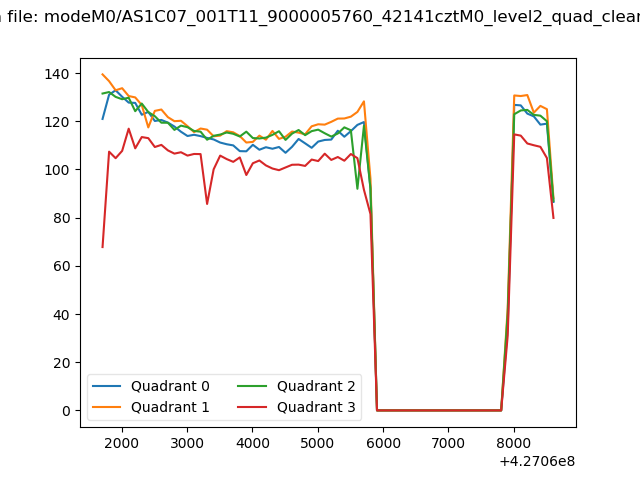 |
|
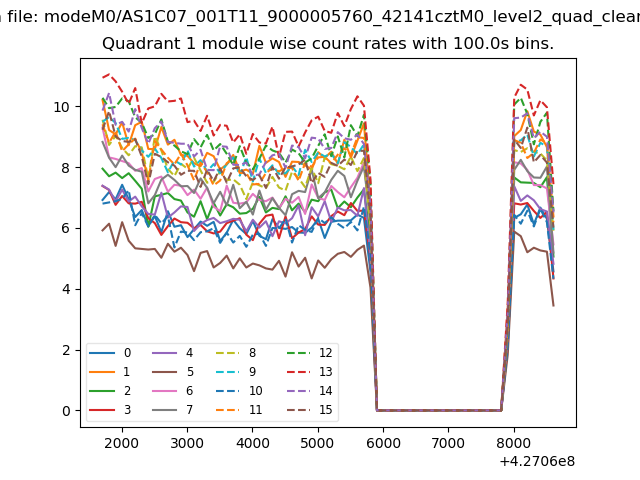
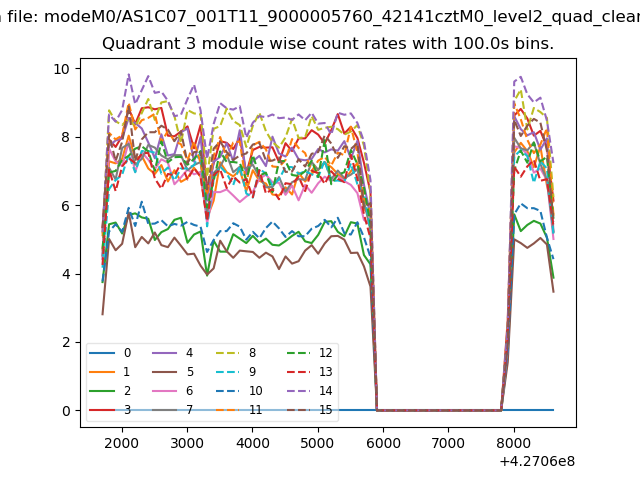
| Module-wise count rates for Quadrant A Data is divided into 100 sec bins |
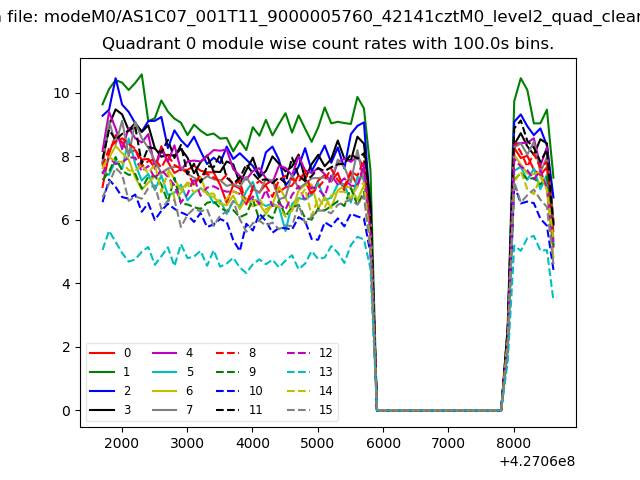 |
 |
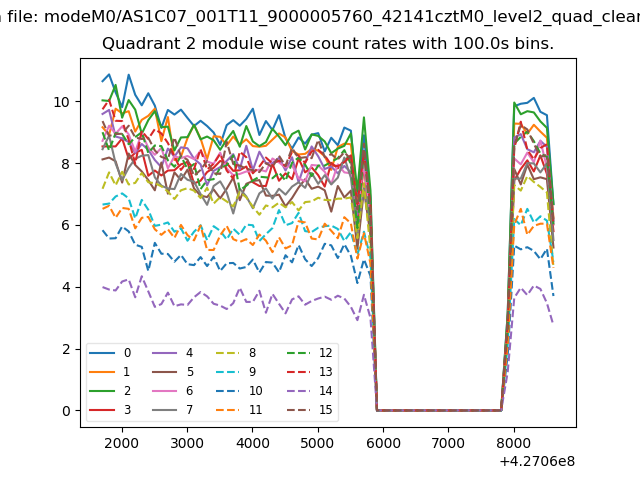
| Module-wise count rates for Quadrant B Data is divided into 100 sec bins |
 |
 |
| Module-wise count rates for Quadrant C Data is divided into 100 sec bins |
 |
 |
| Module-wise count rates for Quadrant D Data is divided into 100 sec bins |
 |
 |
| Parameter | Plot |
|---|---|
| CZT HV Monitor | 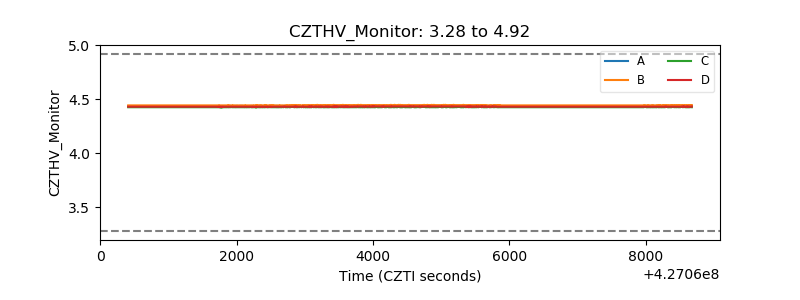 |
| D_VDD | 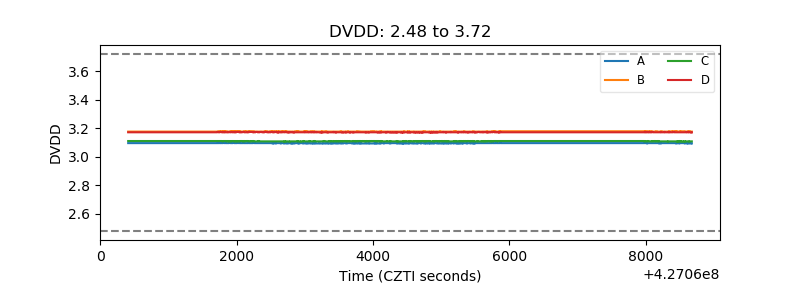 |
| Temperature 1 | 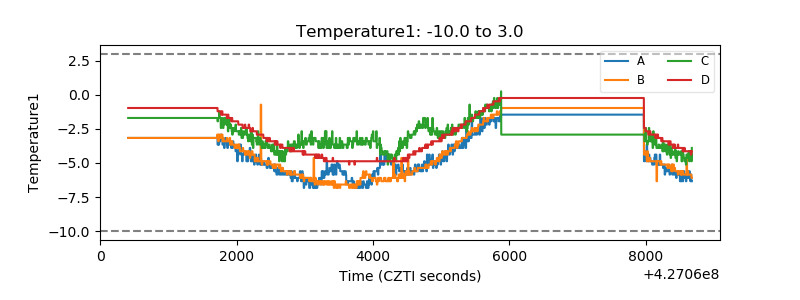 |
| Veto HV Monitor | 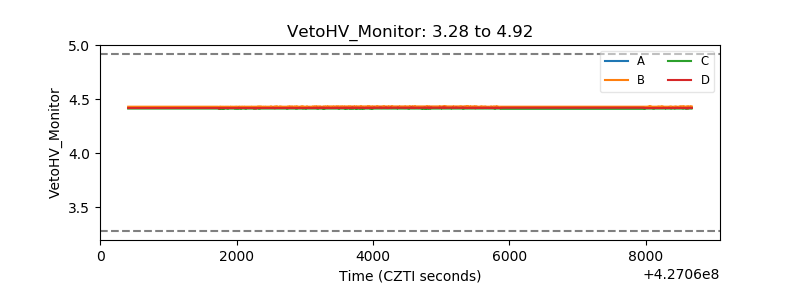 |
| Veto LLD | 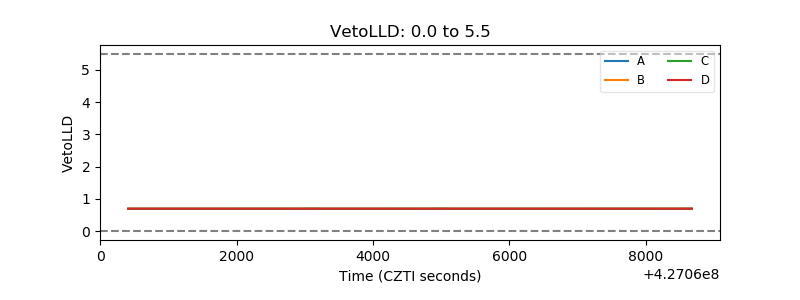 |
| Alpha Counter | 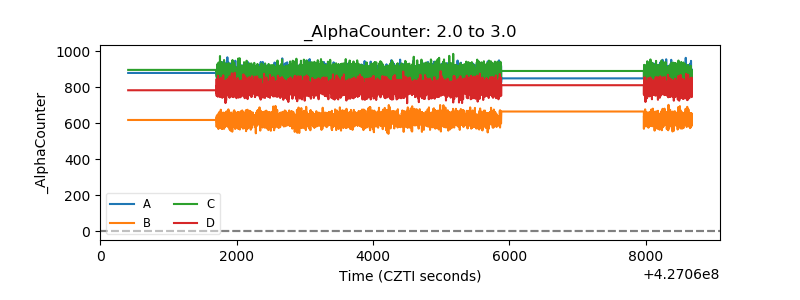 |
| _CPM_Rate | 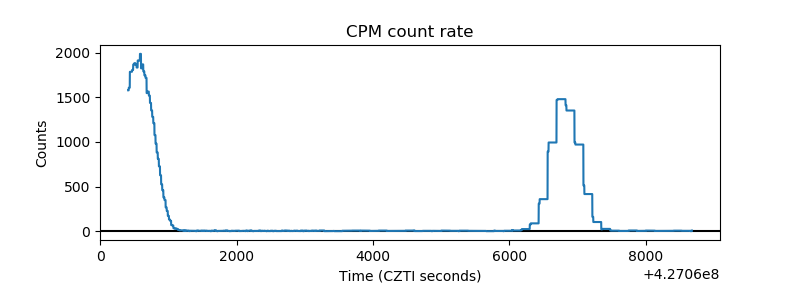 |
| CZT Counter | 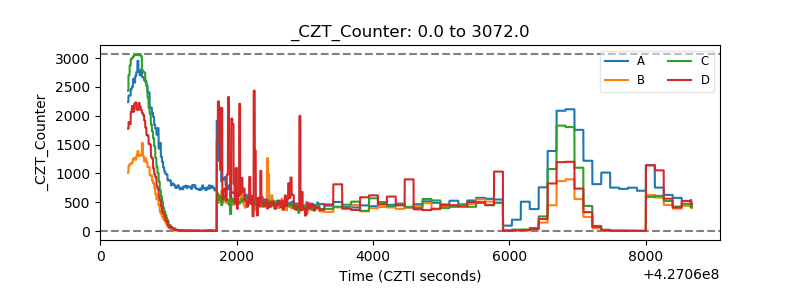 |
| +2.5 Volts monitor | 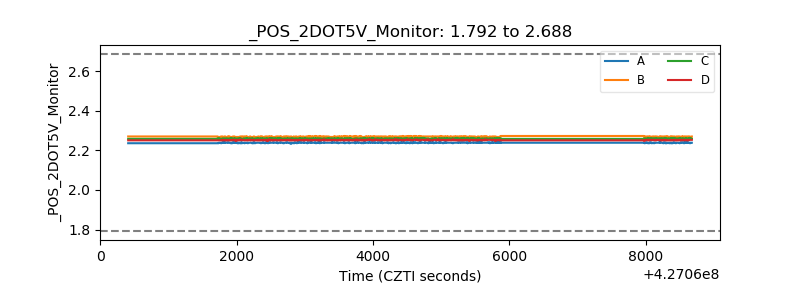 |
| +5 Volts monitor | 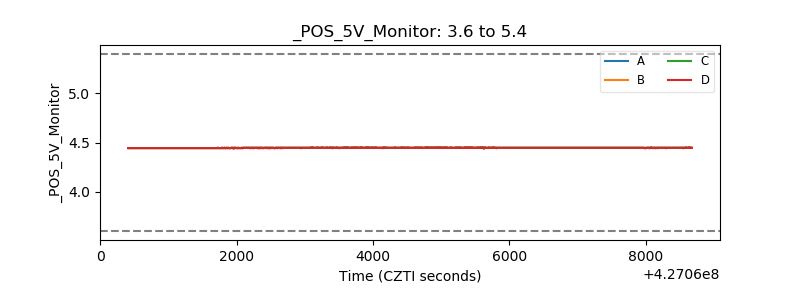 |
| _ROLL_ROT | 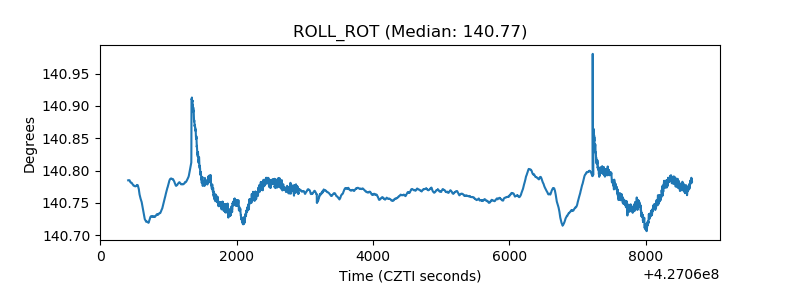 |
| _Roll_DEC | 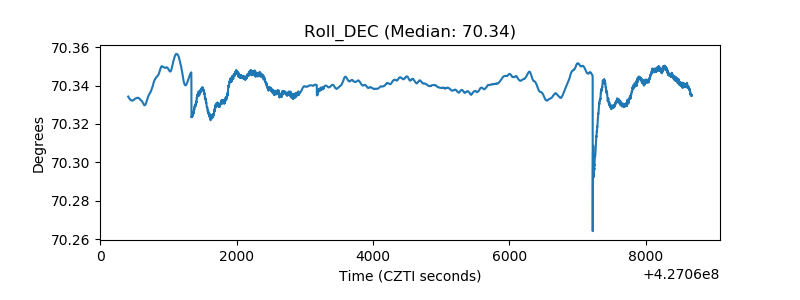 |
| _Roll_RA | 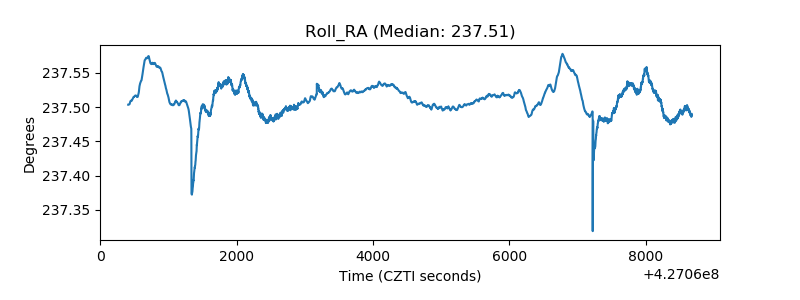 |
| Veto Counter | 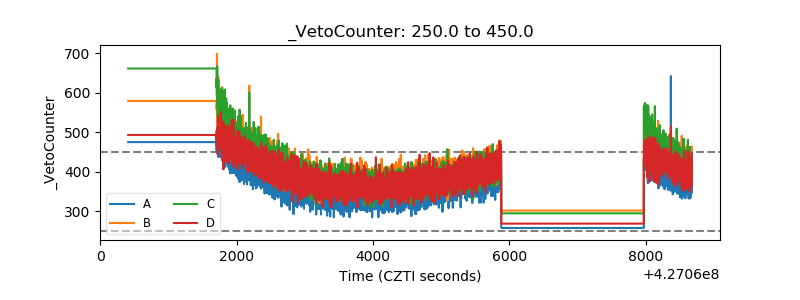 |