| Param | Original file | Final file |
|---|---|---|
| Filename | modeM0/AS1C07_001T11_9000005760_42143cztM0_level2.fits | modeM0/AS1C07_001T11_9000005760_42143cztM0_level2_quad_clean.evt |
| Size (bytes) | 285,122,880 | 81,783,360 |
| Size | 271.9 MB | 78.0 MB |
| Events in quadrant A | 2,560,810 | 540,787 |
| Events in quadrant B | 2,343,152 | 559,206 |
| Events in quadrant C | 2,218,887 | 545,429 |
| Events in quadrant D | 3,046,020 | 484,401 |
| Mode M0 | |||
|---|---|---|---|
| Quadrant | BADHDUFLAG | Total packets | Discarded packets |
| A | 0 | 10688 | 2 |
| B | 0 | 10581 | 2 |
| C | 0 | 9936 | 2 |
| D | 0 | 12778 | 2 |
| Mode M9 | |||
|---|---|---|---|
| Quadrant | BADHDUFLAG | Total packets | Discarded packets |
| A | 0 | 34 | 0 |
| B | 0 | 34 | 0 |
| C | 0 | 35 | 0 |
| D | 0 | 35 | 0 |
| Mode SS | |||
|---|---|---|---|
| Quadrant | BADHDUFLAG | Total packets | Discarded packets |
| A | 0 | 102 | 0 |
| B | 0 | 102 | 0 |
| C | 0 | 102 | 0 |
| D | 0 | 102 | 0 |
| Quadrant | Total seconds | Saturated seconds | Saturation percentage |
|---|---|---|---|
| A | 4937 | 8 | 0.162042% |
| B | 4937 | 29 | 0.587401% |
| C | 4937 | 5 | 0.101276% |
| D | 4937 | 197 | 3.990277% |
Noise dominated data is calculated using 1-second bins in cleaned event files. If a bin has >2000 counts, and if more than 50% of those come from <1% of pixels, then it is considered to be noise-dominated and hence unusable.
| Quadrant | # 1 sec bins | Bins with >0 counts | Bins with >2000 counts | High rate bins dominated by noise | Noise dominated (total time) | Noise dominated (detector-on time) | Marked lightcurve |
|---|---|---|---|---|---|---|---|
| A | 7000 | 4938 | 4 | 4 | 0.06% | 0.08% | 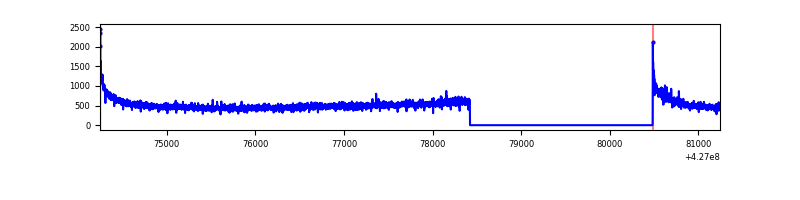 |
| B | 7000 | 4938 | 19 | 19 | 0.27% | 0.38% | 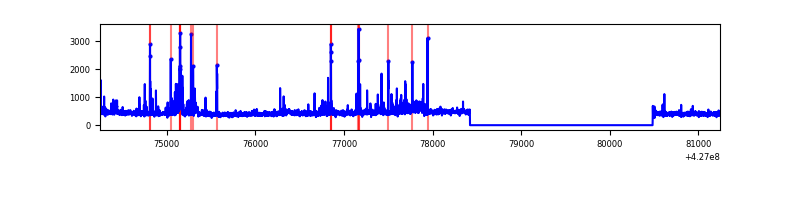 |
| C | 7000 | 4938 | 0 | 0 | 0.00% | 0.00% | 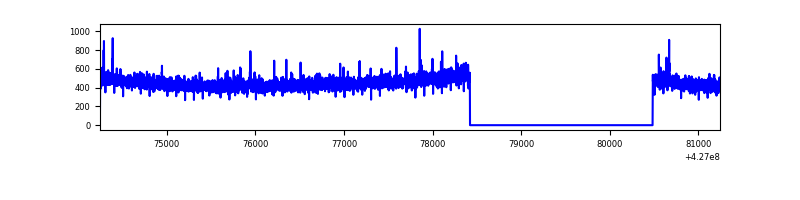 |
| D | 7000 | 4938 | 163 | 163 | 2.33% | 3.30% | 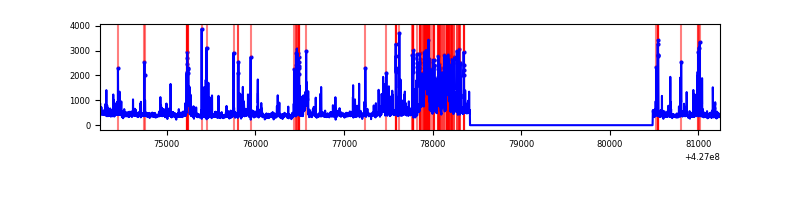 |
Top three noisy pixels from each quadrant. If the there are fewer than three noisy pixels in the level2.evt file, extra rows are filled as -1
| Pixel properties | Quadrant properties | ||||||
|---|---|---|---|---|---|---|---|
| Quadrant | DetID | PixID | Counts | Sigma | Mean | Median | Sigma |
| A | 10 | 83 | 519359 | 4860.29 | 518 | 507 | 106.8 |
| A | 13 | 6 | 20558 | 187.83 | 518 | 507 | 106.8 |
| A | 12 | 189 | 18956 | 172.82 | 518 | 507 | 106.8 |
| B | 0 | 229 | 172934 | 1732.33 | 518 | 504 | 99.5 |
| B | 5 | 255 | 78996 | 788.58 | 518 | 504 | 99.5 |
| B | 3 | 112 | 51020 | 507.51 | 518 | 504 | 99.5 |
| C | 15 | 214 | 206035 | 1723.53 | 511 | 513 | 119.2 |
| C | 15 | 111 | 6724 | 52.09 | 511 | 513 | 119.2 |
| C | 12 | 249 | 3983 | 29.1 | 511 | 513 | 119.2 |
| D | 12 | 233 | 451063 | 3707.48 | 496 | 481 | 121.5 |
| D | 1 | 52 | 188547 | 1547.45 | 496 | 481 | 121.5 |
| D | 13 | 249 | 150126 | 1231.31 | 496 | 481 | 121.5 |
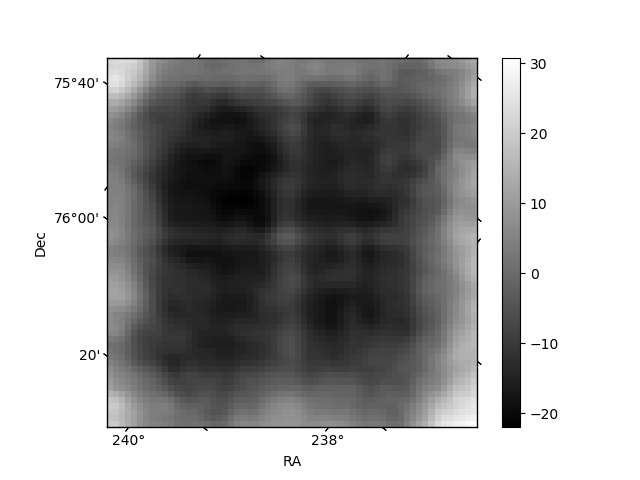
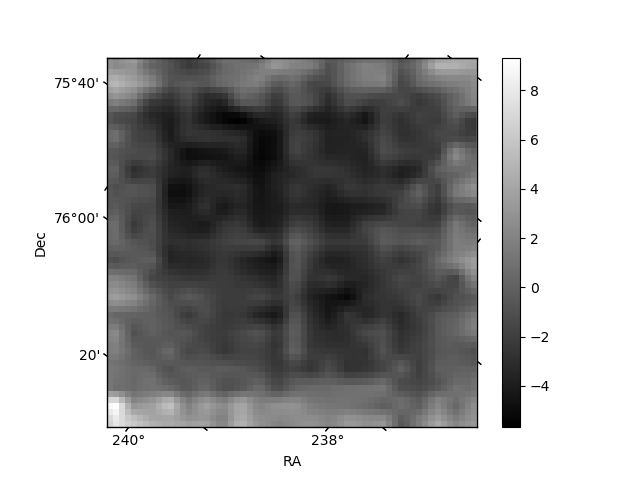
Histogram calculated using DETX and DETY for each event in the final _common_clean file
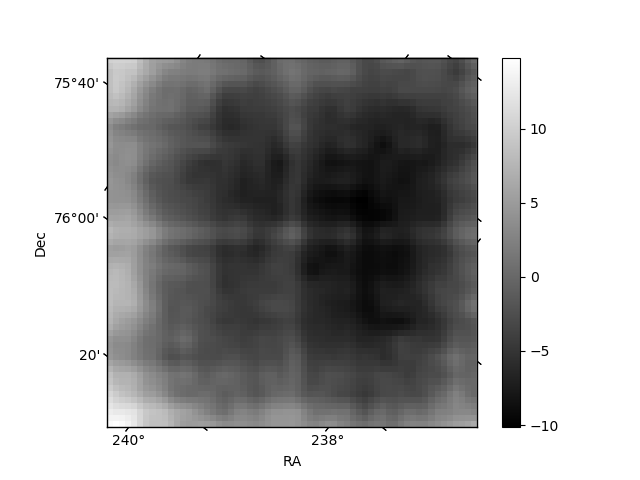
| Quadrant A | 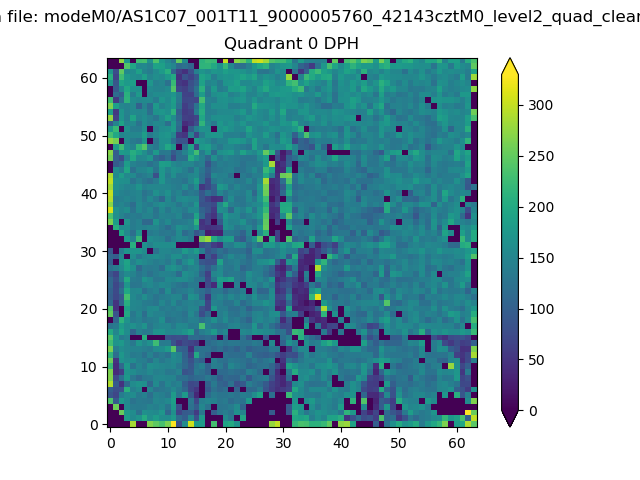 |
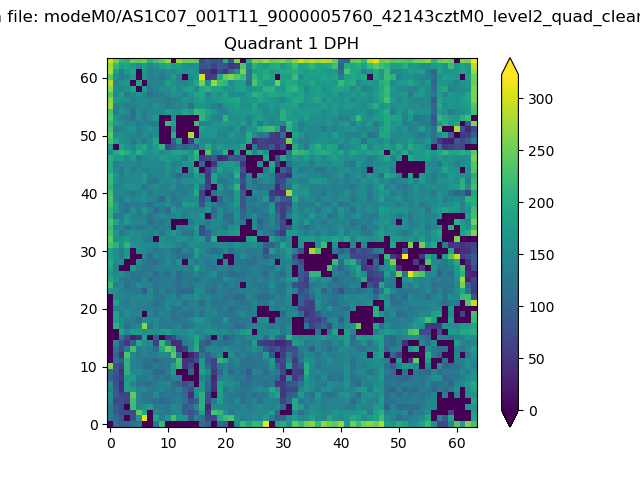 |
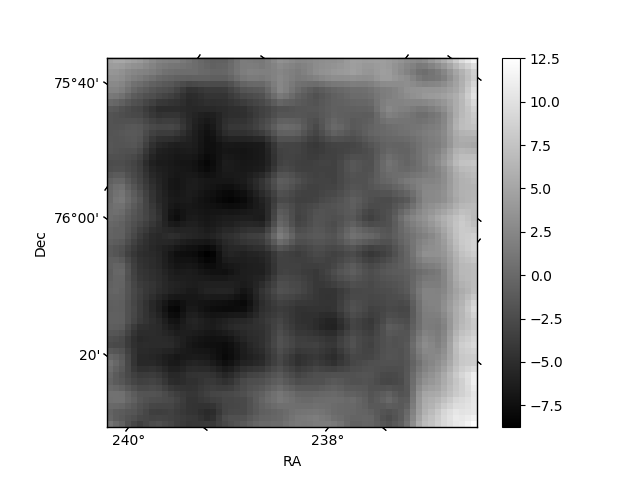
Quadrant B |
|---|---|---|---|
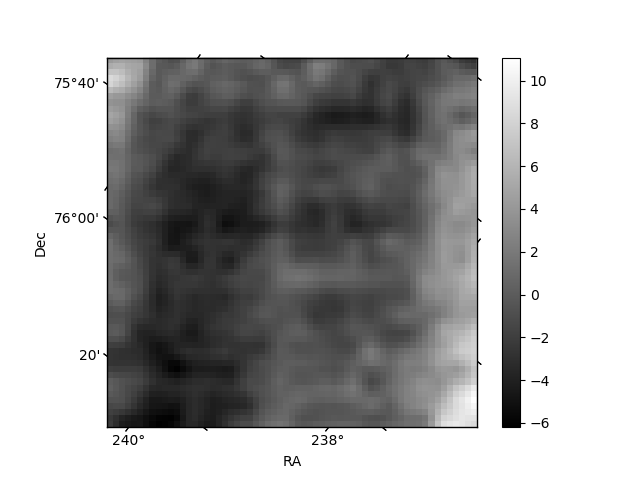
| Quadrant D | 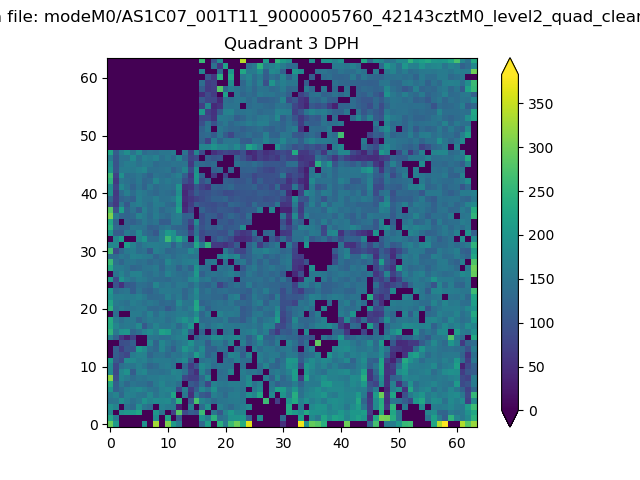 |
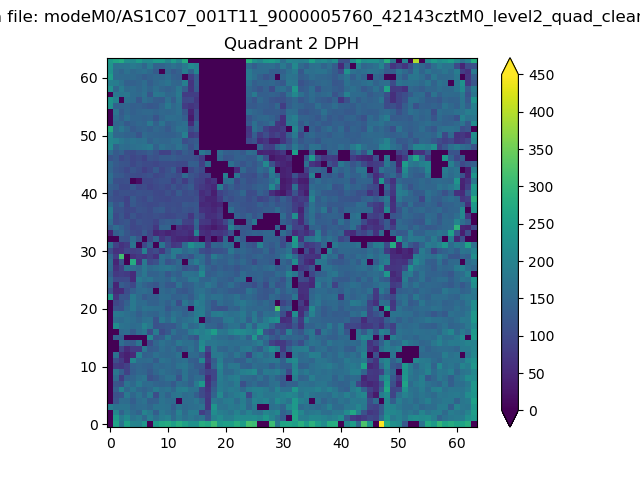 |
Quadrant C |
| Plot type | Count rate plots | Images |
|---|---|---|
| Comparison with Poisson distribution Blue bars denote a histogram of data divided into 1 sec bins. Red curve is a Poisson curve with rate = median count rate of data. |
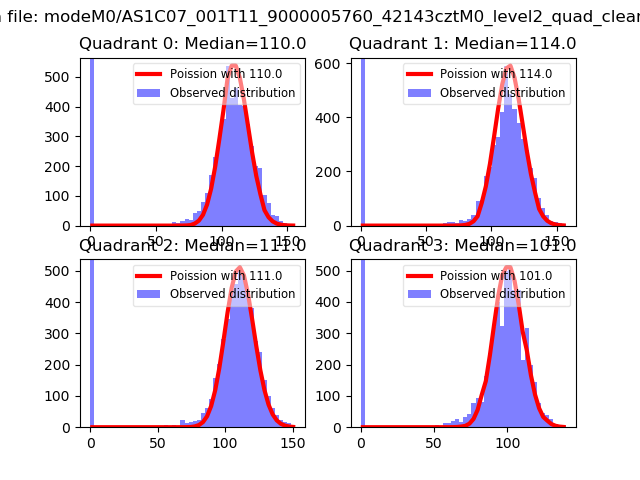 |
 |
| Quadrant-wise count rates Data is divided into 100 sec bins |
 |
|
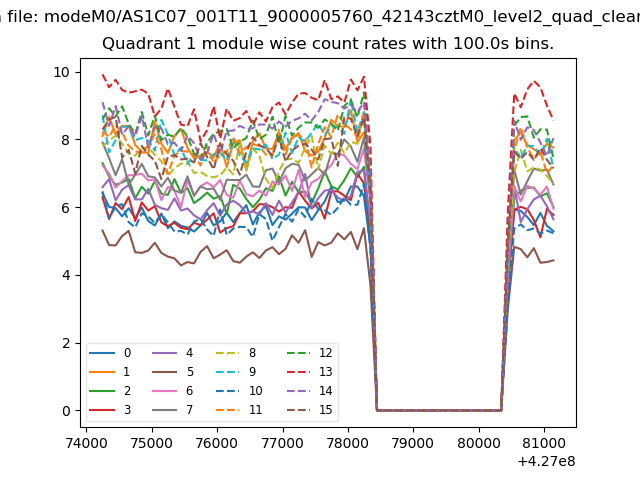
| Module-wise count rates for Quadrant A Data is divided into 100 sec bins |
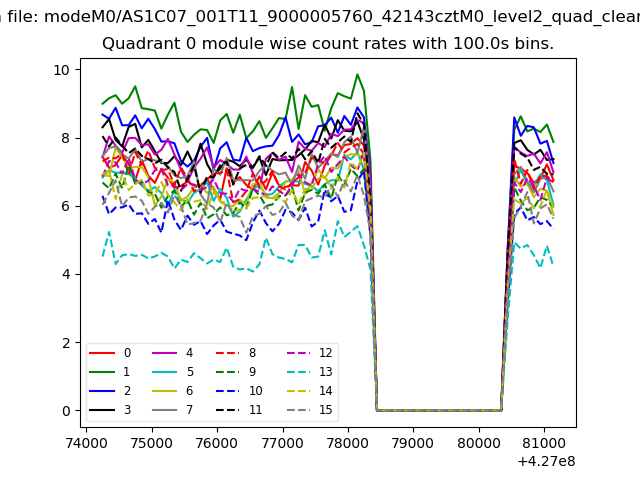 |
 |
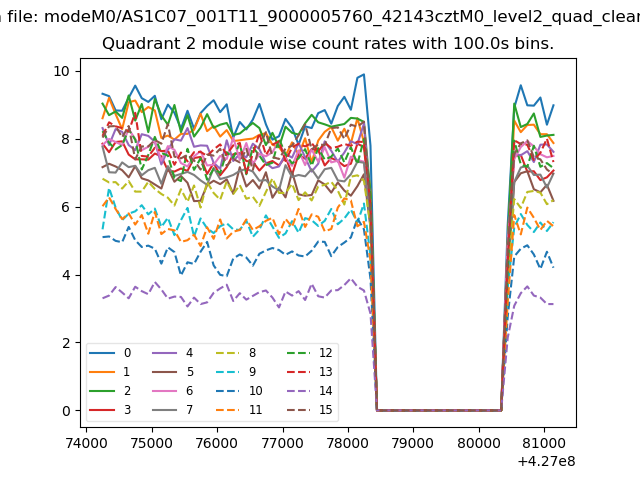
| Module-wise count rates for Quadrant B Data is divided into 100 sec bins |
 |
 |
| Module-wise count rates for Quadrant C Data is divided into 100 sec bins |
 |
 |
| Module-wise count rates for Quadrant D Data is divided into 100 sec bins |
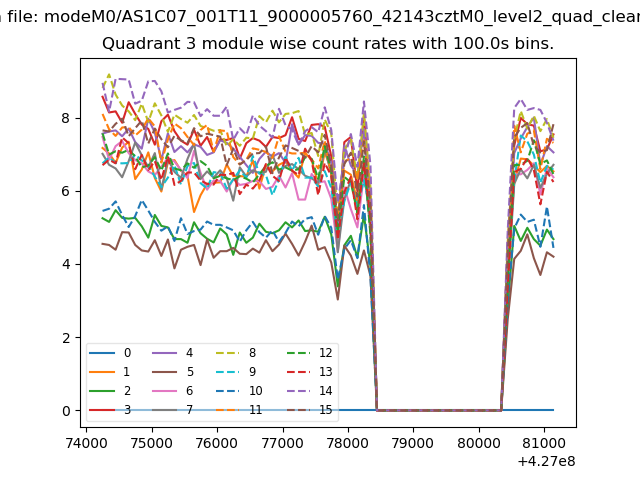 |
 |
| Parameter | Plot |
|---|---|
| CZT HV Monitor | 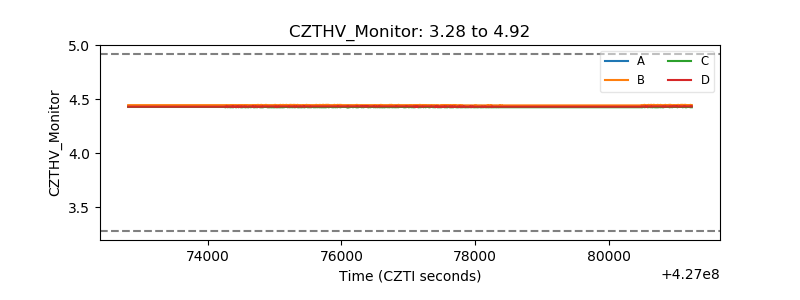 |
| D_VDD | 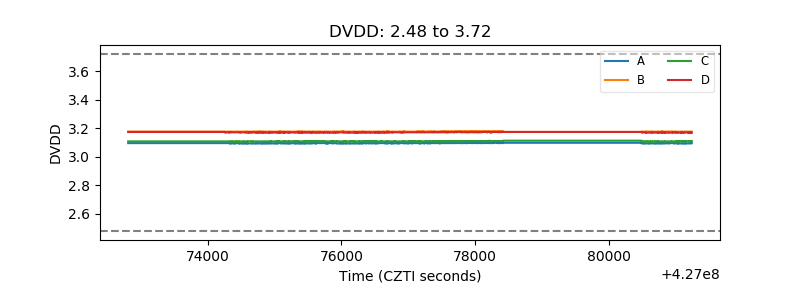 |
| Temperature 1 | 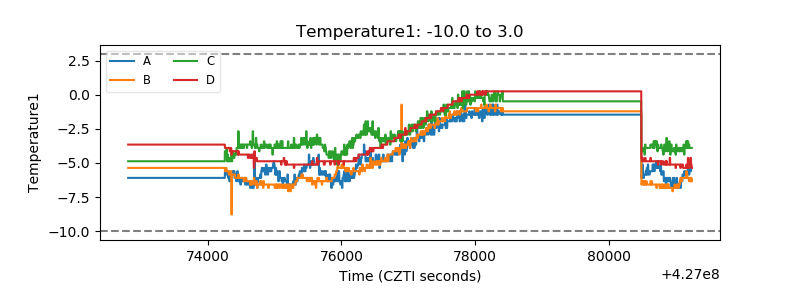 |
| Veto HV Monitor | 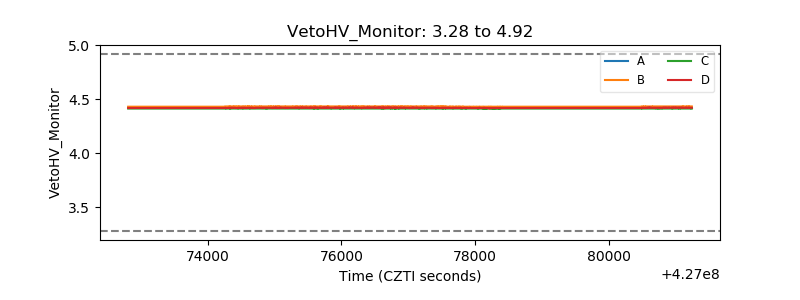 |
| Veto LLD | 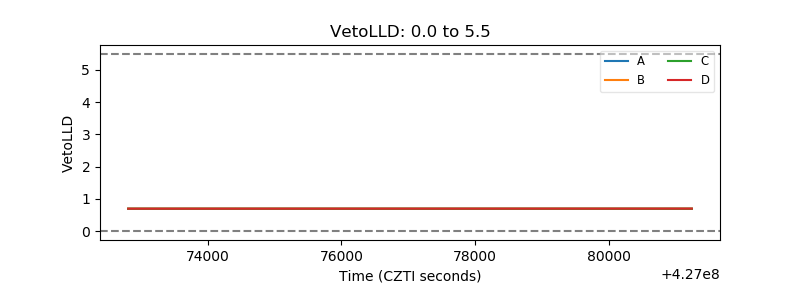 |
| Alpha Counter | 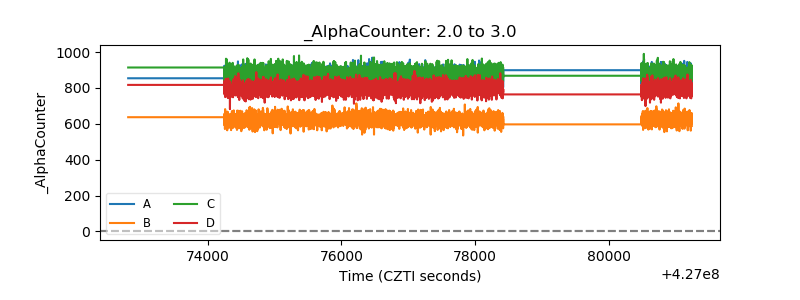 |
| _CPM_Rate | 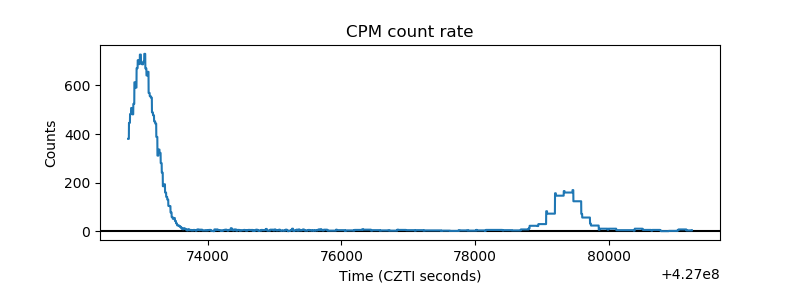 |
| CZT Counter | 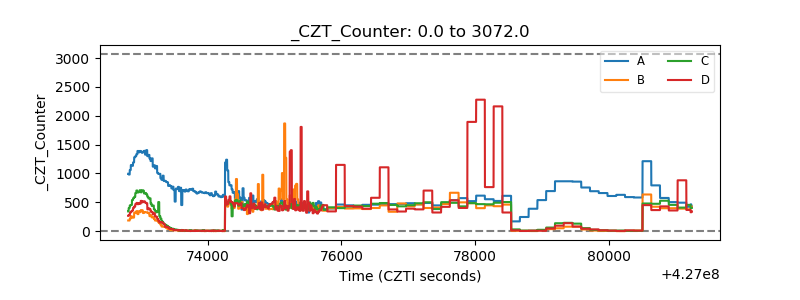 |
| +2.5 Volts monitor | 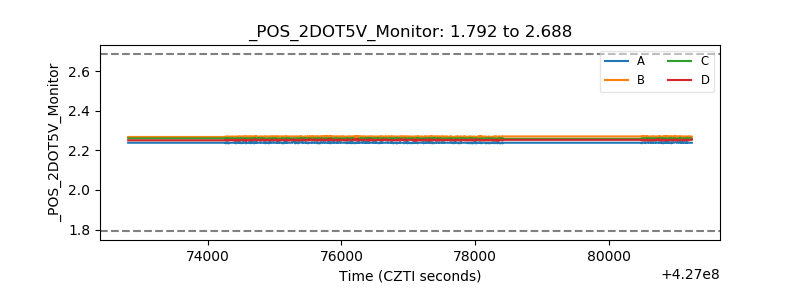 |
| +5 Volts monitor | 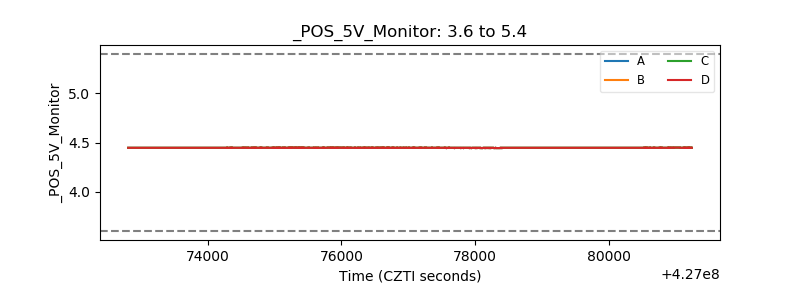 |
| _ROLL_ROT | 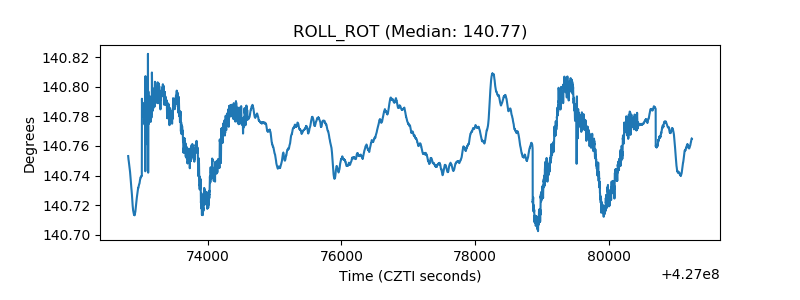 |
| _Roll_DEC |  |
| _Roll_RA | 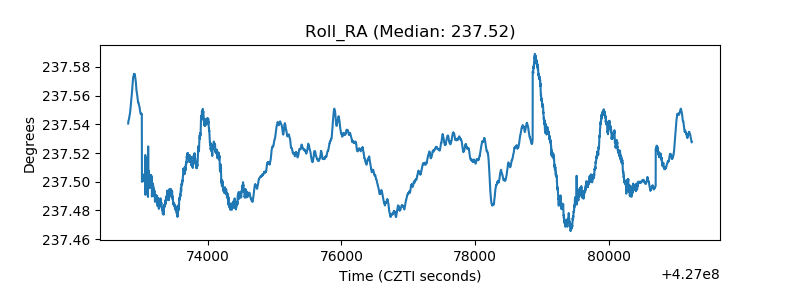 |
| Veto Counter | 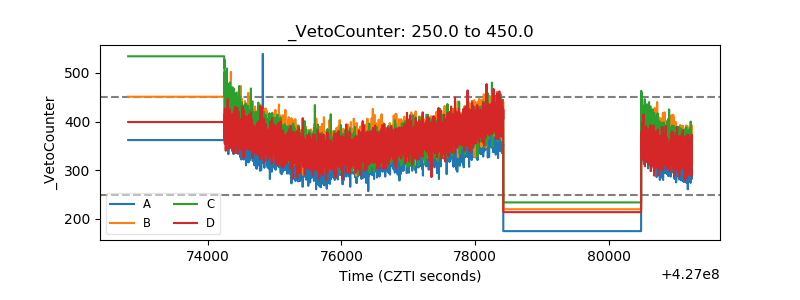 |