| Param | Original file | Final file |
|---|---|---|
| Filename | modeM0/AS1C07_001T11_9000005760_42144cztM0_level2.fits | modeM0/AS1C07_001T11_9000005760_42144cztM0_level2_quad_clean.evt |
| Size (bytes) | 328,101,120 | 86,011,200 |
| Size | 312.9 MB | 82.0 MB |
| Events in quadrant A | 2,821,801 | 575,259 |
| Events in quadrant B | 2,336,856 | 593,639 |
| Events in quadrant C | 2,403,210 | 579,076 |
| Events in quadrant D | 4,161,448 | 477,752 |
| Mode M0 | |||
|---|---|---|---|
| Quadrant | BADHDUFLAG | Total packets | Discarded packets |
| A | 0 | 11704 | 2 |
| B | 0 | 11089 | 2 |
| C | 0 | 10855 | 2 |
| D | 0 | 16537 | 2 |
| Mode M9 | |||
|---|---|---|---|
| Quadrant | BADHDUFLAG | Total packets | Discarded packets |
| A | 0 | 34 | 0 |
| B | 0 | 35 | 0 |
| C | 0 | 35 | 0 |
| D | 0 | 35 | 0 |
| Mode SS | |||
|---|---|---|---|
| Quadrant | BADHDUFLAG | Total packets | Discarded packets |
| A | 0 | 110 | 0 |
| B | 0 | 110 | 0 |
| C | 0 | 110 | 0 |
| D | 0 | 110 | 0 |
| Quadrant | Total seconds | Saturated seconds | Saturation percentage |
|---|---|---|---|
| A | 5409 | 9 | 0.166389% |
| B | 5409 | 12 | 0.221852% |
| C | 5408 | 2 | 0.036982% |
| D | 5408 | 622 | 11.501479% |
Noise dominated data is calculated using 1-second bins in cleaned event files. If a bin has >2000 counts, and if more than 50% of those come from <1% of pixels, then it is considered to be noise-dominated and hence unusable.
| Quadrant | # 1 sec bins | Bins with >0 counts | Bins with >2000 counts | High rate bins dominated by noise | Noise dominated (total time) | Noise dominated (detector-on time) | Marked lightcurve |
|---|---|---|---|---|---|---|---|
| A | 7260 | 5410 | 3 | 3 | 0.04% | 0.06% | 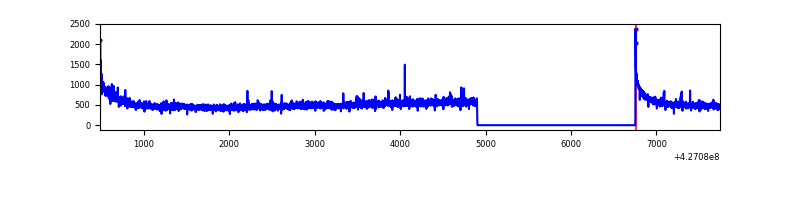 |
| B | 7260 | 5410 | 5 | 5 | 0.07% | 0.09% | 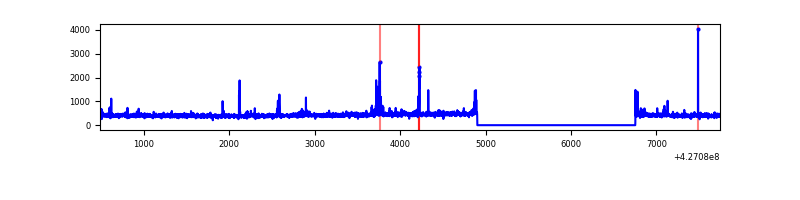 |
| C | 7259 | 5409 | 0 | 0 | 0.00% | 0.00% | 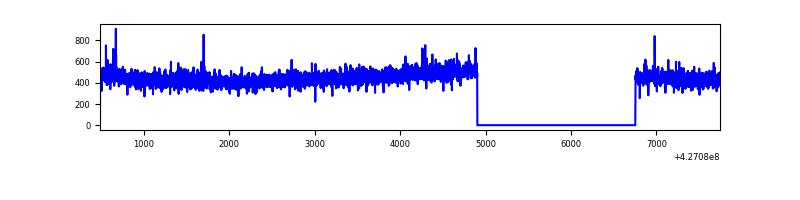 |
| D | 7259 | 5409 | 554 | 554 | 7.63% | 10.24% | 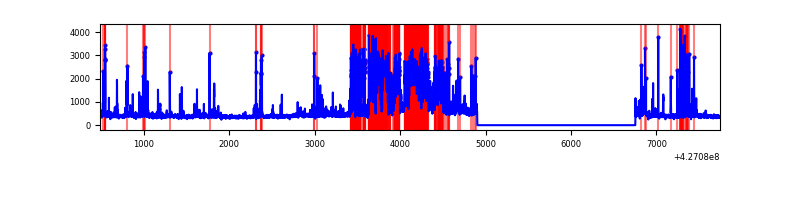 |
Top three noisy pixels from each quadrant. If the there are fewer than three noisy pixels in the level2.evt file, extra rows are filled as -1
| Pixel properties | Quadrant properties | ||||||
|---|---|---|---|---|---|---|---|
| Quadrant | DetID | PixID | Counts | Sigma | Mean | Median | Sigma |
| A | 10 | 83 | 567090 | 4868.65 | 565 | 553 | 116.4 |
| A | 12 | 189 | 44927 | 381.34 | 565 | 553 | 116.4 |
| A | 15 | 223 | 16399 | 136.18 | 565 | 553 | 116.4 |
| B | 5 | 255 | 30470 | 272.42 | 565 | 549 | 109.8 |
| B | 15 | 35 | 22698 | 201.66 | 565 | 549 | 109.8 |
| B | 0 | 229 | 21182 | 187.86 | 565 | 549 | 109.8 |
| C | 15 | 214 | 224489 | 1747.41 | 553 | 558 | 128.2 |
| C | 12 | 249 | 8574 | 62.55 | 553 | 558 | 128.2 |
| C | 8 | 79 | 5087 | 35.34 | 553 | 558 | 128.2 |
| D | 12 | 233 | 1165756 | 9020.16 | 524 | 507 | 129.2 |
| D | 13 | 249 | 614605 | 4753.71 | 524 | 507 | 129.2 |
| D | 12 | 6 | 88738 | 682.99 | 524 | 507 | 129.2 |
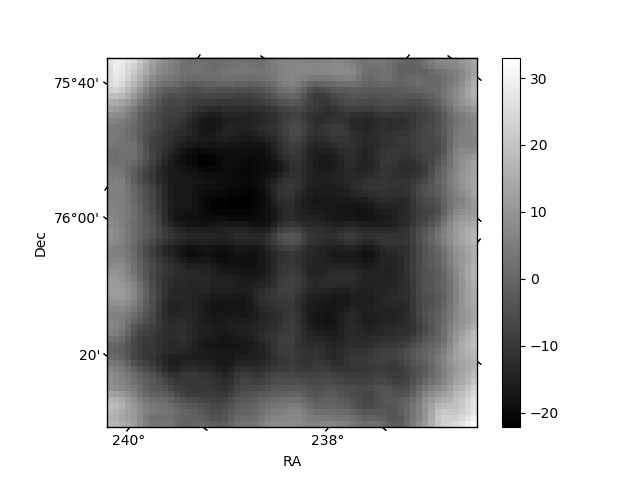
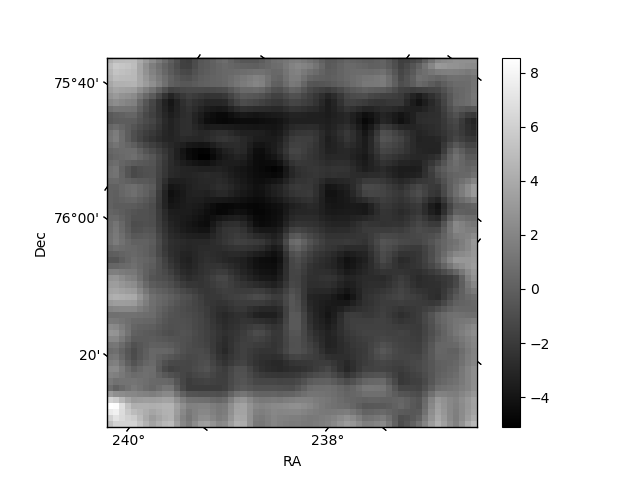
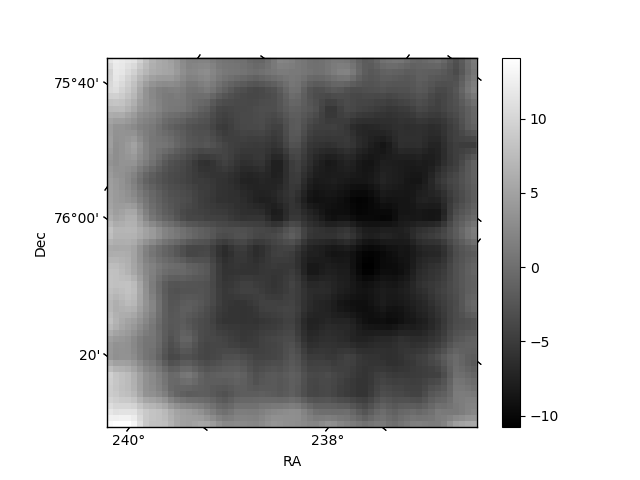
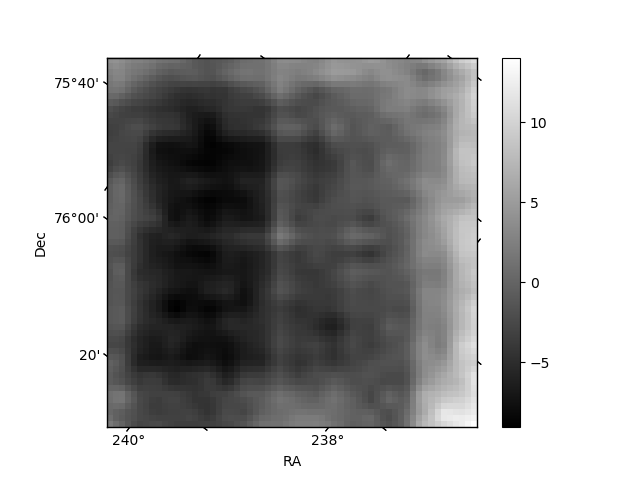
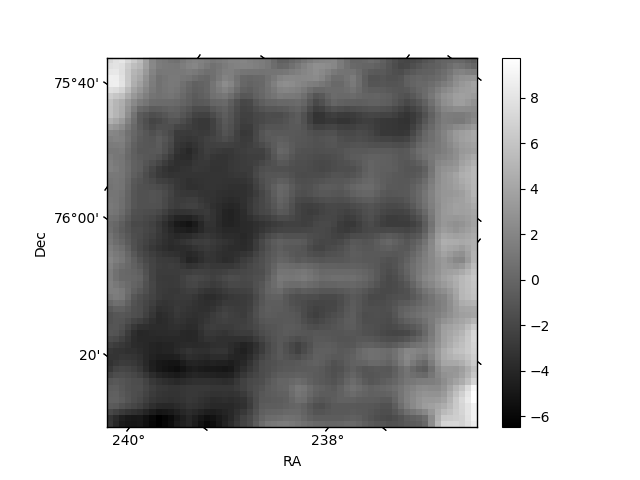
Histogram calculated using DETX and DETY for each event in the final _common_clean file
| Quadrant A | 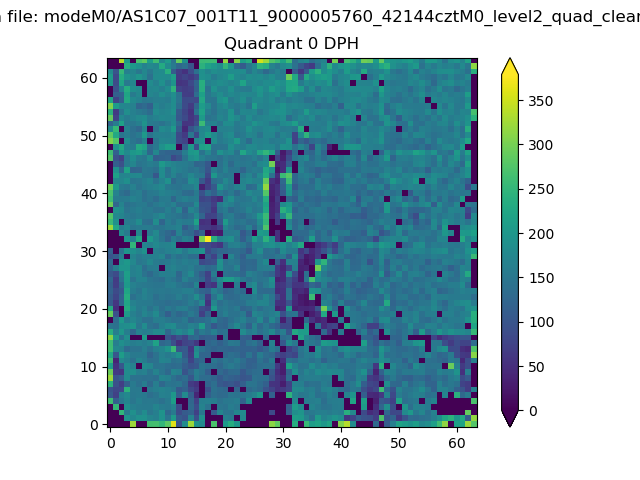 |
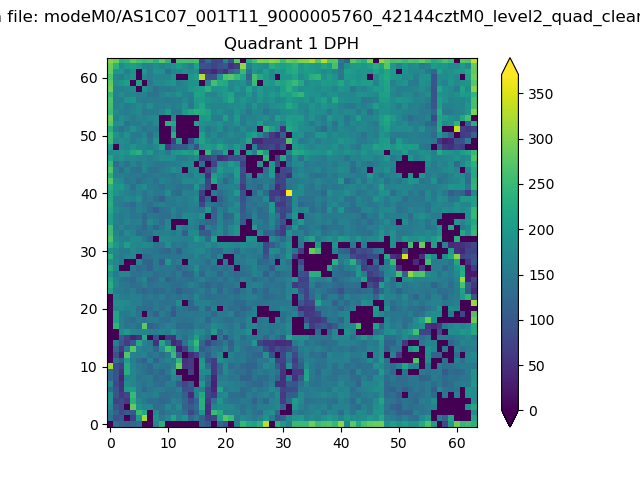 |
Quadrant B |
|---|---|---|---|
| Quadrant D | 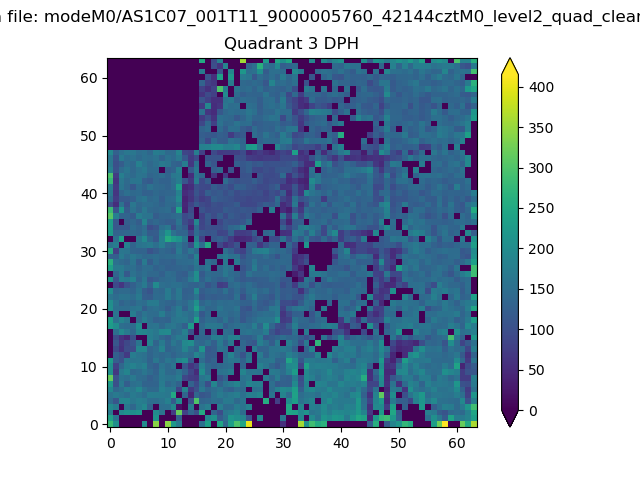 |
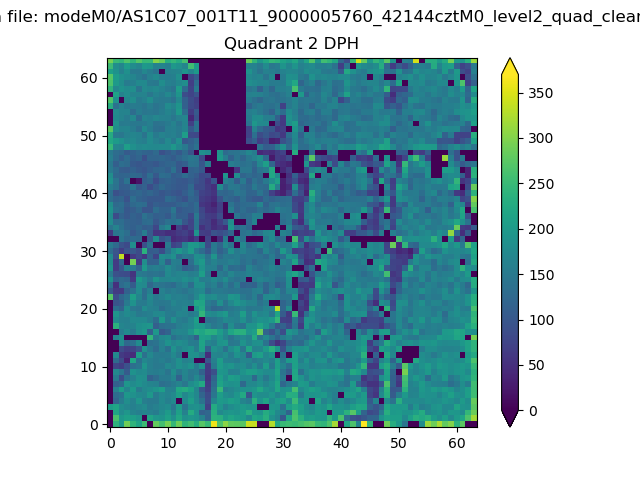 |
Quadrant C |
| Plot type | Count rate plots | Images |
|---|---|---|
| Comparison with Poisson distribution Blue bars denote a histogram of data divided into 1 sec bins. Red curve is a Poisson curve with rate = median count rate of data. |
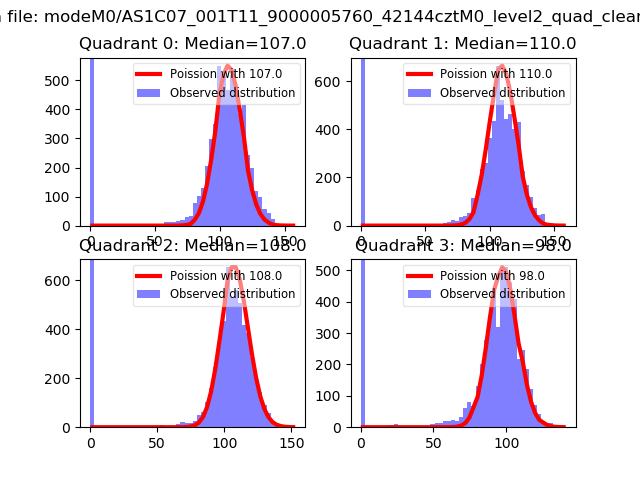 |
 |
| Quadrant-wise count rates Data is divided into 100 sec bins |
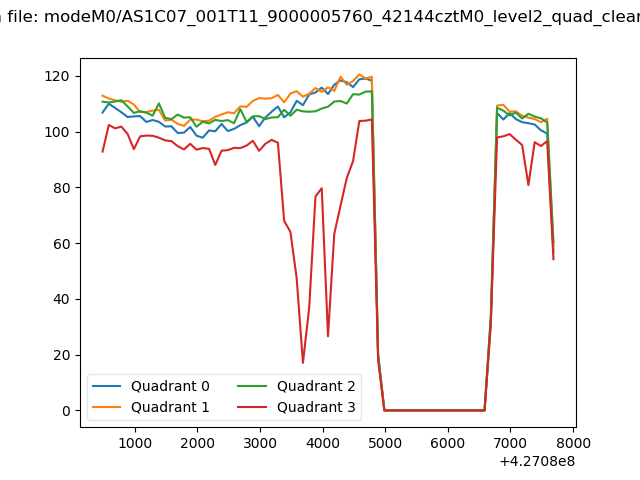 |
|
| Module-wise count rates for Quadrant A Data is divided into 100 sec bins |
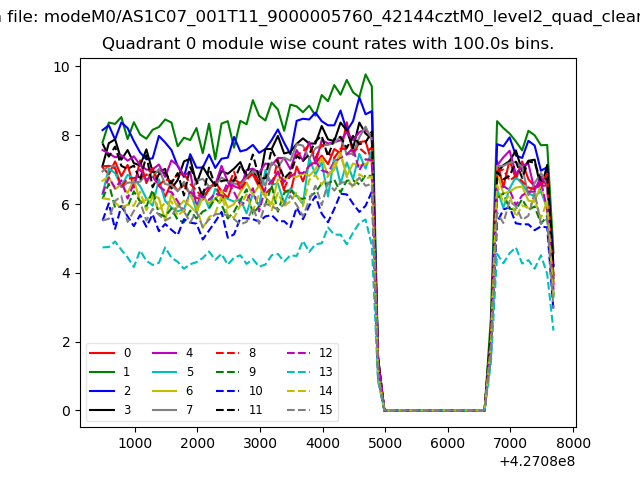 |
 |
| Module-wise count rates for Quadrant B Data is divided into 100 sec bins |
 |
 |
| Module-wise count rates for Quadrant C Data is divided into 100 sec bins |
 |
 |
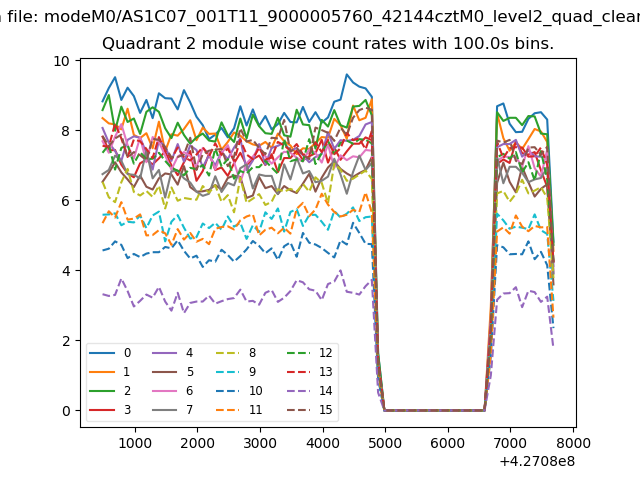
| Module-wise count rates for Quadrant D Data is divided into 100 sec bins |
 |
 |
| Parameter | Plot |
|---|---|
| CZT HV Monitor | 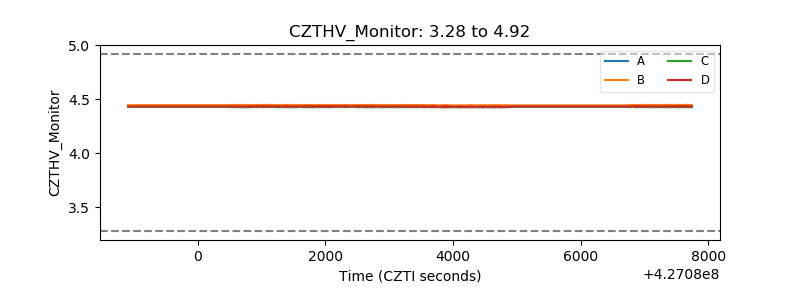 |
| D_VDD | 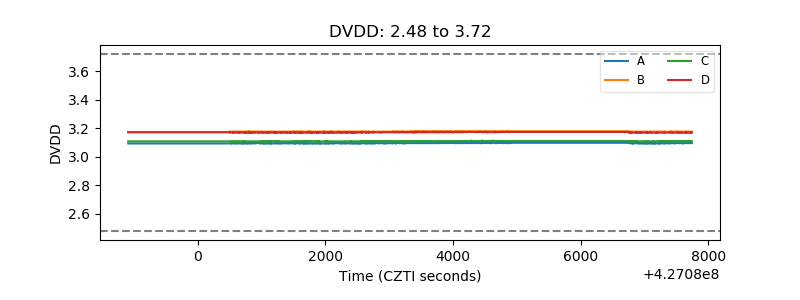 |
| Temperature 1 | 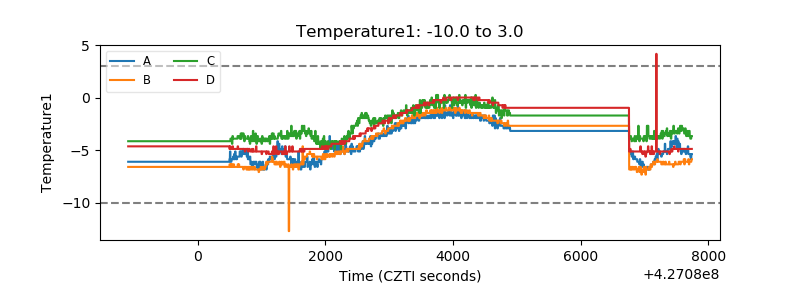 |
| Veto HV Monitor | 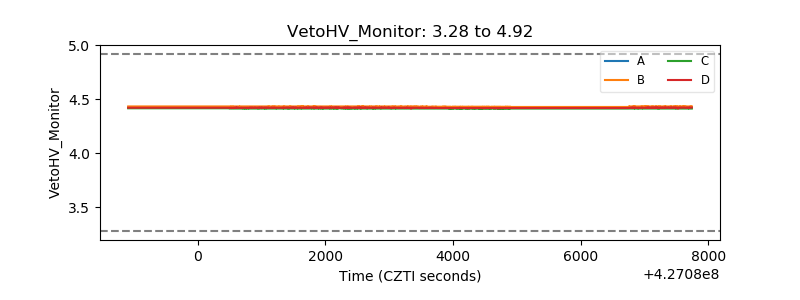 |
| Veto LLD | 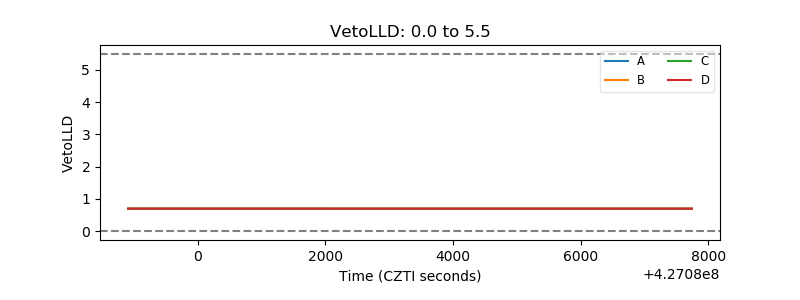 |
| Alpha Counter | 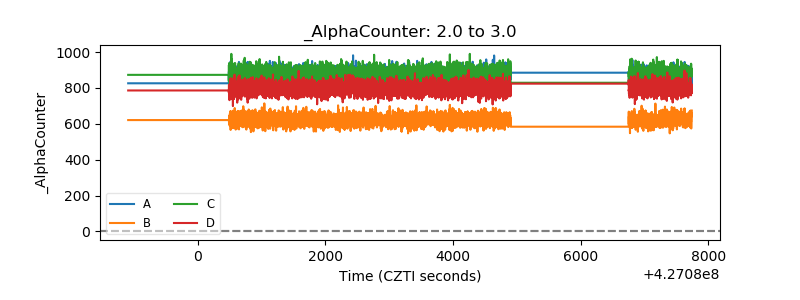 |
| _CPM_Rate | 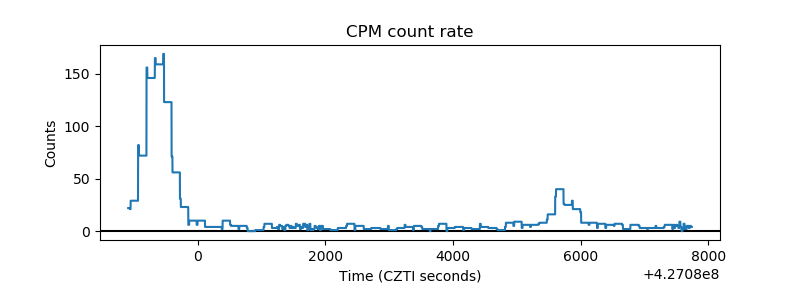 |
| CZT Counter | 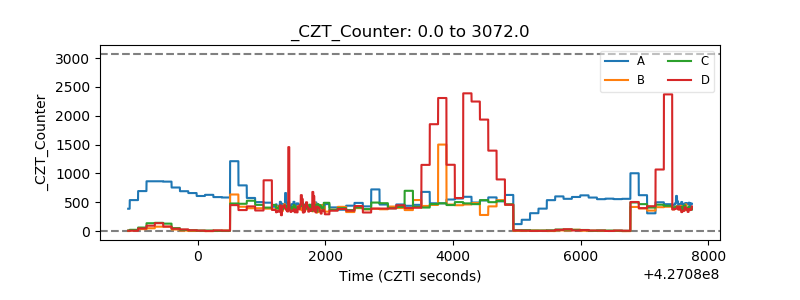 |
| +2.5 Volts monitor | 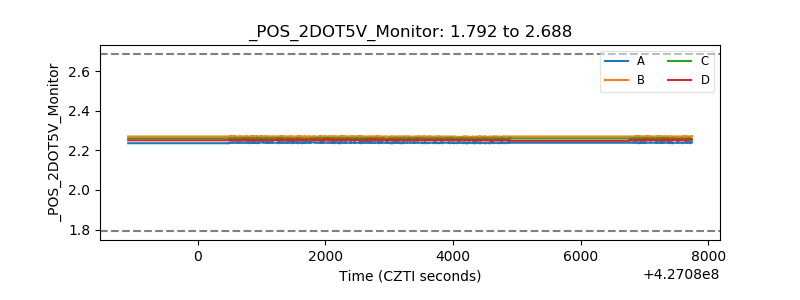 |
| +5 Volts monitor | 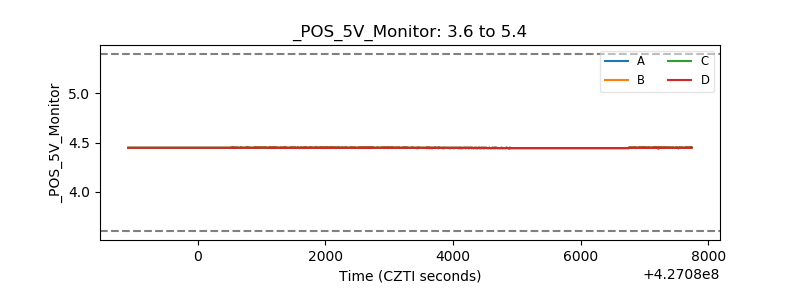 |
| _ROLL_ROT | 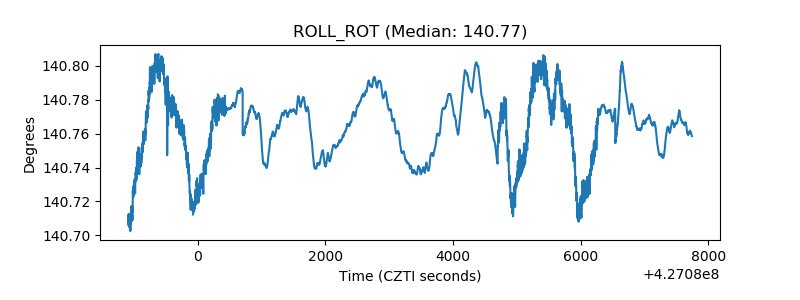 |
| _Roll_DEC | 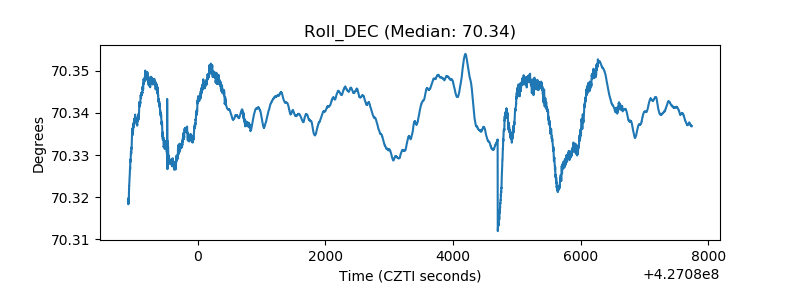 |
| _Roll_RA | 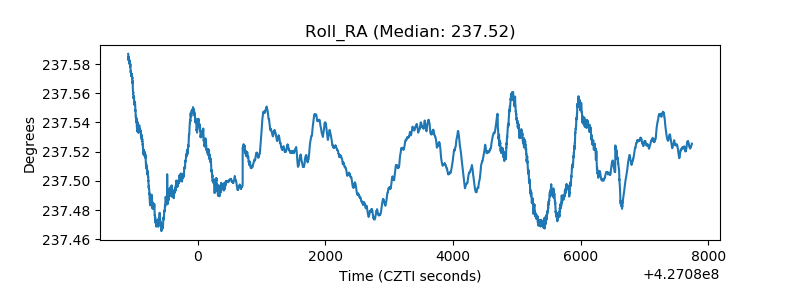 |
| Veto Counter | 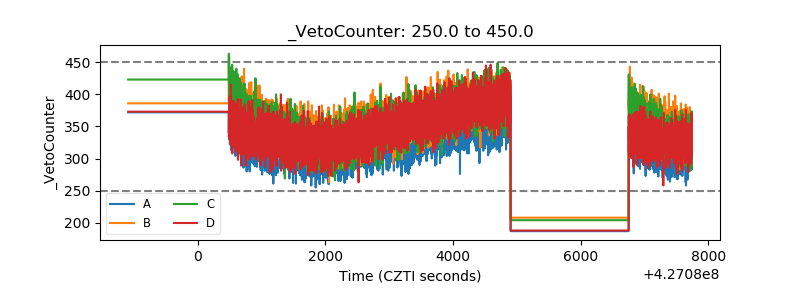 |