| Param | Original file | Final file |
|---|---|---|
| Filename | modeM0/AS1C07_001T11_9000005760_42145cztM0_level2.fits | modeM0/AS1C07_001T11_9000005760_42145cztM0_level2_quad_clean.evt |
| Size (bytes) | 344,041,920 | 91,368,000 |
| Size | 328.1 MB | 87.1 MB |
| Events in quadrant A | 3,195,504 | 604,414 |
| Events in quadrant B | 2,600,864 | 623,023 |
| Events in quadrant C | 2,582,031 | 605,987 |
| Events in quadrant D | 3,911,077 | 533,109 |
| Mode M0 | |||
|---|---|---|---|
| Quadrant | BADHDUFLAG | Total packets | Discarded packets |
| A | 0 | 12973 | 2 |
| B | 0 | 11977 | 2 |
| C | 0 | 11500 | 2 |
| D | 0 | 15964 | 2 |
| Mode M9 | |||
|---|---|---|---|
| Quadrant | BADHDUFLAG | Total packets | Discarded packets |
| A | 0 | 30 | 0 |
| B | 0 | 31 | 0 |
| C | 0 | 31 | 0 |
| D | 0 | 31 | 0 |
| Mode SS | |||
|---|---|---|---|
| Quadrant | BADHDUFLAG | Total packets | Discarded packets |
| A | 0 | 116 | 0 |
| B | 0 | 116 | 0 |
| C | 0 | 116 | 0 |
| D | 0 | 116 | 0 |
| Quadrant | Total seconds | Saturated seconds | Saturation percentage |
|---|---|---|---|
| A | 5722 | 32 | 0.559245% |
| B | 5722 | 18 | 0.314575% |
| C | 5722 | 3 | 0.052429% |
| D | 5722 | 302 | 5.277875% |
Noise dominated data is calculated using 1-second bins in cleaned event files. If a bin has >2000 counts, and if more than 50% of those come from <1% of pixels, then it is considered to be noise-dominated and hence unusable.
| Quadrant | # 1 sec bins | Bins with >0 counts | Bins with >2000 counts | High rate bins dominated by noise | Noise dominated (total time) | Noise dominated (detector-on time) | Marked lightcurve |
|---|---|---|---|---|---|---|---|
| A | 7215 | 5723 | 26 | 26 | 0.36% | 0.45% | 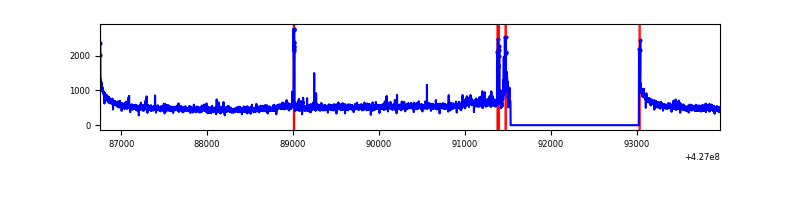 |
| B | 7215 | 5723 | 9 | 9 | 0.12% | 0.16% | 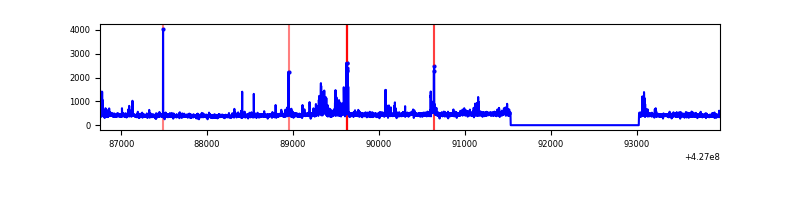 |
| C | 7215 | 5723 | 0 | 0 | 0.00% | 0.00% | 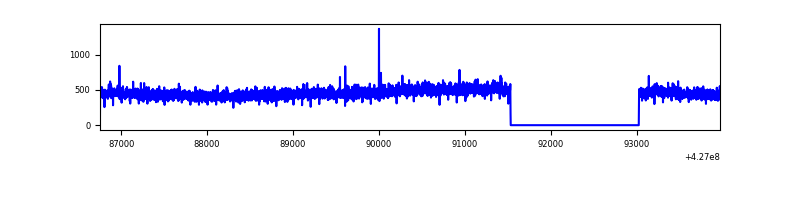 |
| D | 7215 | 5723 | 240 | 240 | 3.33% | 4.19% | 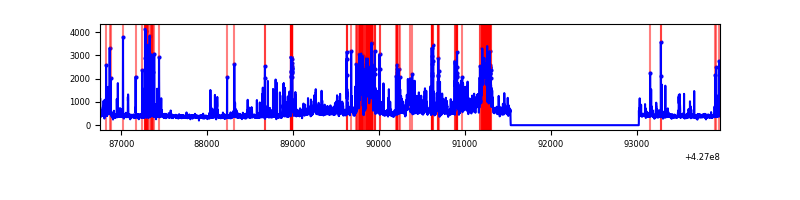 |
Top three noisy pixels from each quadrant. If the there are fewer than three noisy pixels in the level2.evt file, extra rows are filled as -1
| Pixel properties | Quadrant properties | ||||||
|---|---|---|---|---|---|---|---|
| Quadrant | DetID | PixID | Counts | Sigma | Mean | Median | Sigma |
| A | 10 | 83 | 609753 | 4896.19 | 604 | 590 | 124.4 |
| A | 15 | 223 | 158785 | 1271.5 | 604 | 590 | 124.4 |
| A | 12 | 189 | 46249 | 366.99 | 604 | 590 | 124.4 |
| B | 15 | 33 | 77317 | 657.73 | 603 | 585 | 116.7 |
| B | 0 | 229 | 51386 | 435.45 | 603 | 585 | 116.7 |
| B | 15 | 85 | 40877 | 345.37 | 603 | 585 | 116.7 |
| C | 15 | 214 | 238759 | 1723.05 | 593 | 596 | 138.2 |
| C | 8 | 79 | 14796 | 102.73 | 593 | 596 | 138.2 |
| C | 12 | 249 | 8358 | 56.16 | 593 | 596 | 138.2 |
| D | 13 | 249 | 594729 | 4190.5 | 577 | 560 | 141.8 |
| D | 1 | 47 | 421623 | 2969.63 | 577 | 560 | 141.8 |
| D | 1 | 52 | 420737 | 2963.38 | 577 | 560 | 141.8 |
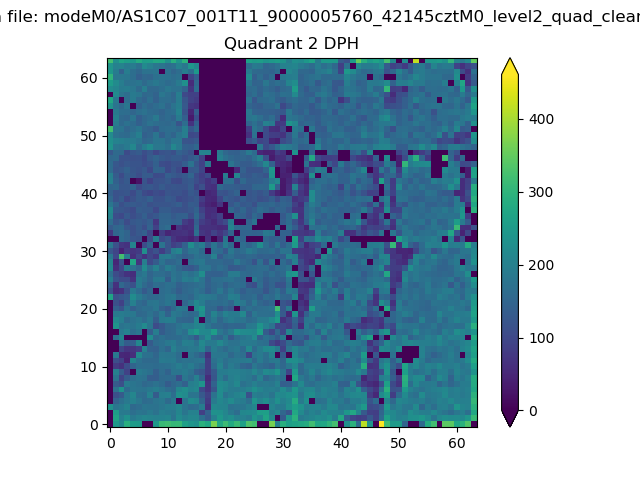
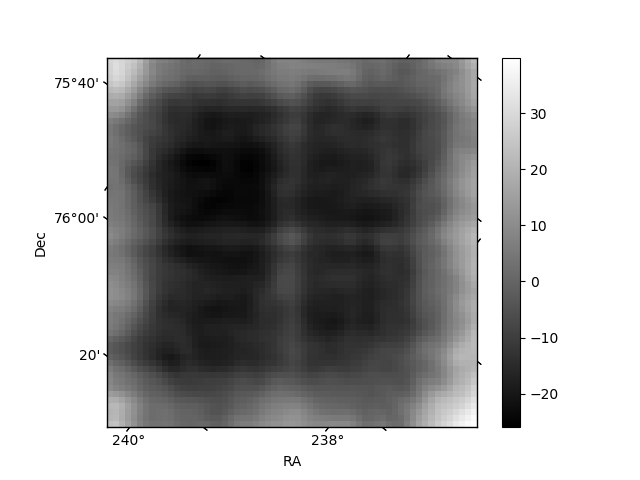
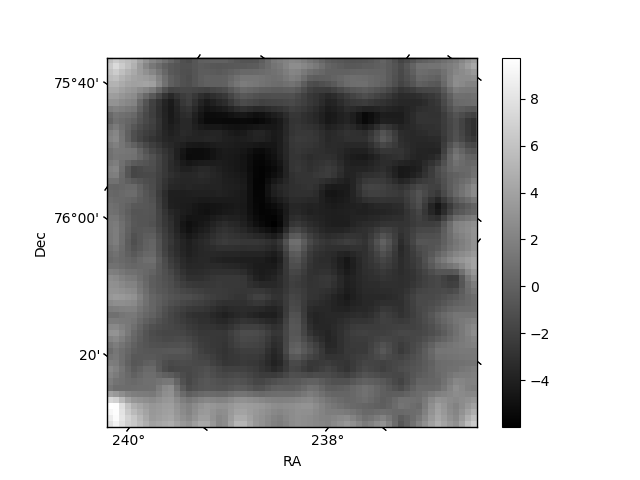
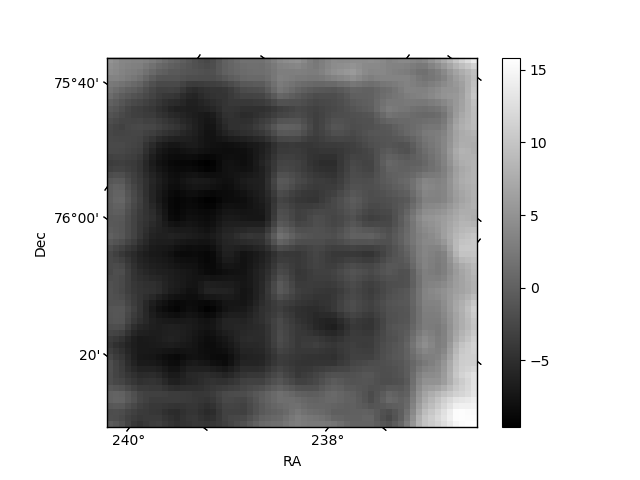
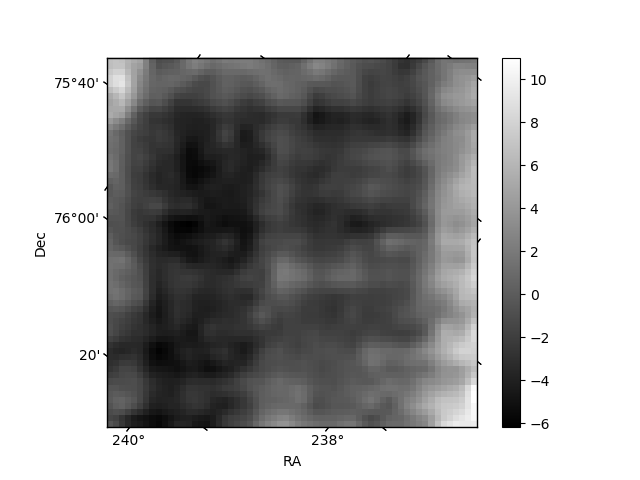
Histogram calculated using DETX and DETY for each event in the final _common_clean file
| Quadrant A | 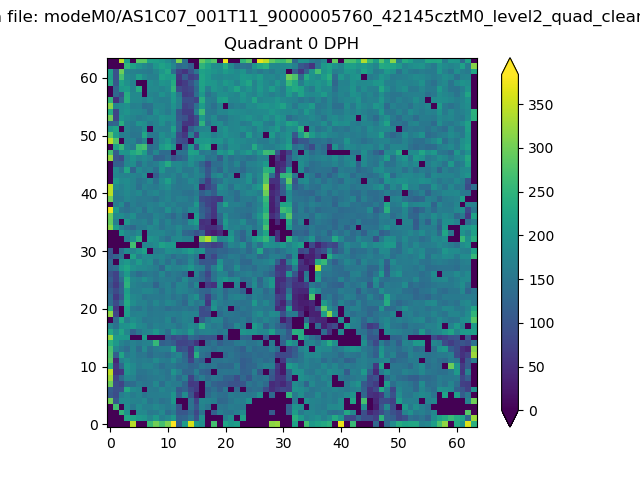 |
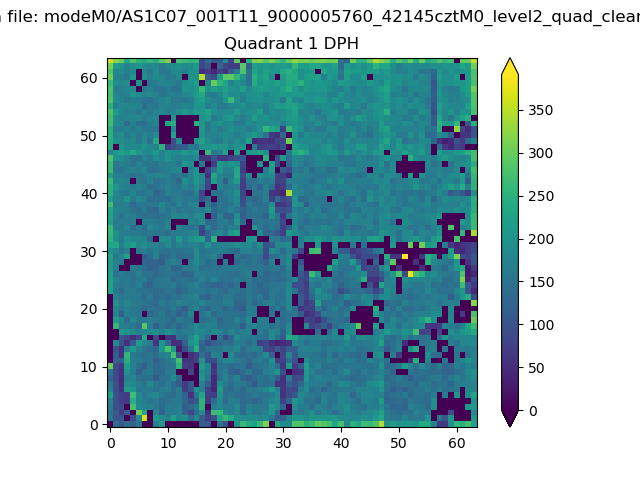 |
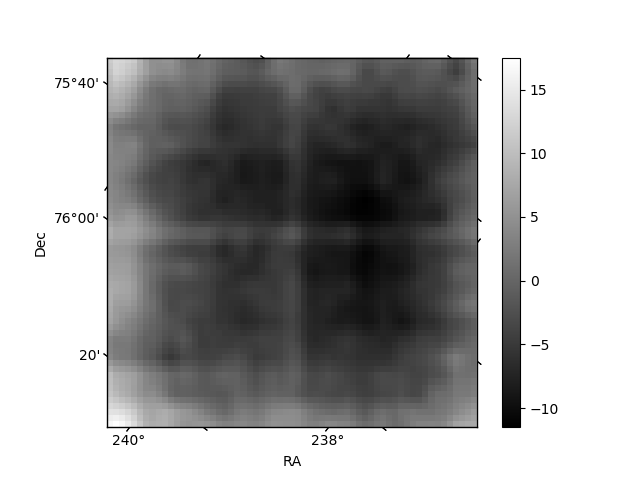
Quadrant B |
|---|---|---|---|
| Quadrant D | 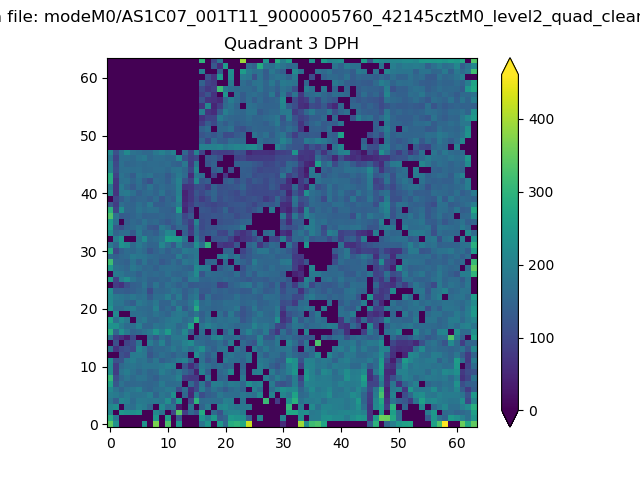 |
 |
Quadrant C |
| Plot type | Count rate plots | Images |
|---|---|---|
| Comparison with Poisson distribution Blue bars denote a histogram of data divided into 1 sec bins. Red curve is a Poisson curve with rate = median count rate of data. |
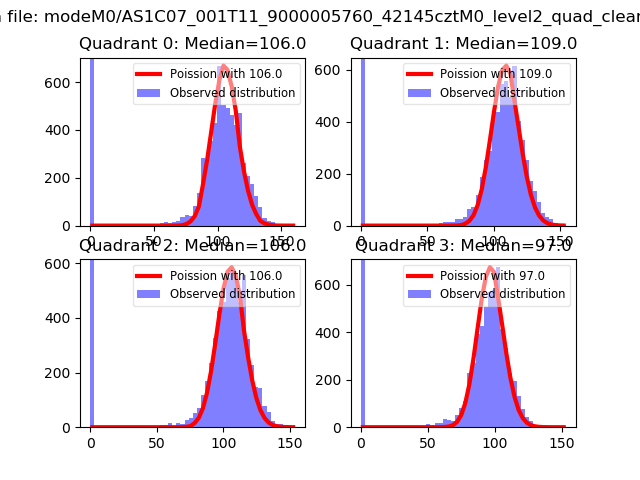 |
 |
| Quadrant-wise count rates Data is divided into 100 sec bins |
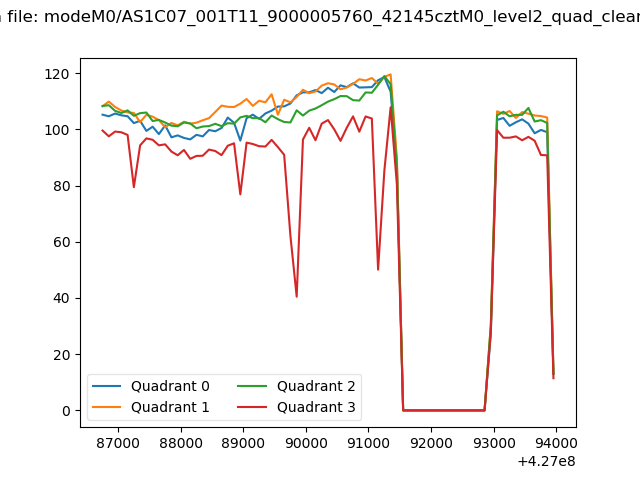 |
|
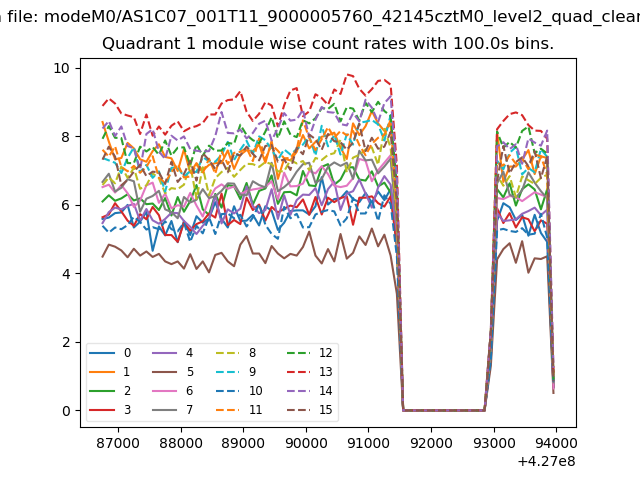
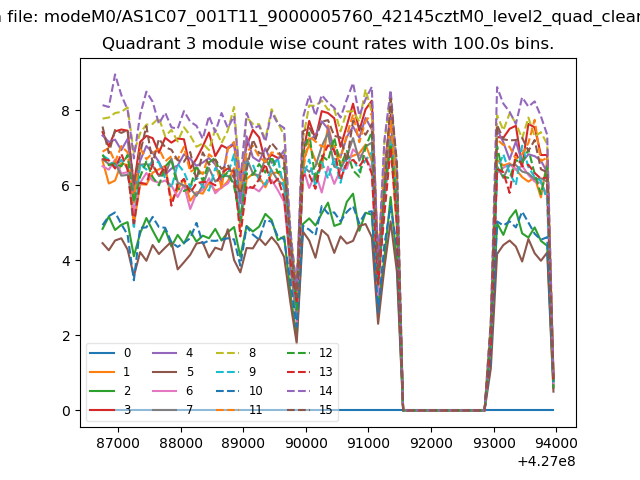
| Module-wise count rates for Quadrant A Data is divided into 100 sec bins |
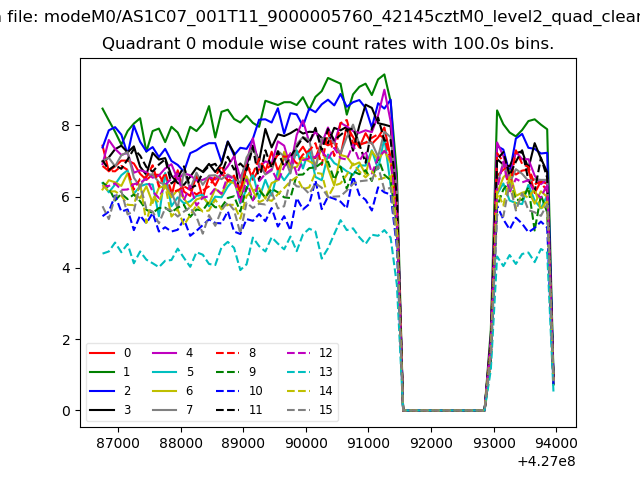 |
 |
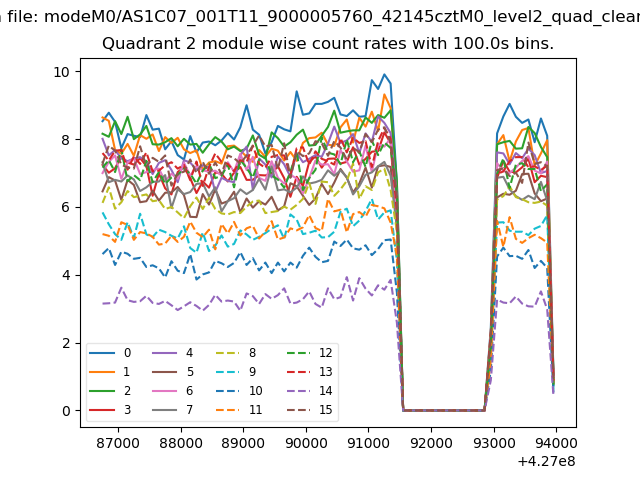
| Module-wise count rates for Quadrant B Data is divided into 100 sec bins |
 |
 |
| Module-wise count rates for Quadrant C Data is divided into 100 sec bins |
 |
 |
| Module-wise count rates for Quadrant D Data is divided into 100 sec bins |
 |
 |
| Parameter | Plot |
|---|---|
| CZT HV Monitor | 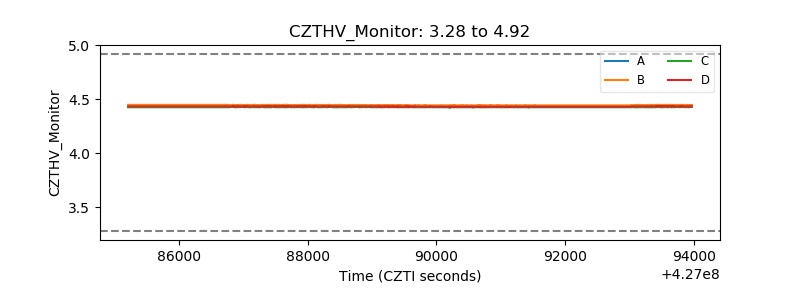 |
| D_VDD | 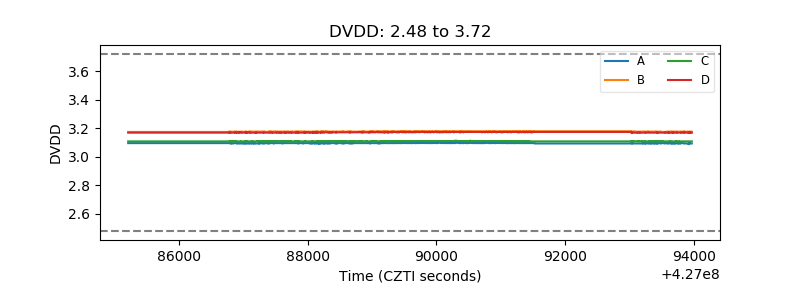 |
| Temperature 1 | 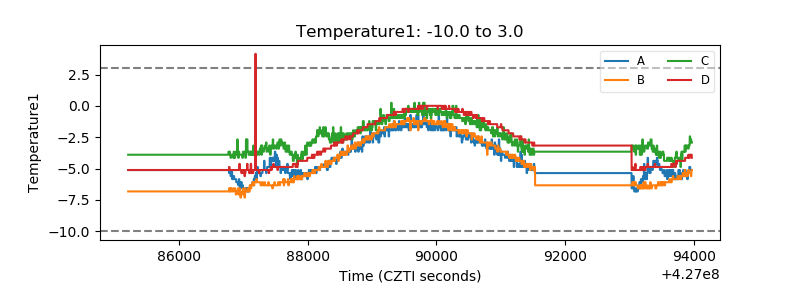 |
| Veto HV Monitor | 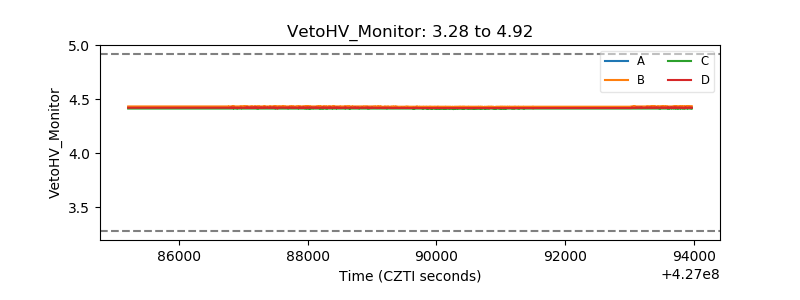 |
| Veto LLD | 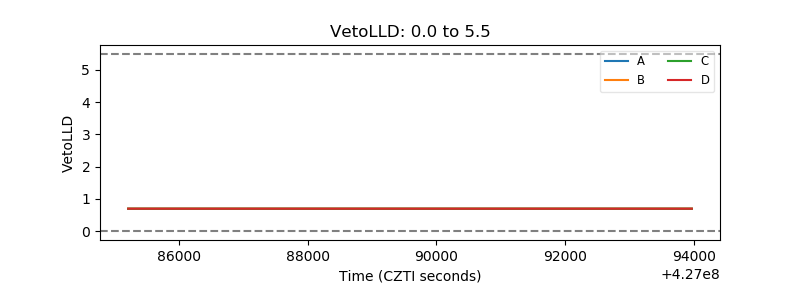 |
| Alpha Counter | 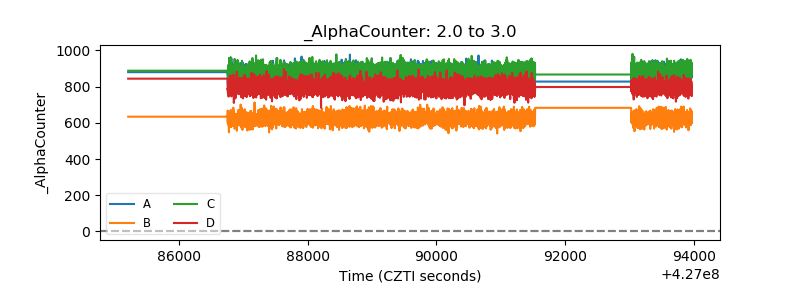 |
| _CPM_Rate | 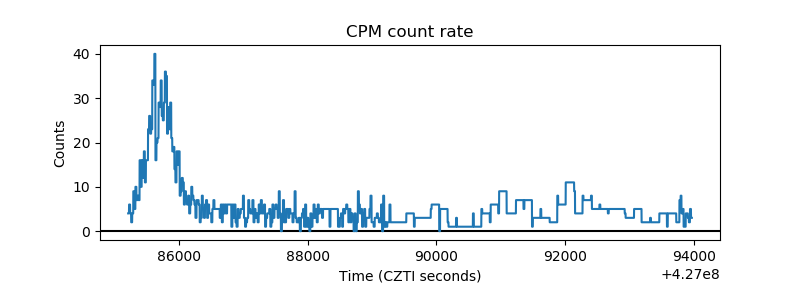 |
| CZT Counter | 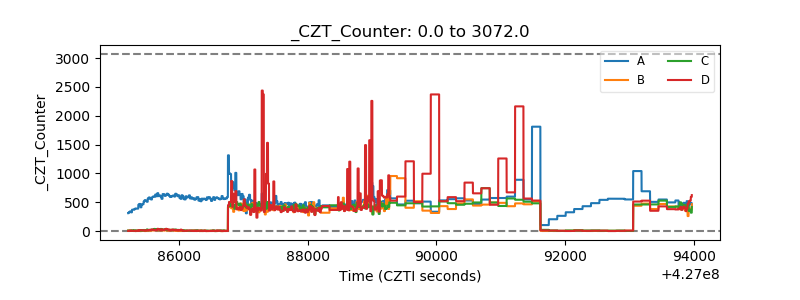 |
| +2.5 Volts monitor | 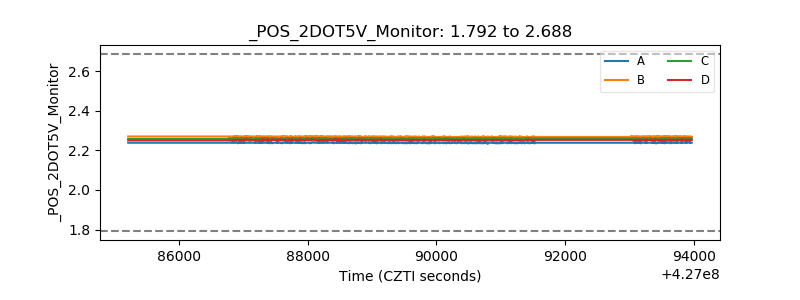 |
| +5 Volts monitor | 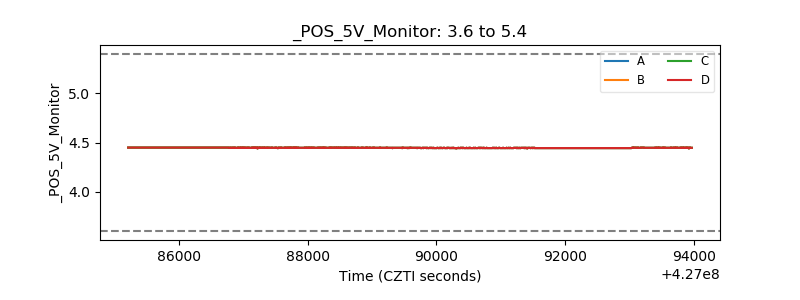 |
| _ROLL_ROT | 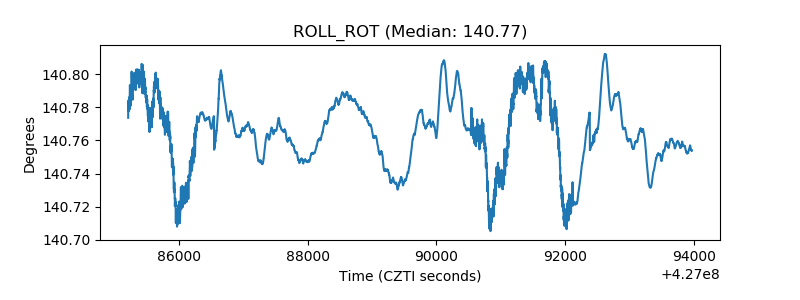 |
| _Roll_DEC | 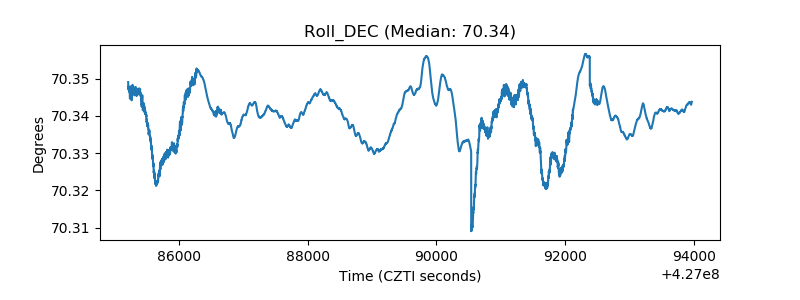 |
| _Roll_RA | 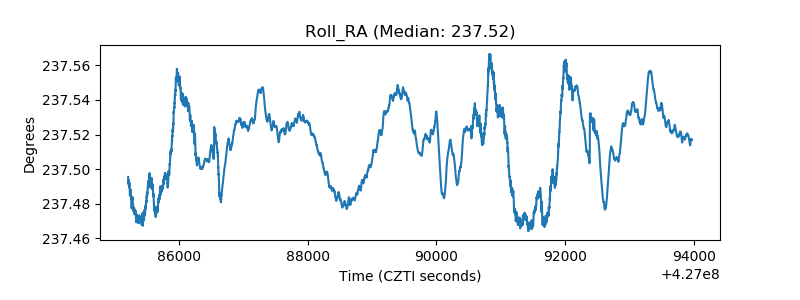 |
| Veto Counter | 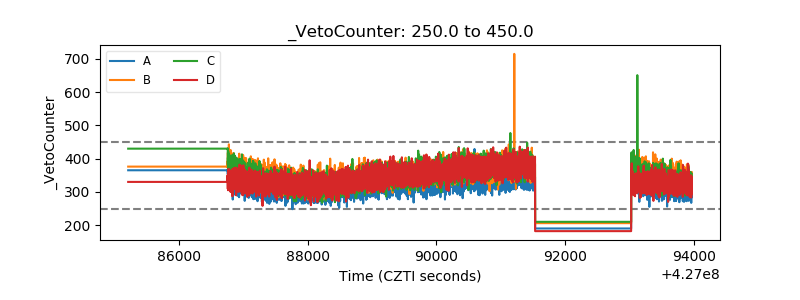 |