| Param | Original file | Final file |
|---|---|---|
| Filename | modeM0/AS1C07_001T11_9000005760_42147cztM0_level2.fits | modeM0/AS1C07_001T11_9000005760_42147cztM0_level2_quad_clean.evt |
| Size (bytes) | 356,952,960 | 94,723,200 |
| Size | 340.4 MB | 90.3 MB |
| Events in quadrant A | 3,469,658 | 625,199 |
| Events in quadrant B | 2,873,355 | 645,238 |
| Events in quadrant C | 2,702,710 | 624,383 |
| Events in quadrant D | 3,704,036 | 557,099 |
| Mode M0 | |||
|---|---|---|---|
| Quadrant | BADHDUFLAG | Total packets | Discarded packets |
| A | 0 | 13737 | 2 |
| B | 0 | 12766 | 2 |
| C | 0 | 11941 | 3 |
| D | 0 | 15164 | 2 |
| Mode M9 | |||
|---|---|---|---|
| Quadrant | BADHDUFLAG | Total packets | Discarded packets |
| A | 0 | 13 | 0 |
| B | 0 | 14 | 0 |
| C | 0 | 14 | 0 |
| D | 0 | 14 | 0 |
| Mode SS | |||
|---|---|---|---|
| Quadrant | BADHDUFLAG | Total packets | Discarded packets |
| A | 0 | 122 | 0 |
| B | 0 | 122 | 0 |
| C | 0 | 122 | 0 |
| D | 0 | 122 | 0 |
| Quadrant | Total seconds | Saturated seconds | Saturation percentage |
|---|---|---|---|
| A | 5952 | 62 | 1.041667% |
| B | 5952 | 29 | 0.487231% |
| C | 5951 | 2 | 0.033608% |
| D | 5951 | 232 | 3.898504% |
Noise dominated data is calculated using 1-second bins in cleaned event files. If a bin has >2000 counts, and if more than 50% of those come from <1% of pixels, then it is considered to be noise-dominated and hence unusable.
| Quadrant | # 1 sec bins | Bins with >0 counts | Bins with >2000 counts | High rate bins dominated by noise | Noise dominated (total time) | Noise dominated (detector-on time) | Marked lightcurve |
|---|---|---|---|---|---|---|---|
| A | 7265 | 5953 | 35 | 35 | 0.48% | 0.59% | 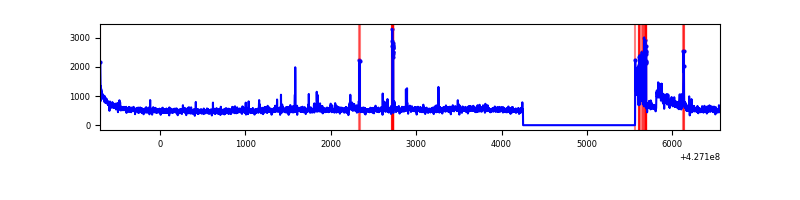 |
| B | 7265 | 5953 | 12 | 12 | 0.17% | 0.20% | 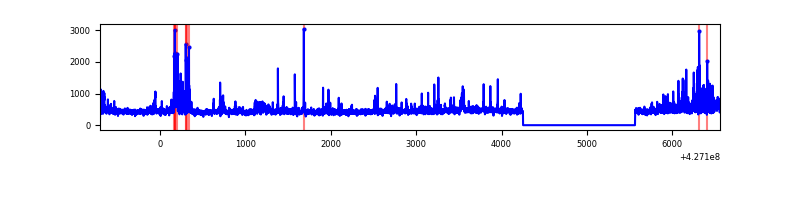 |
| C | 7264 | 5952 | 0 | 0 | 0.00% | 0.00% | 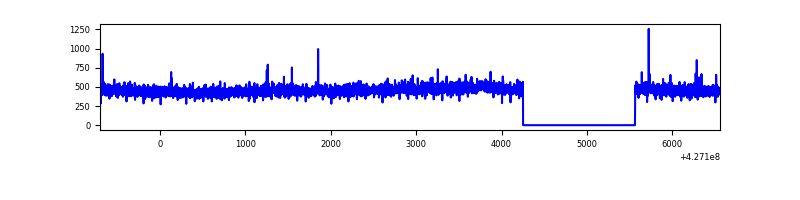 |
| D | 7264 | 5952 | 209 | 209 | 2.88% | 3.51% | 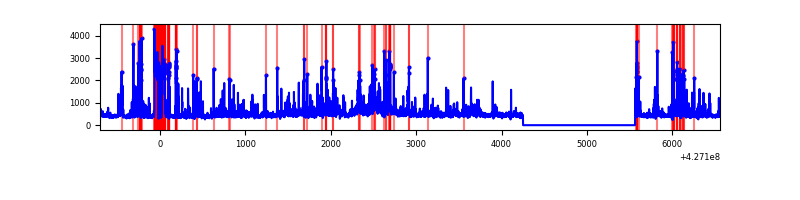 |
Top three noisy pixels from each quadrant. If the there are fewer than three noisy pixels in the level2.evt file, extra rows are filled as -1
| Pixel properties | Quadrant properties | ||||||
|---|---|---|---|---|---|---|---|
| Quadrant | DetID | PixID | Counts | Sigma | Mean | Median | Sigma |
| A | 10 | 83 | 629273 | 4797.69 | 637 | 622 | 131.0 |
| A | 15 | 223 | 248584 | 1892.38 | 637 | 622 | 131.0 |
| A | 12 | 189 | 68401 | 517.27 | 637 | 622 | 131.0 |
| B | 15 | 33 | 186279 | 1505.54 | 636 | 616 | 123.3 |
| B | 0 | 229 | 79014 | 635.73 | 636 | 616 | 123.3 |
| B | 3 | 112 | 48945 | 391.9 | 636 | 616 | 123.3 |
| C | 15 | 214 | 252144 | 1720.68 | 624 | 626 | 146.2 |
| C | 15 | 159 | 6495 | 40.15 | 624 | 626 | 146.2 |
| C | 12 | 249 | 5105 | 30.64 | 624 | 626 | 146.2 |
| D | 13 | 249 | 519346 | 3439.16 | 614 | 594 | 150.8 |
| D | 1 | 52 | 159913 | 1056.24 | 614 | 594 | 150.8 |
| D | 5 | 32 | 130237 | 859.49 | 614 | 594 | 150.8 |
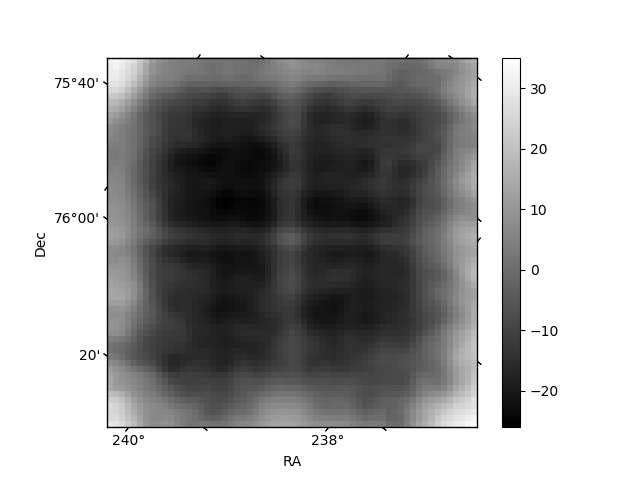
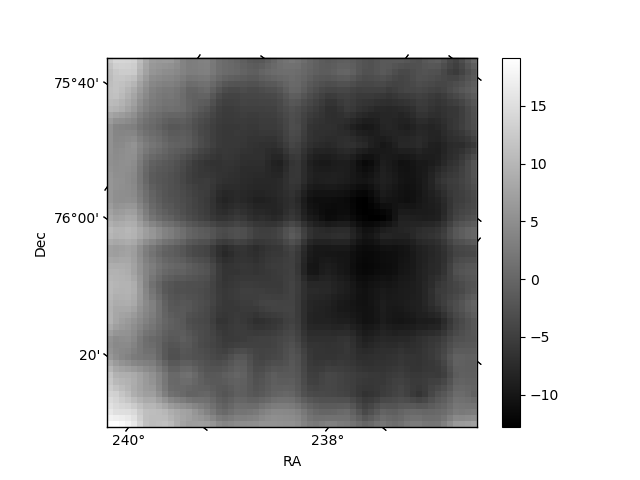
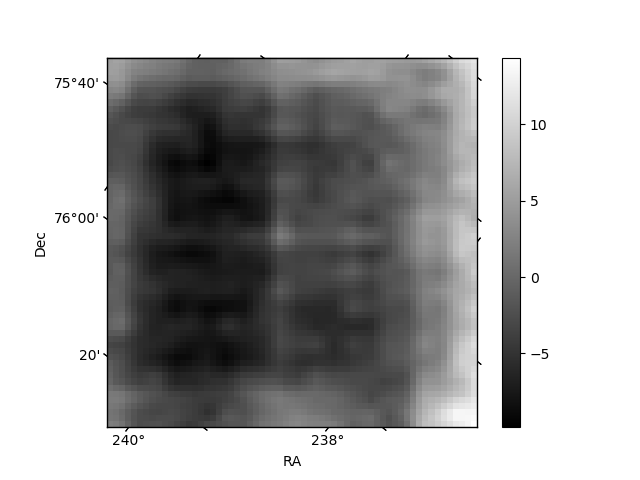
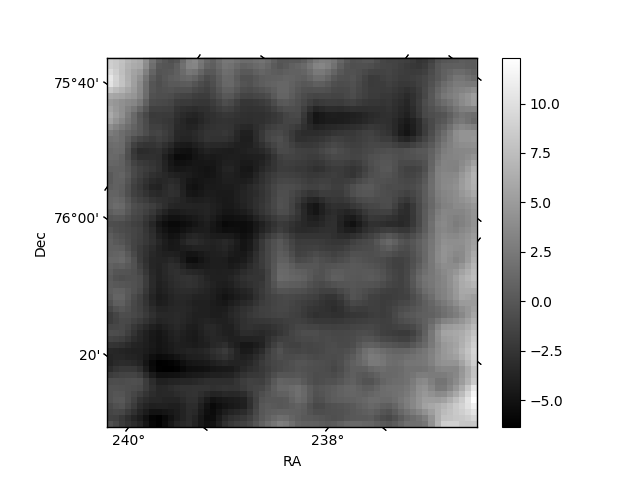
Histogram calculated using DETX and DETY for each event in the final _common_clean file
| Quadrant A | 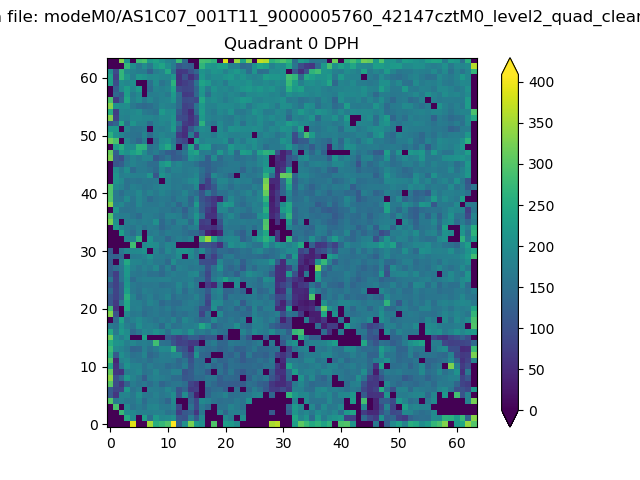 |
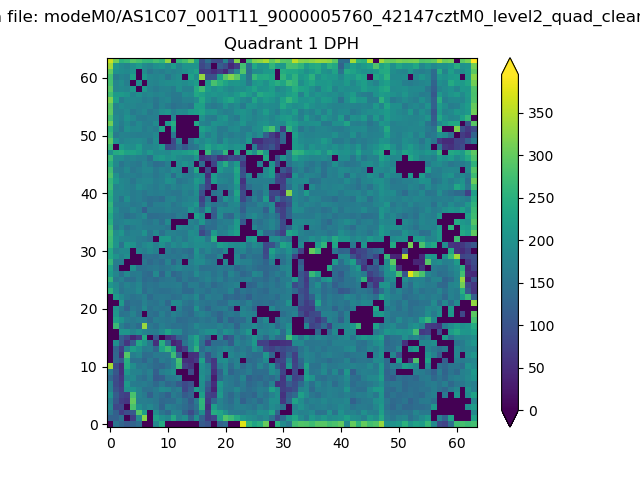 |
Quadrant B |
|---|---|---|---|
| Quadrant D | 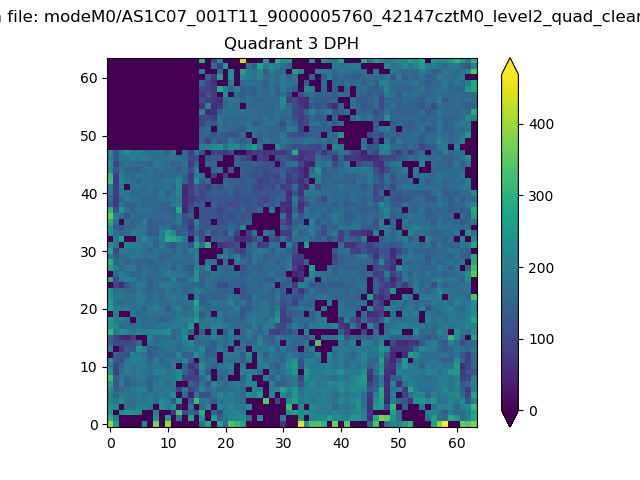 |
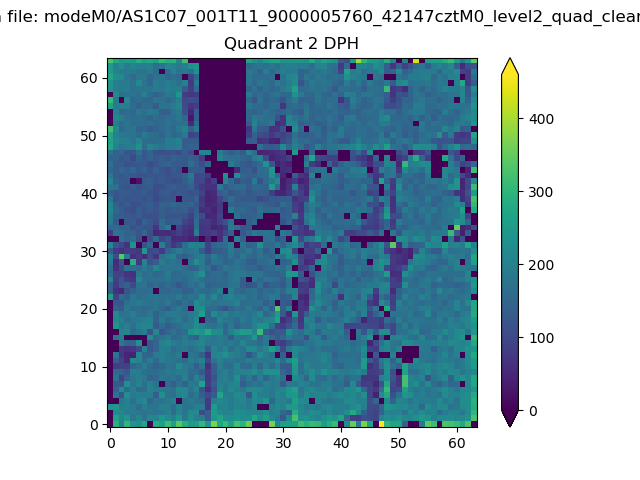 |
Quadrant C |
| Plot type | Count rate plots | Images |
|---|---|---|
| Comparison with Poisson distribution Blue bars denote a histogram of data divided into 1 sec bins. Red curve is a Poisson curve with rate = median count rate of data. |
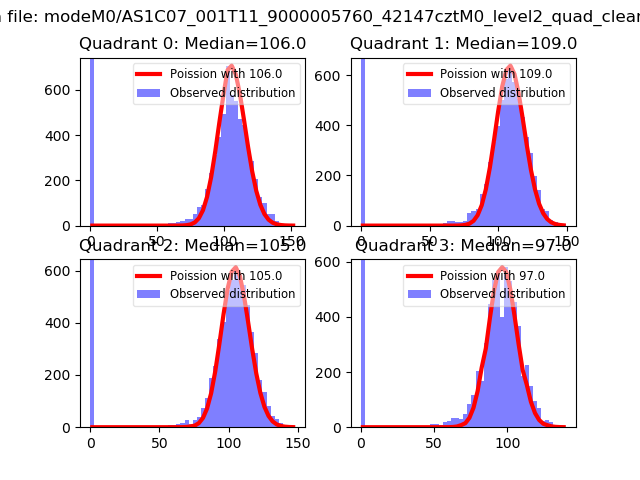 |
 |
| Quadrant-wise count rates Data is divided into 100 sec bins |
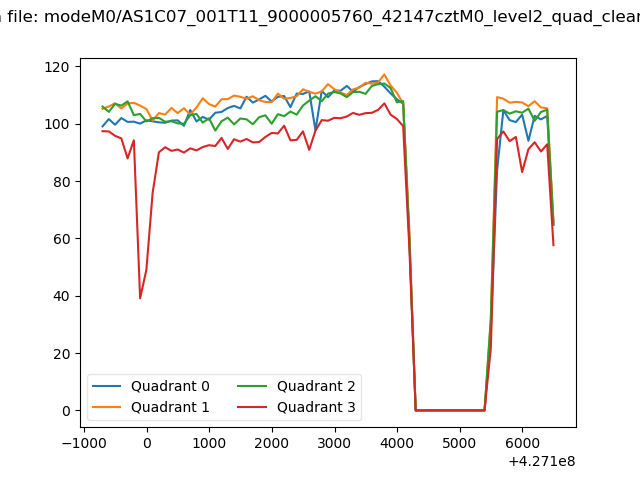 |
|
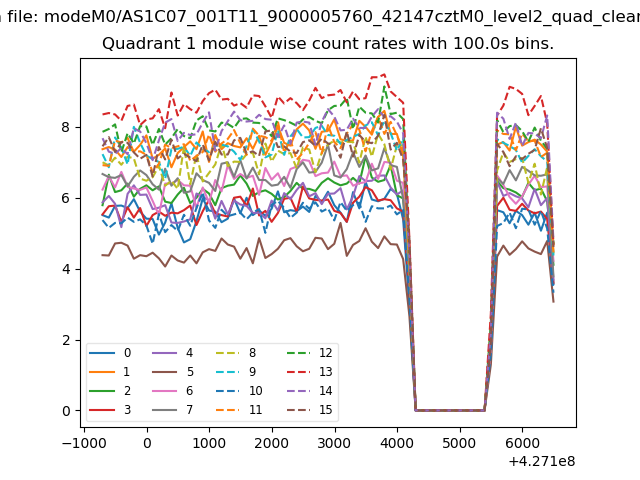
| Module-wise count rates for Quadrant A Data is divided into 100 sec bins |
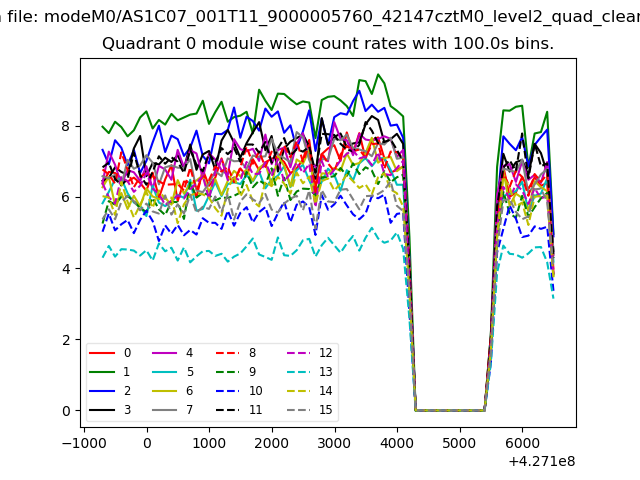 |
 |
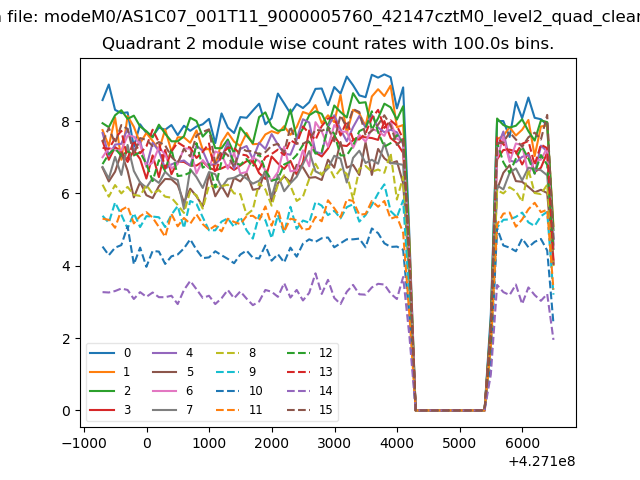
| Module-wise count rates for Quadrant B Data is divided into 100 sec bins |
 |
 |
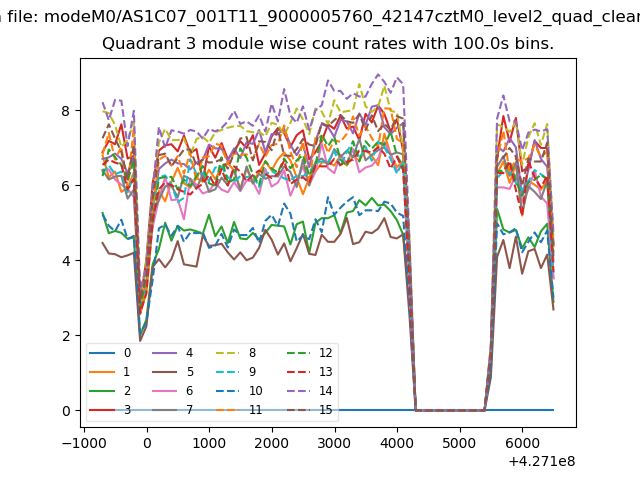
| Module-wise count rates for Quadrant C Data is divided into 100 sec bins |
 |
 |
| Module-wise count rates for Quadrant D Data is divided into 100 sec bins |
 |
 |
| Parameter | Plot |
|---|---|
| CZT HV Monitor | 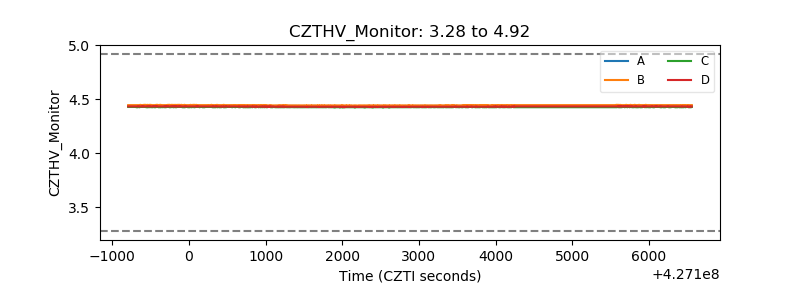 |
| D_VDD | 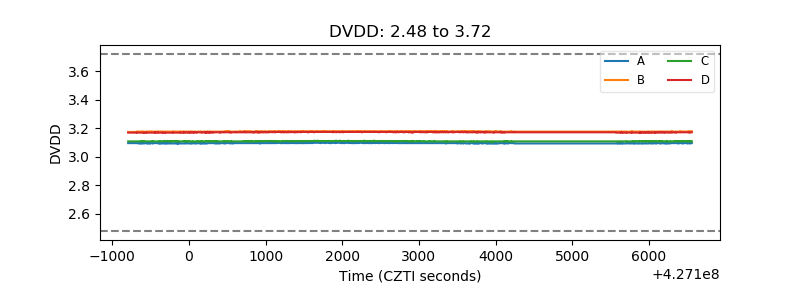 |
| Temperature 1 | 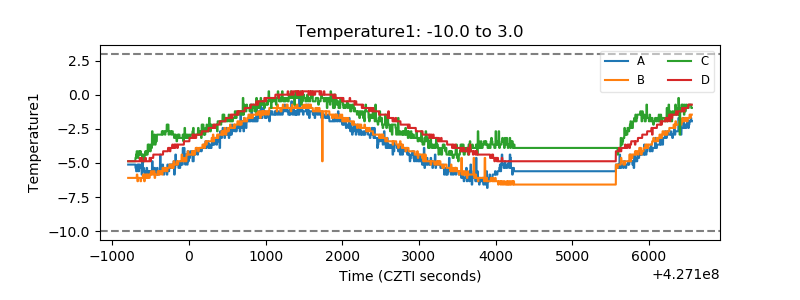 |
| Veto HV Monitor |  |
| Veto LLD | 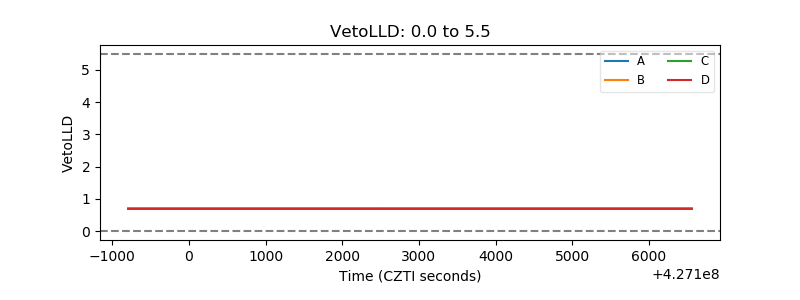 |
| Alpha Counter | 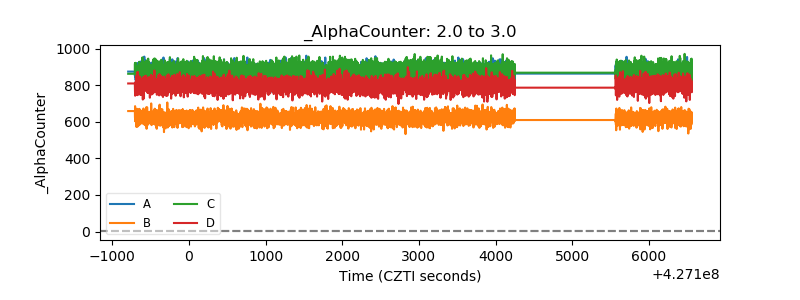 |
| _CPM_Rate | 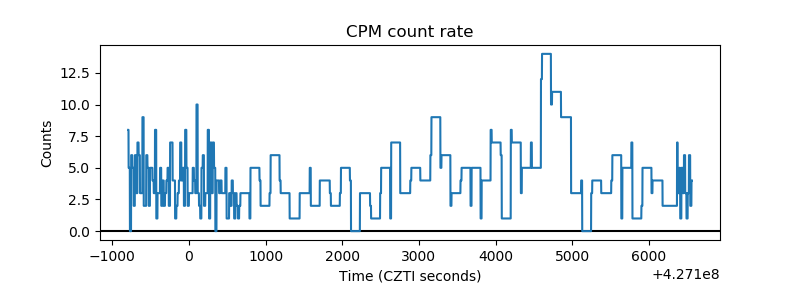 |
| CZT Counter | 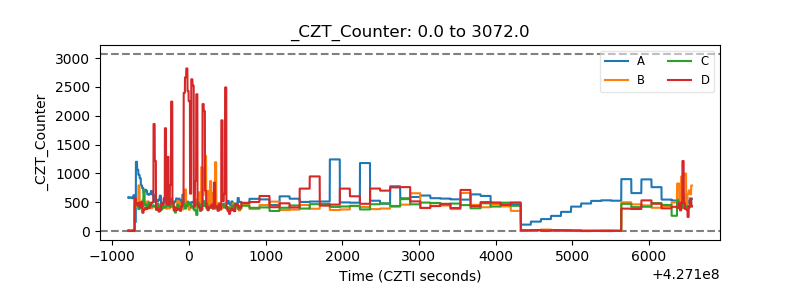 |
| +2.5 Volts monitor | 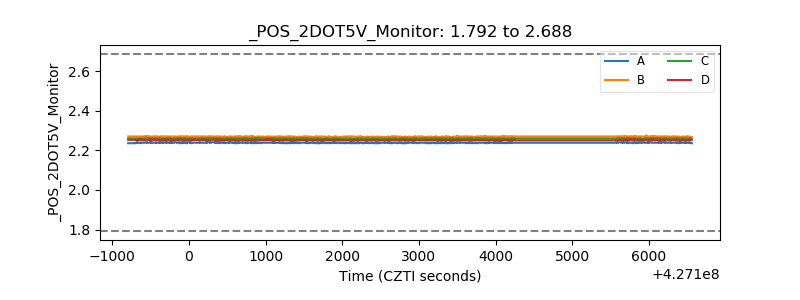 |
| +5 Volts monitor | 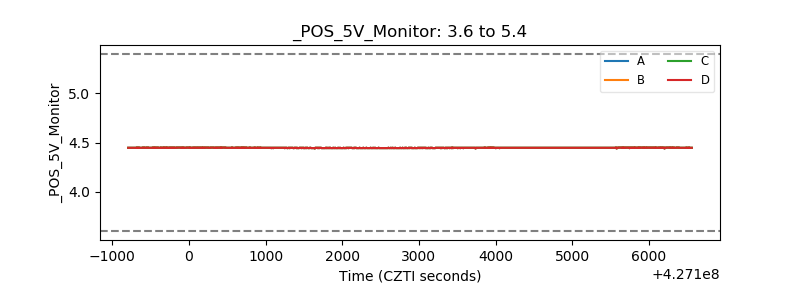 |
| _ROLL_ROT | 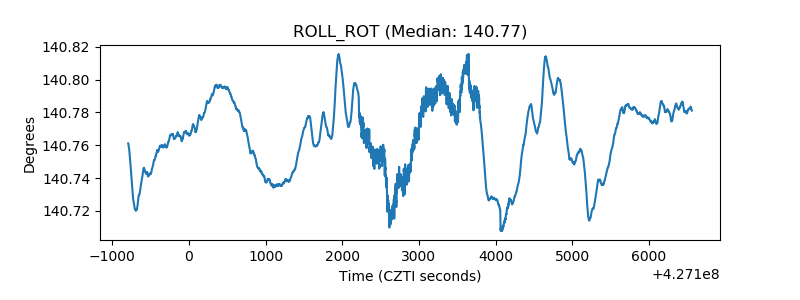 |
| _Roll_DEC | 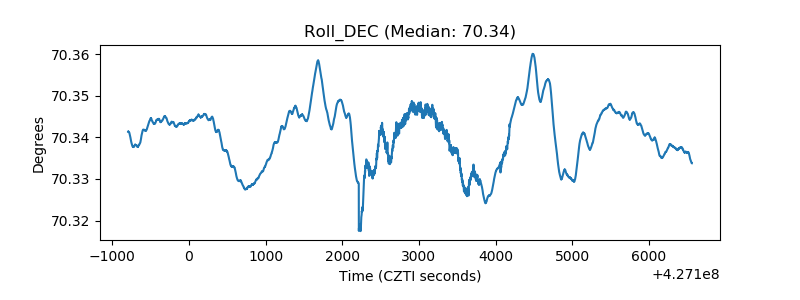 |
| _Roll_RA | 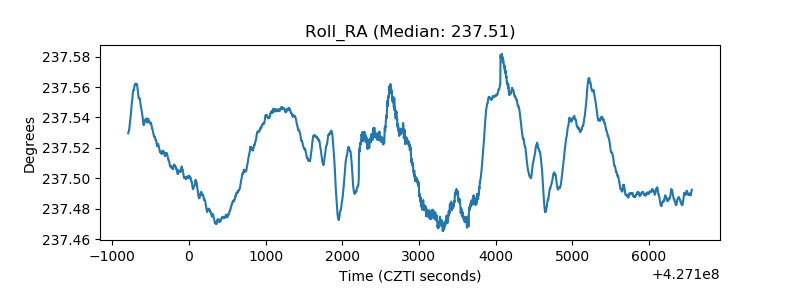 |
| Veto Counter | 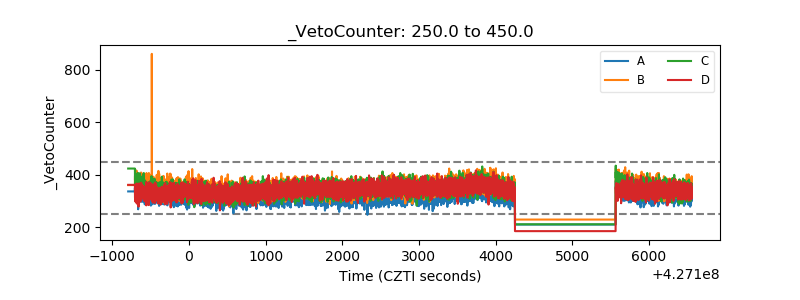 |