| Param | Original file | Final file |
|---|---|---|
| Filename | modeM0/AS1C07_001T11_9000005760_42149cztM0_level2.fits | modeM0/AS1C07_001T11_9000005760_42149cztM0_level2_quad_clean.evt |
| Size (bytes) | 847,569,600 | 167,814,720 |
| Size | 808.3 MB | 160.0 MB |
| Events in quadrant A | 8,740,193 | 1,139,394 |
| Events in quadrant B | 9,079,968 | 1,050,670 |
| Events in quadrant C | 4,939,964 | 1,134,408 |
| Events in quadrant D | 7,777,103 | 1,006,611 |
| Mode M0 | |||
|---|---|---|---|
| Quadrant | BADHDUFLAG | Total packets | Discarded packets |
| A | 0 | 32893 | 3 |
| B | 0 | 34549 | 3 |
| C | 0 | 21731 | 3 |
| D | 0 | 30613 | 3 |
| Mode M9 | |||
|---|---|---|---|
| Quadrant | BADHDUFLAG | Total packets | Discarded packets |
| A | 0 | 30 | 0 |
| B | 0 | 31 | 0 |
| C | 0 | 31 | 0 |
| D | 0 | 31 | 0 |
| Mode SS | |||
|---|---|---|---|
| Quadrant | BADHDUFLAG | Total packets | Discarded packets |
| A | 0 | 222 | 0 |
| B | 0 | 222 | 0 |
| C | 0 | 222 | 0 |
| D | 0 | 222 | 0 |
| Quadrant | Total seconds | Saturated seconds | Saturation percentage |
|---|---|---|---|
| A | 10817 | 295 | 2.727189% |
| B | 10817 | 1271 | 11.750023% |
| C | 10817 | 9 | 0.083202% |
| D | 10817 | 592 | 5.472867% |
Noise dominated data is calculated using 1-second bins in cleaned event files. If a bin has >2000 counts, and if more than 50% of those come from <1% of pixels, then it is considered to be noise-dominated and hence unusable.
| Quadrant | # 1 sec bins | Bins with >0 counts | Bins with >2000 counts | High rate bins dominated by noise | Noise dominated (total time) | Noise dominated (detector-on time) | Marked lightcurve |
|---|---|---|---|---|---|---|---|
| A | 13592 | 10819 | 106 | 106 | 0.78% | 0.98% | 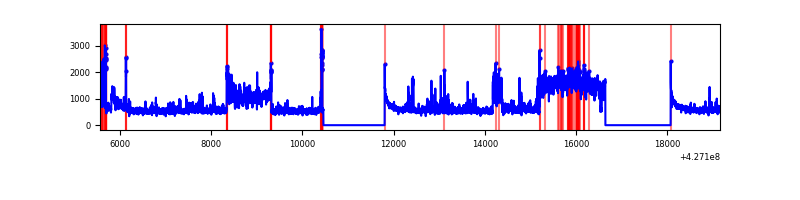 |
| B | 13592 | 10819 | 896 | 896 | 6.59% | 8.28% | 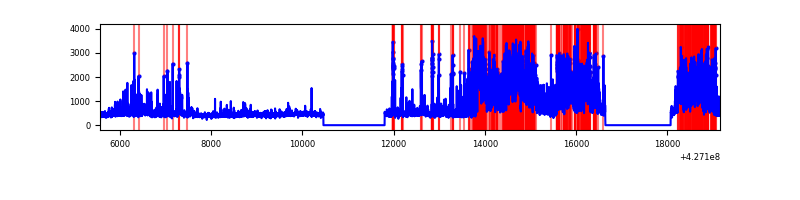 |
| C | 13592 | 10819 | 3 | 3 | 0.02% | 0.03% | 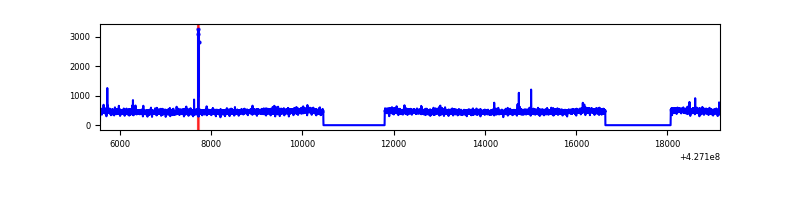 |
| D | 13592 | 10819 | 529 | 529 | 3.89% | 4.89% | 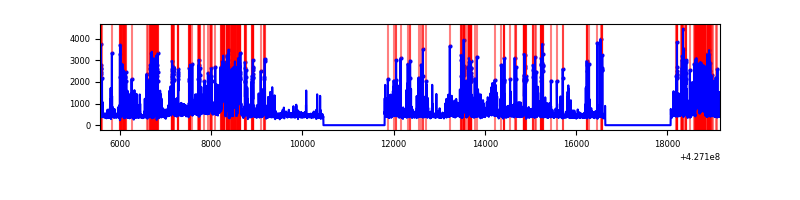 |
Top three noisy pixels from each quadrant. If the there are fewer than three noisy pixels in the level2.evt file, extra rows are filled as -1
| Pixel properties | Quadrant properties | ||||||
|---|---|---|---|---|---|---|---|
| Quadrant | DetID | PixID | Counts | Sigma | Mean | Median | Sigma |
| A | 15 | 223 | 2669990 | 11319.62 | 1157 | 1133 | 235.8 |
| A | 10 | 83 | 1144076 | 4847.65 | 1157 | 1133 | 235.8 |
| A | 12 | 189 | 194588 | 820.52 | 1157 | 1133 | 235.8 |
| B | 4 | 171 | 3941698 | 18234.36 | 1120 | 1085 | 216.1 |
| B | 0 | 229 | 174370 | 801.84 | 1120 | 1085 | 216.1 |
| B | 15 | 33 | 149093 | 684.88 | 1120 | 1085 | 216.1 |
| C | 15 | 214 | 456375 | 1719.1 | 1140 | 1145 | 264.8 |
| C | 15 | 159 | 19305 | 68.58 | 1140 | 1145 | 264.8 |
| C | 12 | 249 | 9281 | 30.72 | 1140 | 1145 | 264.8 |
| D | 12 | 33 | 965073 | 3537.06 | 1121 | 1086 | 272.5 |
| D | 1 | 52 | 853187 | 3126.53 | 1121 | 1086 | 272.5 |
| D | 13 | 249 | 563575 | 2063.88 | 1121 | 1086 | 272.5 |
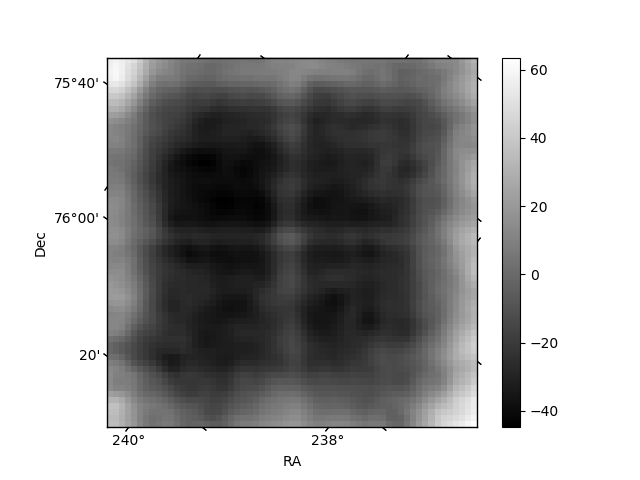
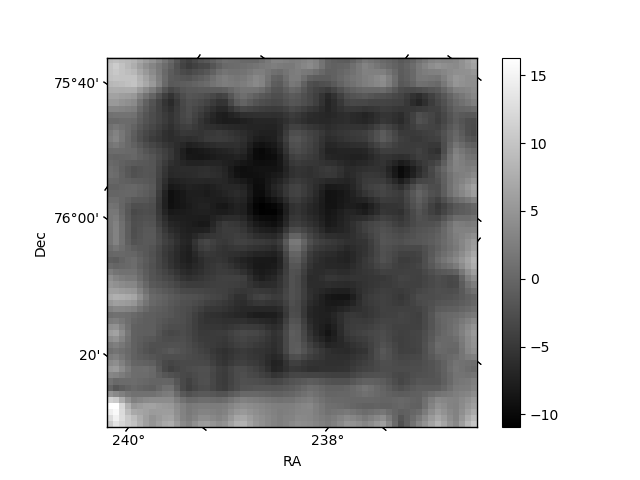
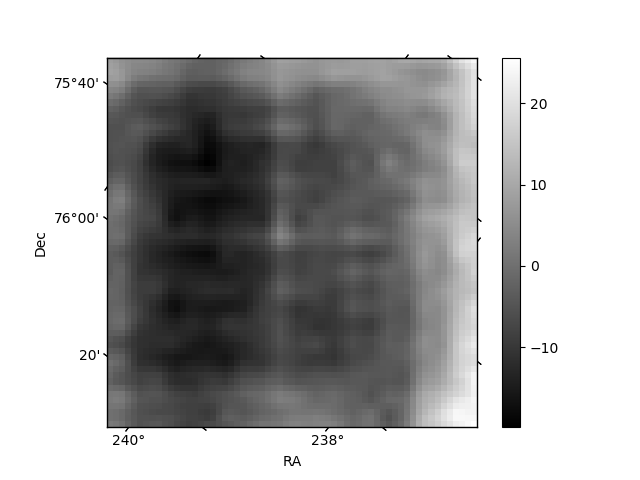
Histogram calculated using DETX and DETY for each event in the final _common_clean file
| Quadrant A | 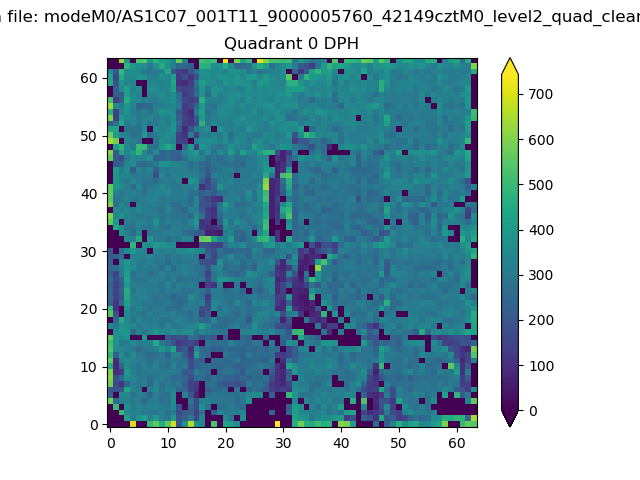 |
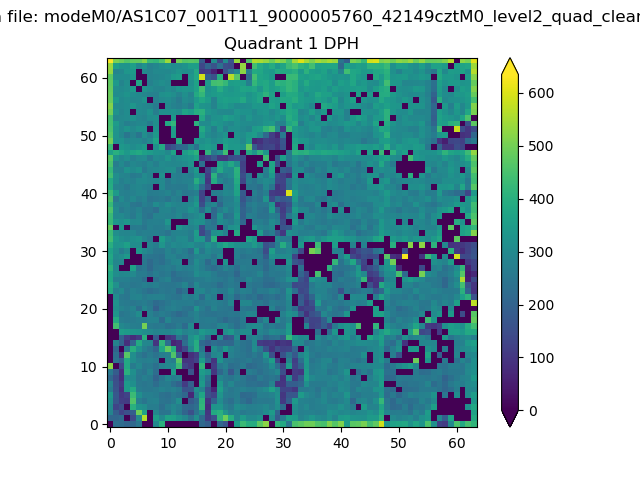 |
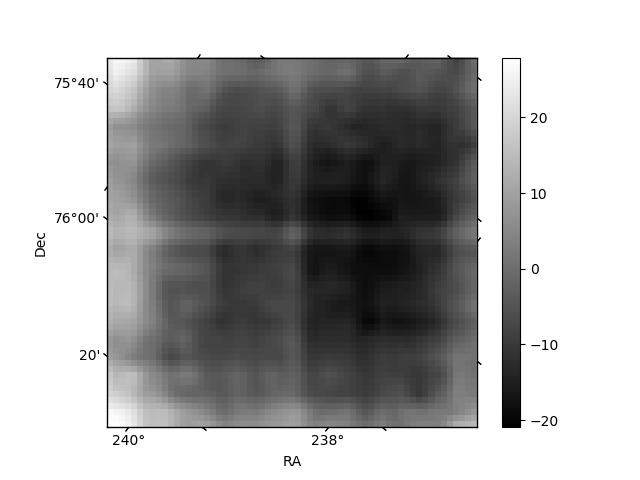
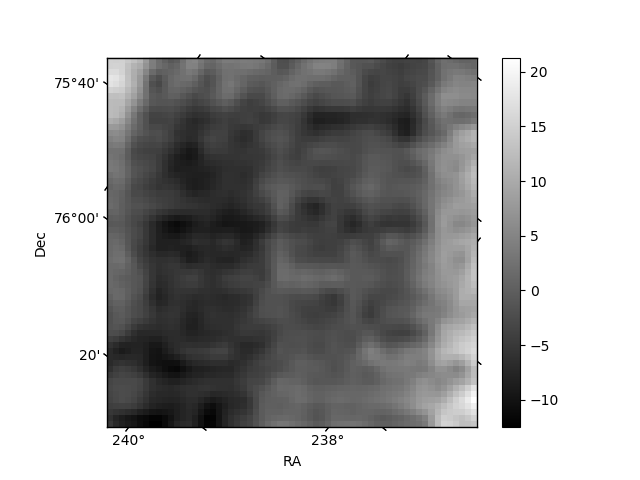
Quadrant B |
|---|---|---|---|
| Quadrant D | 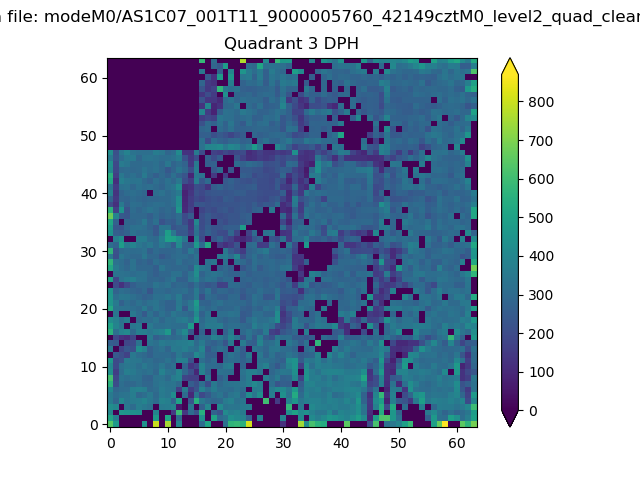 |
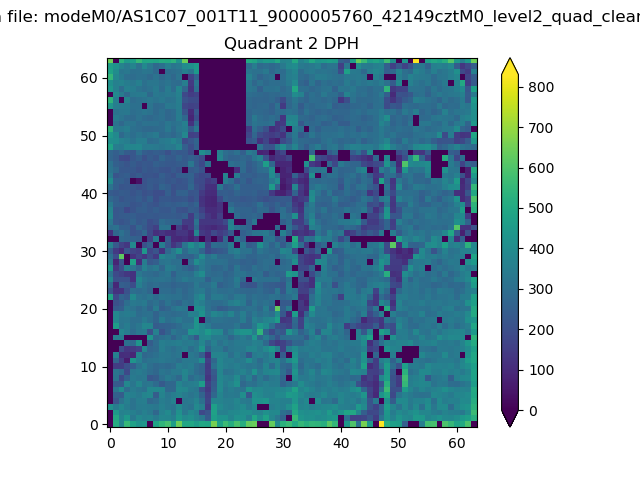 |
Quadrant C |
| Plot type | Count rate plots | Images |
|---|---|---|
| Comparison with Poisson distribution Blue bars denote a histogram of data divided into 1 sec bins. Red curve is a Poisson curve with rate = median count rate of data. |
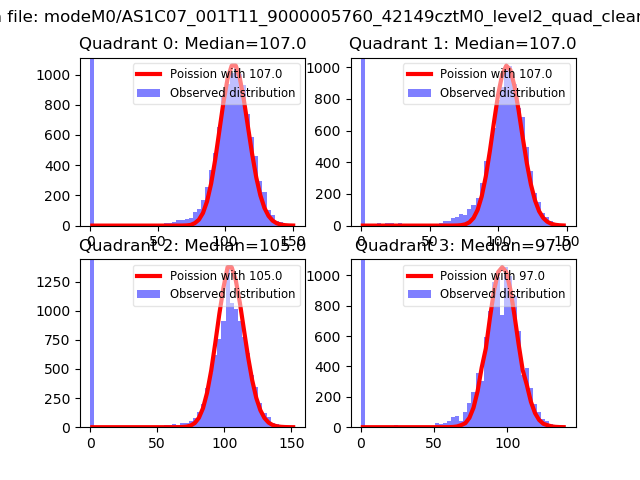 |
 |
| Quadrant-wise count rates Data is divided into 100 sec bins |
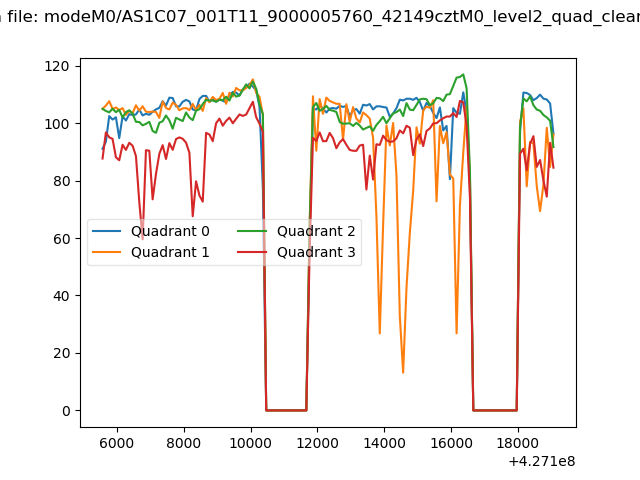 |
|
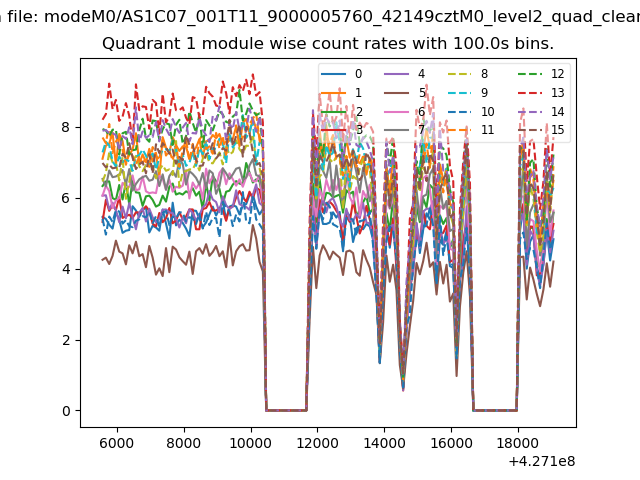
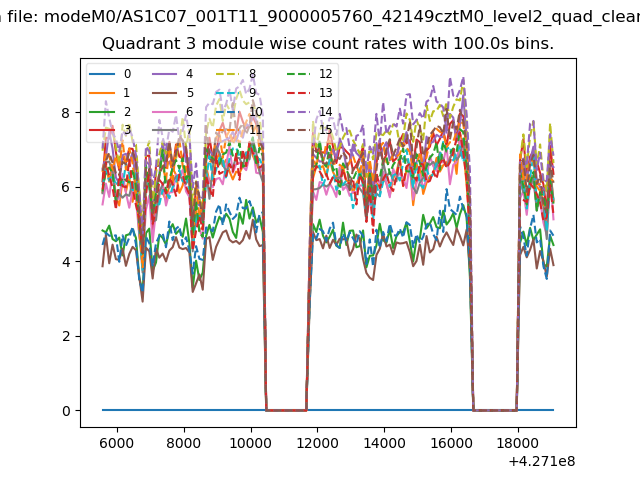
| Module-wise count rates for Quadrant A Data is divided into 100 sec bins |
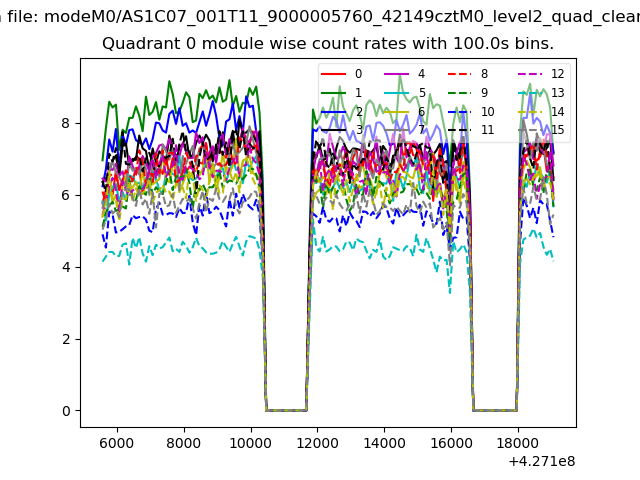 |
 |
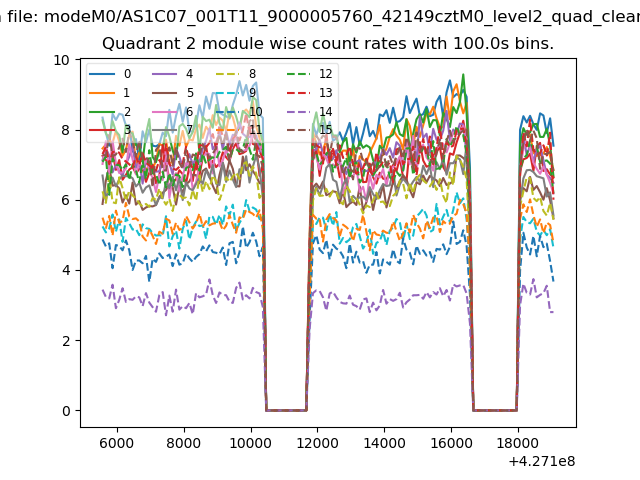
| Module-wise count rates for Quadrant B Data is divided into 100 sec bins |
 |
 |
| Module-wise count rates for Quadrant C Data is divided into 100 sec bins |
 |
 |
| Module-wise count rates for Quadrant D Data is divided into 100 sec bins |
 |
 |
| Parameter | Plot |
|---|---|
| CZT HV Monitor | 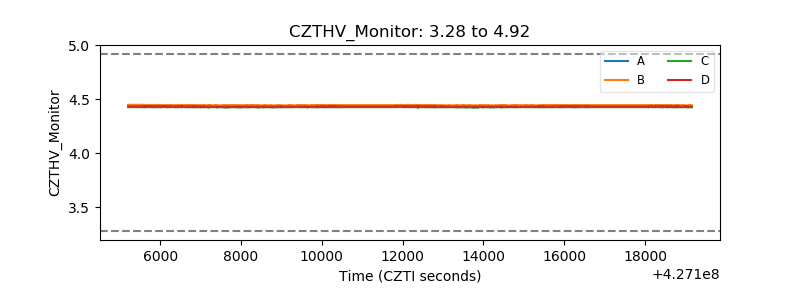 |
| D_VDD | 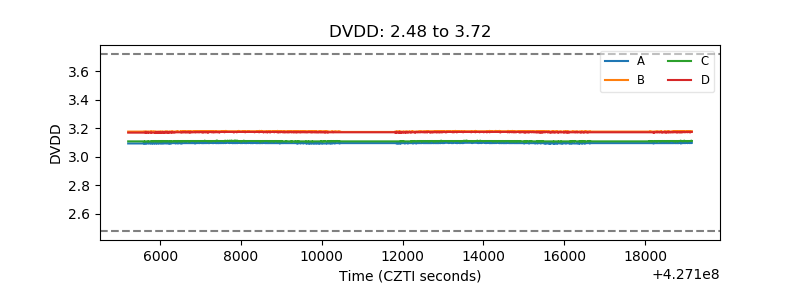 |
| Temperature 1 | 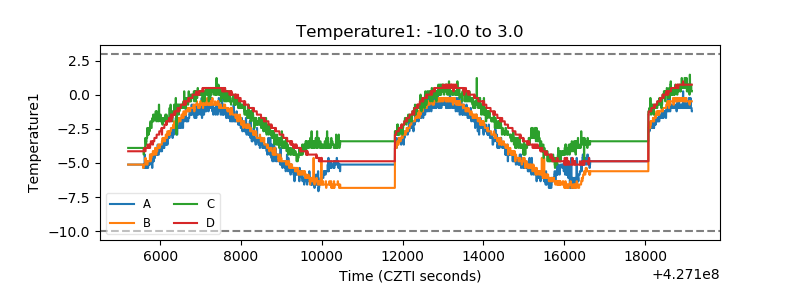 |
| Veto HV Monitor | 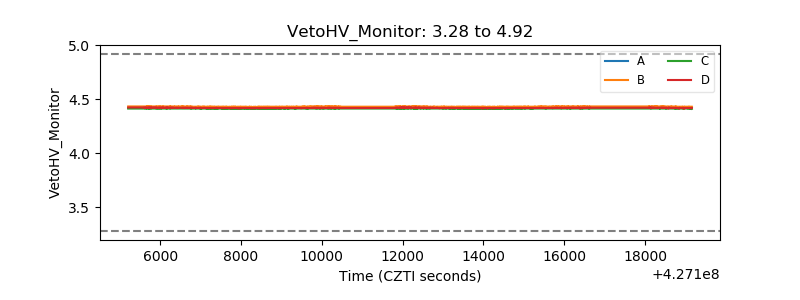 |
| Veto LLD | 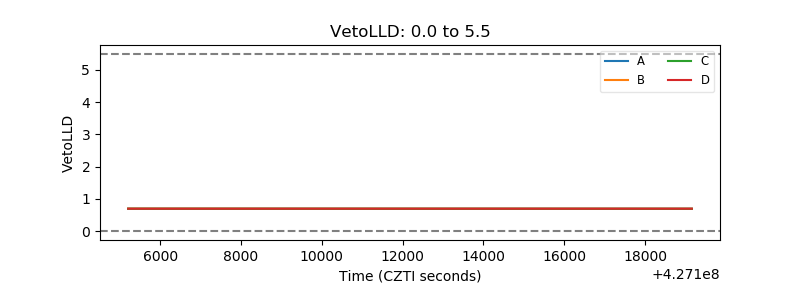 |
| Alpha Counter | 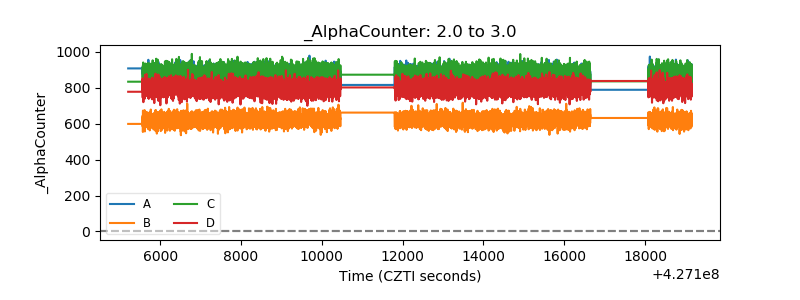 |
| _CPM_Rate | 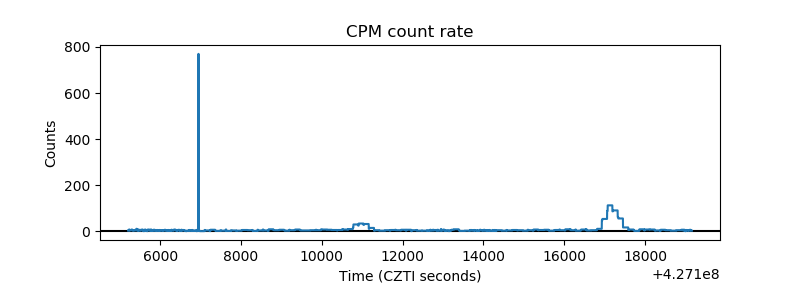 |
| CZT Counter | 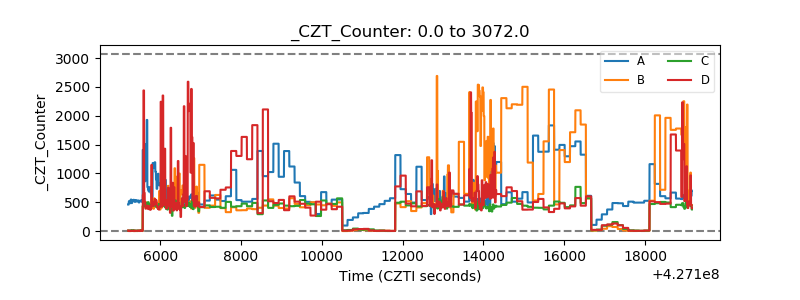 |
| +2.5 Volts monitor | 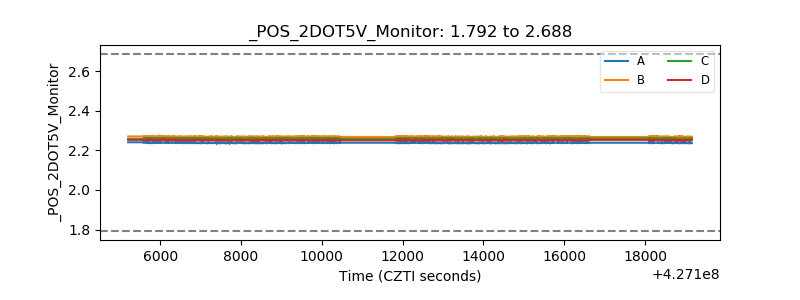 |
| +5 Volts monitor | 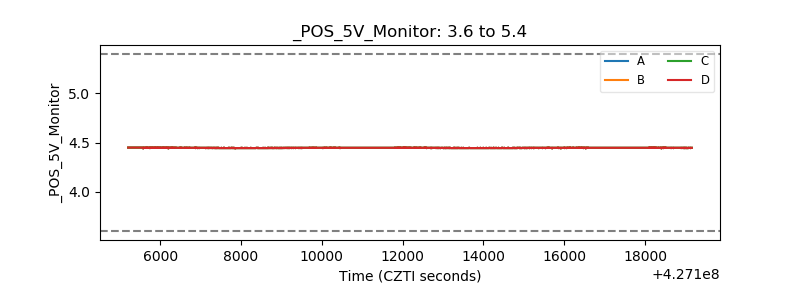 |
| _ROLL_ROT | 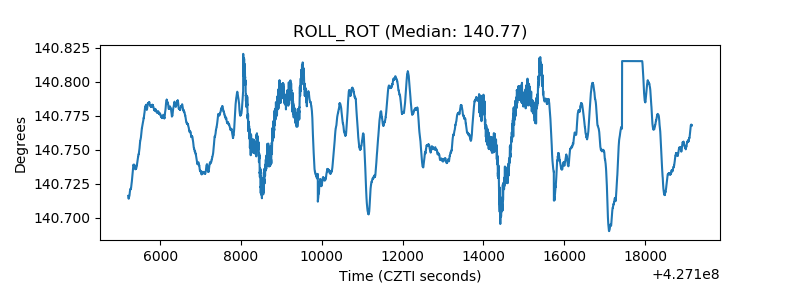 |
| _Roll_DEC |  |
| _Roll_RA | 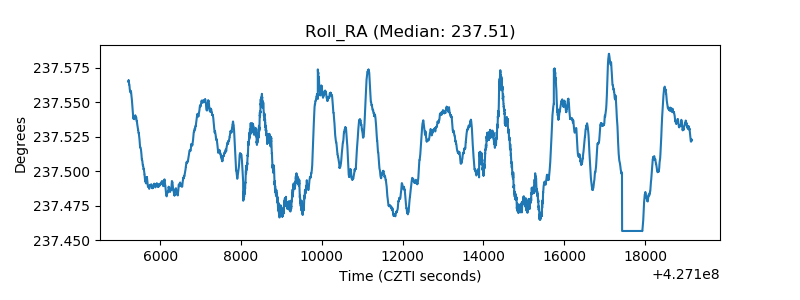 |
| Veto Counter | 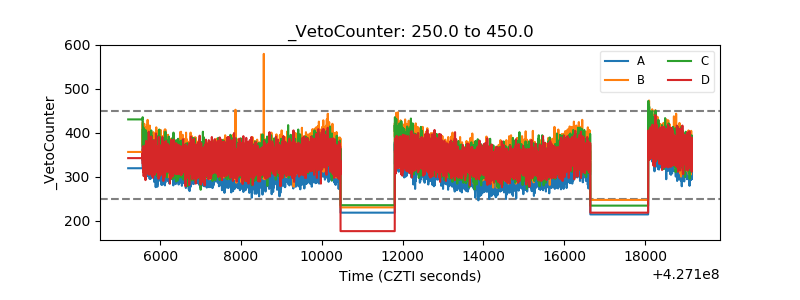 |