| Param | Original file | Final file |
|---|---|---|
| Filename | modeM0/AS1C07_001T11_9000005760_42151cztM0_level2.fits | modeM0/AS1C07_001T11_9000005760_42151cztM0_level2_quad_clean.evt |
| Size (bytes) | 378,020,160 | 89,648,640 |
| Size | 360.5 MB | 85.5 MB |
| Events in quadrant A | 3,442,840 | 608,162 |
| Events in quadrant B | 3,161,971 | 603,559 |
| Events in quadrant C | 2,526,408 | 595,498 |
| Events in quadrant D | 4,433,466 | 521,932 |
| Mode M0 | |||
|---|---|---|---|
| Quadrant | BADHDUFLAG | Total packets | Discarded packets |
| A | 0 | 13849 | 2 |
| B | 0 | 13210 | 2 |
| C | 0 | 11128 | 2 |
| D | 0 | 17027 | 2 |
| Mode M9 | |||
|---|---|---|---|
| Quadrant | BADHDUFLAG | Total packets | Discarded packets |
| A | 0 | 17 | 0 |
| B | 0 | 17 | 0 |
| C | 0 | 17 | 0 |
| D | 0 | 17 | 0 |
| Mode SS | |||
|---|---|---|---|
| Quadrant | BADHDUFLAG | Total packets | Discarded packets |
| A | 0 | 112 | 0 |
| B | 0 | 112 | 0 |
| C | 0 | 112 | 0 |
| D | 0 | 112 | 0 |
| Quadrant | Total seconds | Saturated seconds | Saturation percentage |
|---|---|---|---|
| A | 5504 | 33 | 0.599564% |
| B | 5505 | 135 | 2.452316% |
| C | 5504 | 5 | 0.090843% |
| D | 5504 | 433 | 7.867006% |
Noise dominated data is calculated using 1-second bins in cleaned event files. If a bin has >2000 counts, and if more than 50% of those come from <1% of pixels, then it is considered to be noise-dominated and hence unusable.
| Quadrant | # 1 sec bins | Bins with >0 counts | Bins with >2000 counts | High rate bins dominated by noise | Noise dominated (total time) | Noise dominated (detector-on time) | Marked lightcurve |
|---|---|---|---|---|---|---|---|
| A | 7206 | 5505 | 13 | 13 | 0.18% | 0.24% | 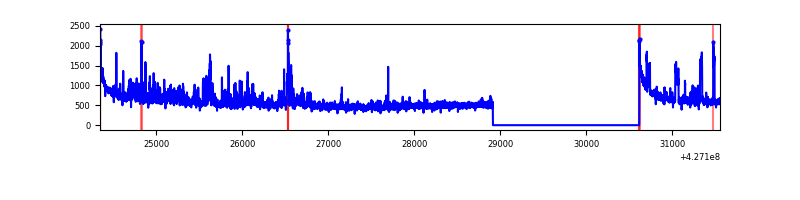 |
| B | 7207 | 5506 | 85 | 85 | 1.18% | 1.54% | 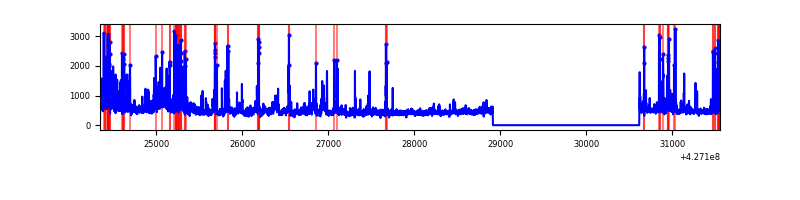 |
| C | 7206 | 5505 | 2 | 2 | 0.03% | 0.04% | 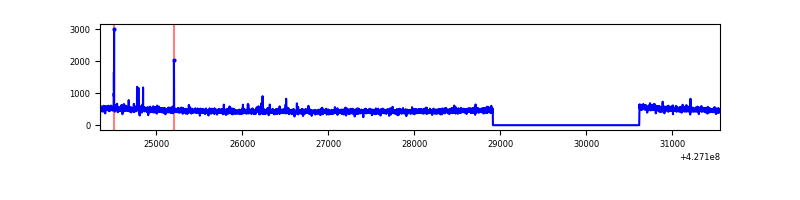 |
| D | 7206 | 5505 | 378 | 378 | 5.25% | 6.87% | 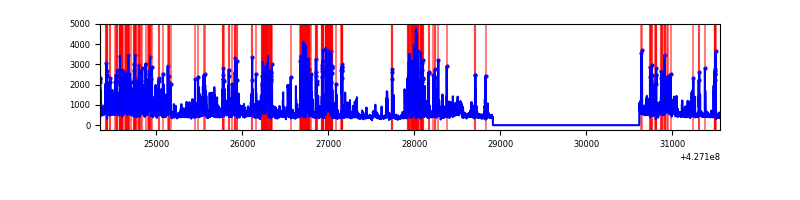 |
Top three noisy pixels from each quadrant. If the there are fewer than three noisy pixels in the level2.evt file, extra rows are filled as -1
| Pixel properties | Quadrant properties | ||||||
|---|---|---|---|---|---|---|---|
| Quadrant | DetID | PixID | Counts | Sigma | Mean | Median | Sigma |
| A | 10 | 83 | 646761 | 5302.81 | 591 | 577 | 121.9 |
| A | 12 | 189 | 281806 | 2307.86 | 591 | 577 | 121.9 |
| A | 15 | 223 | 113254 | 924.67 | 591 | 577 | 121.9 |
| B | 4 | 171 | 213108 | 1894.02 | 583 | 566 | 112.2 |
| B | 15 | 35 | 170912 | 1518.0 | 583 | 566 | 112.2 |
| B | 0 | 156 | 127014 | 1126.81 | 583 | 566 | 112.2 |
| C | 15 | 214 | 233730 | 1724.65 | 580 | 584 | 135.2 |
| C | 12 | 249 | 12881 | 90.96 | 580 | 584 | 135.2 |
| C | 15 | 159 | 9234 | 63.99 | 580 | 584 | 135.2 |
| D | 1 | 47 | 763467 | 5510.47 | 565 | 550 | 138.4 |
| D | 1 | 52 | 491186 | 3543.81 | 565 | 550 | 138.4 |
| D | 6 | 252 | 403142 | 2907.88 | 565 | 550 | 138.4 |
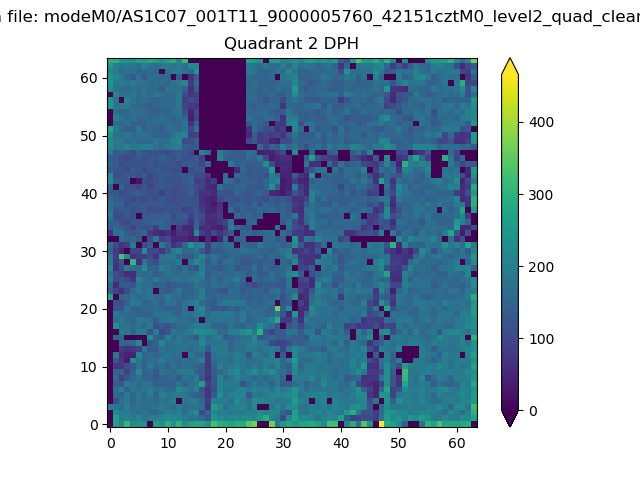
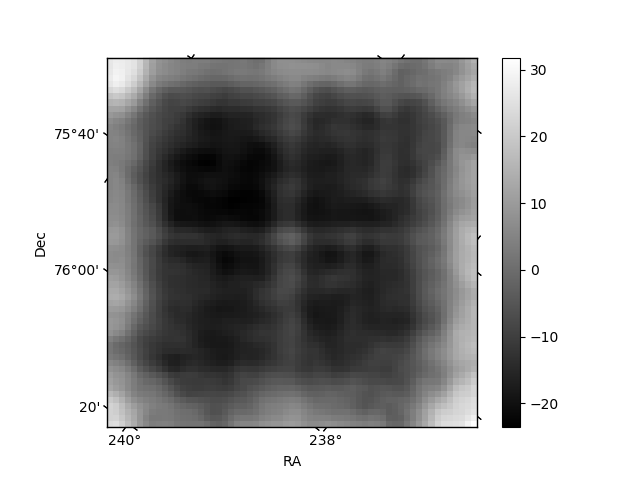
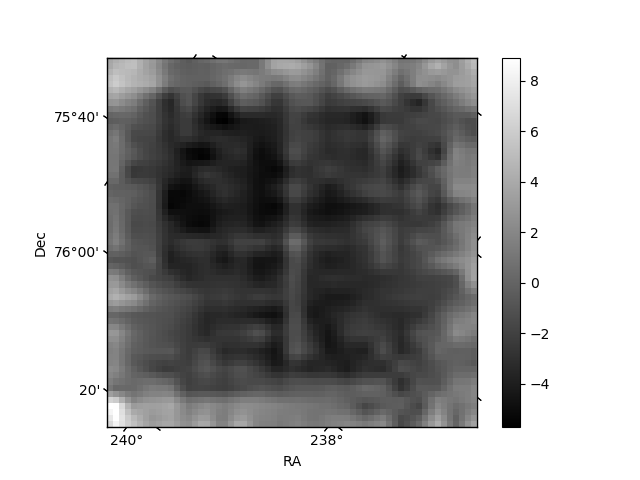
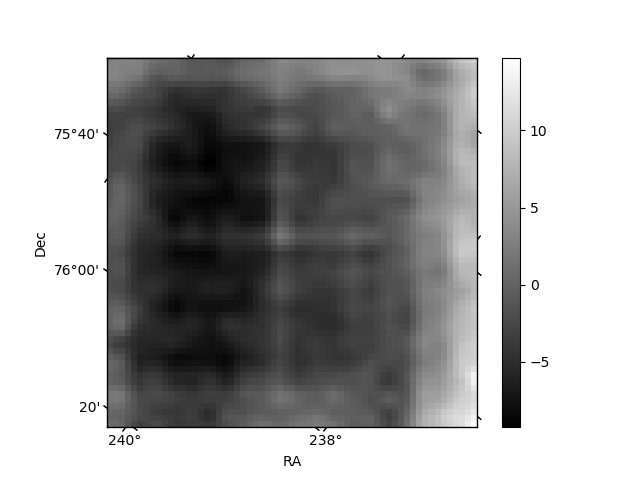
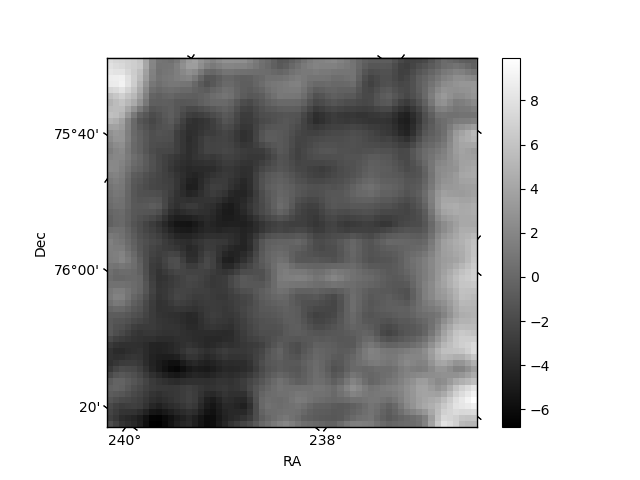
Histogram calculated using DETX and DETY for each event in the final _common_clean file
| Quadrant A | 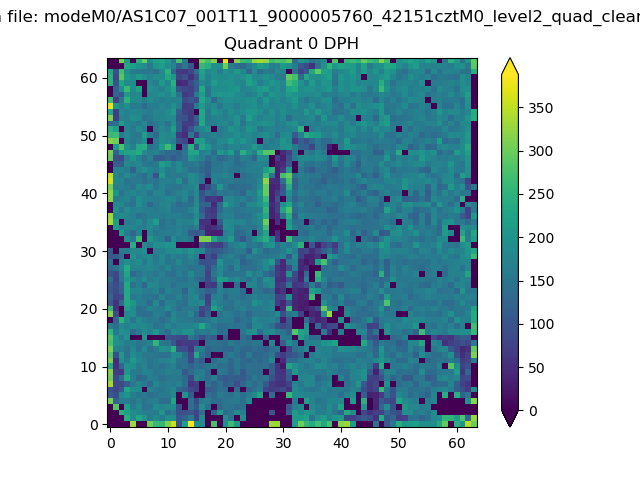 |
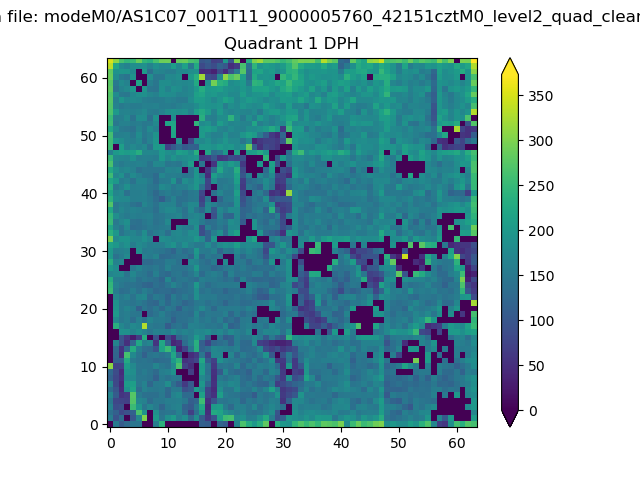 |
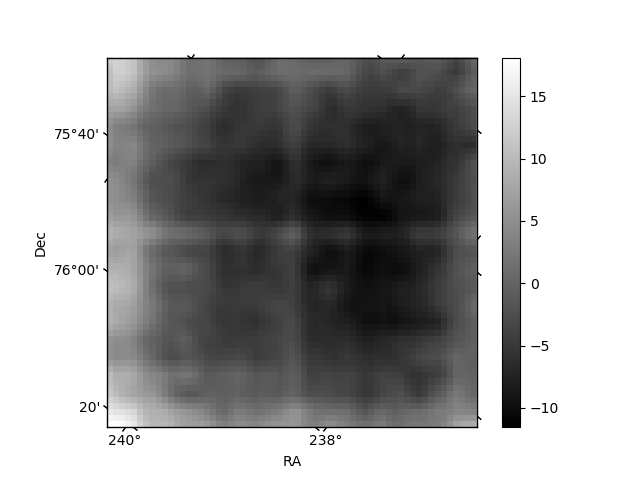
Quadrant B |
|---|---|---|---|
| Quadrant D | 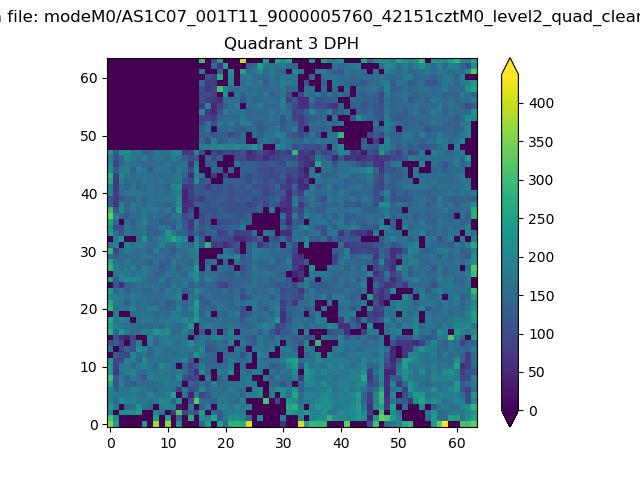 |
 |
Quadrant C |
| Plot type | Count rate plots | Images |
|---|---|---|
| Comparison with Poisson distribution Blue bars denote a histogram of data divided into 1 sec bins. Red curve is a Poisson curve with rate = median count rate of data. |
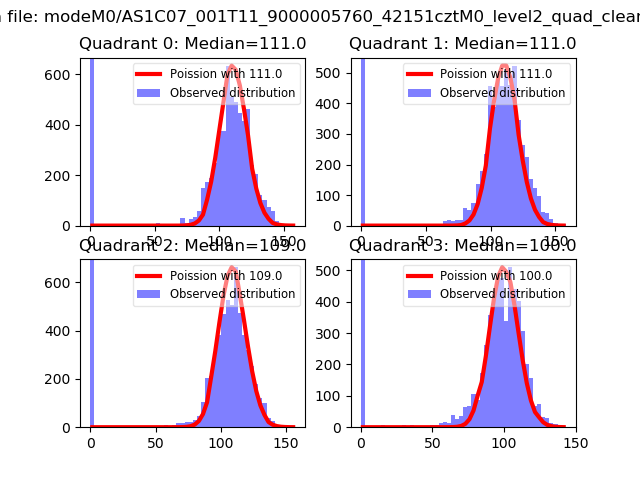 |
 |
| Quadrant-wise count rates Data is divided into 100 sec bins |
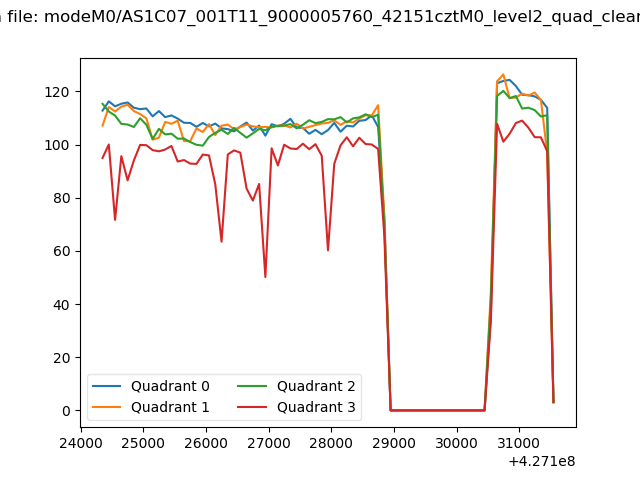 |
|
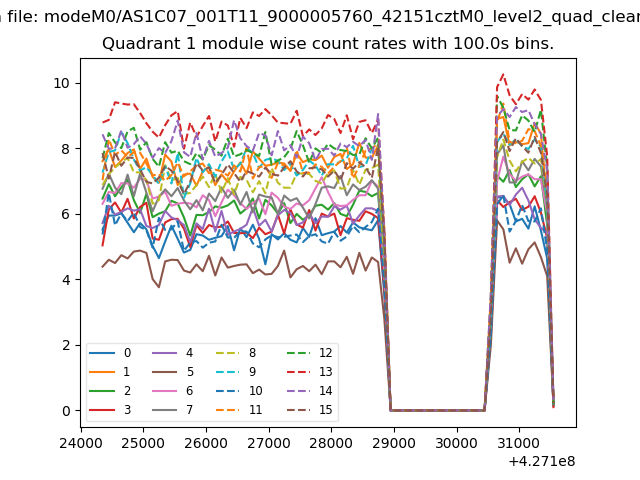
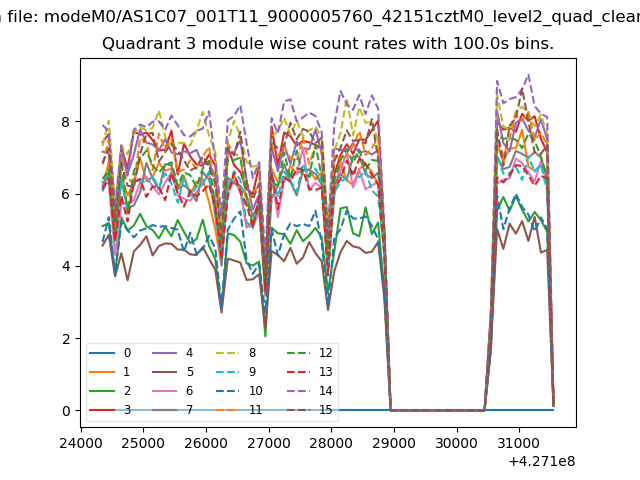
| Module-wise count rates for Quadrant A Data is divided into 100 sec bins |
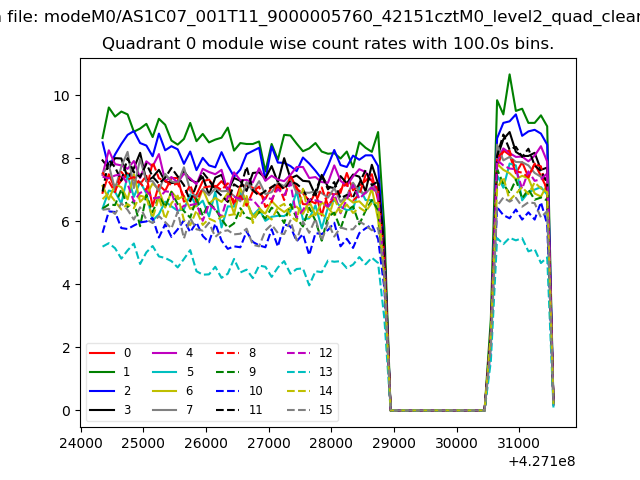 |
 |
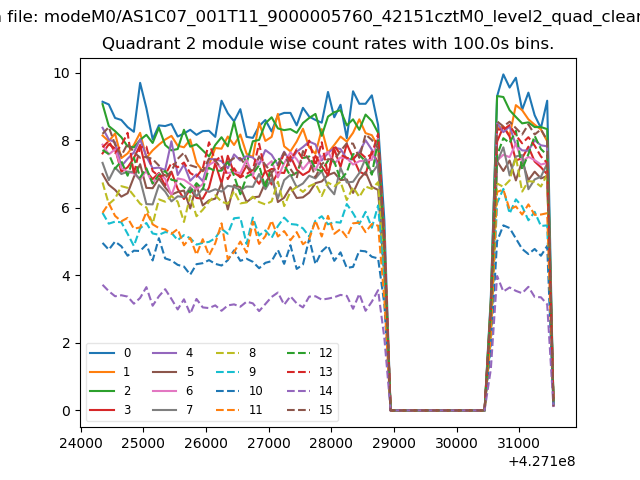
| Module-wise count rates for Quadrant B Data is divided into 100 sec bins |
 |
 |
| Module-wise count rates for Quadrant C Data is divided into 100 sec bins |
 |
 |
| Module-wise count rates for Quadrant D Data is divided into 100 sec bins |
 |
 |
| Parameter | Plot |
|---|---|
| CZT HV Monitor | 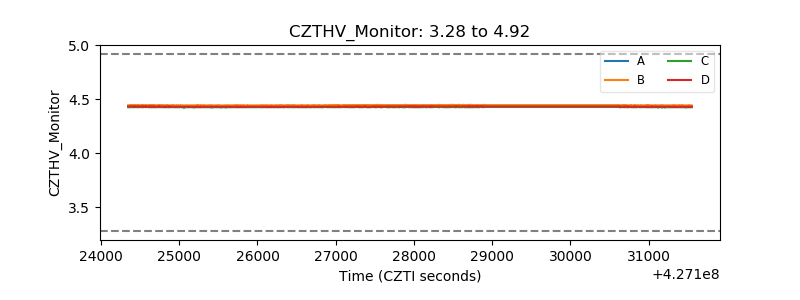 |
| D_VDD | 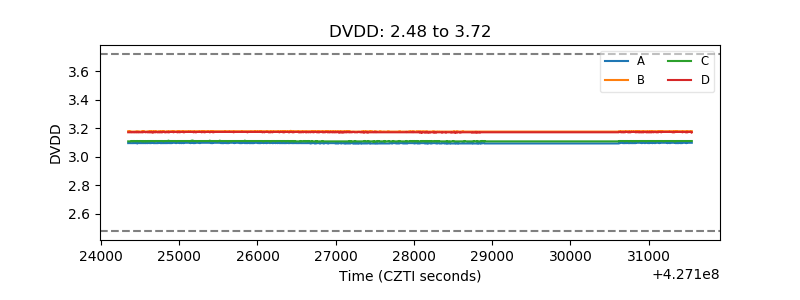 |
| Temperature 1 | 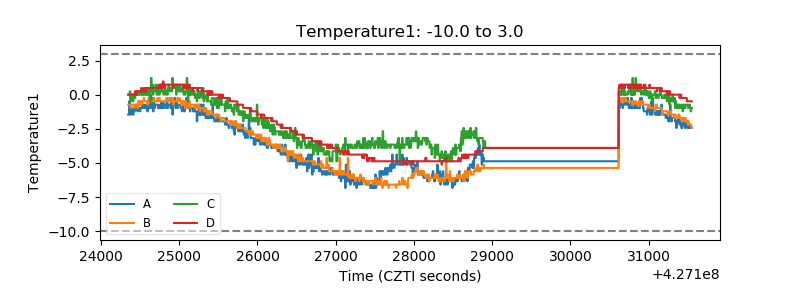 |
| Veto HV Monitor | 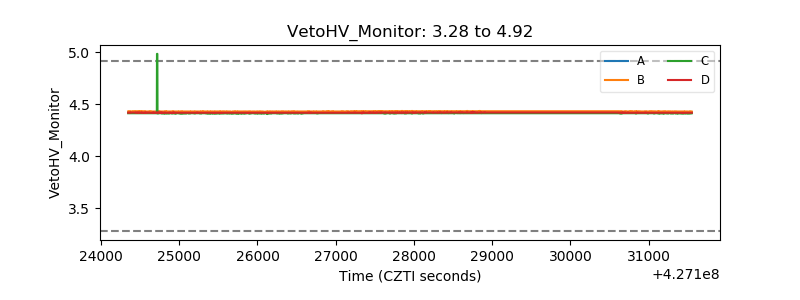 |
| Veto LLD | 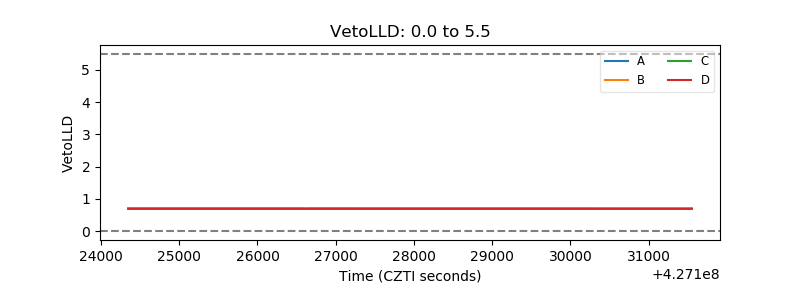 |
| Alpha Counter | 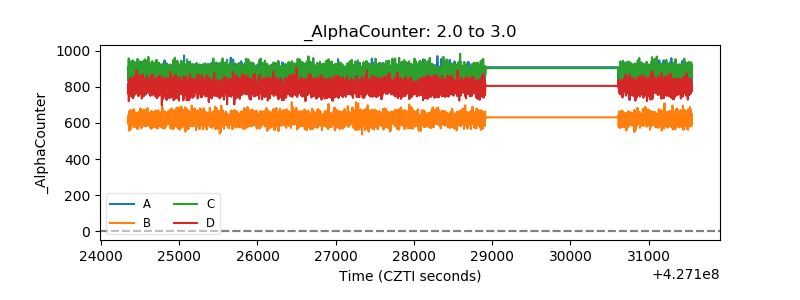 |
| _CPM_Rate | 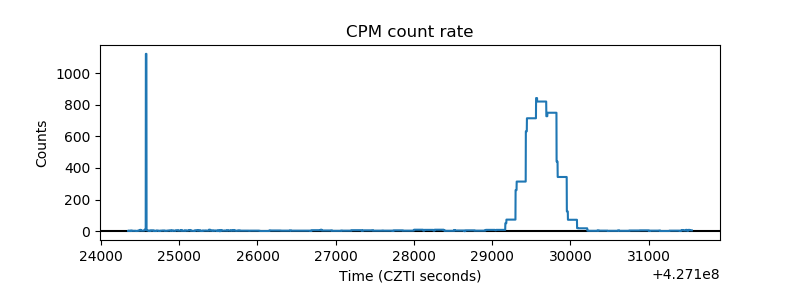 |
| CZT Counter | 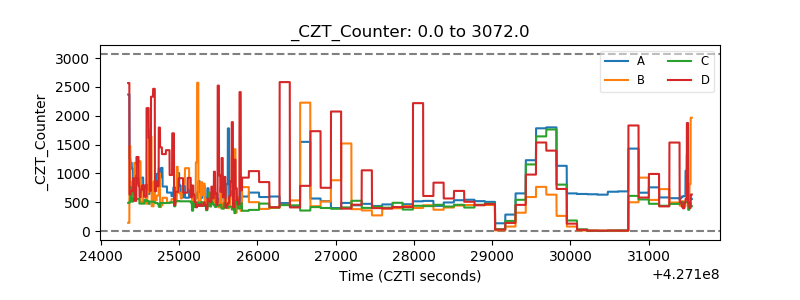 |
| +2.5 Volts monitor | 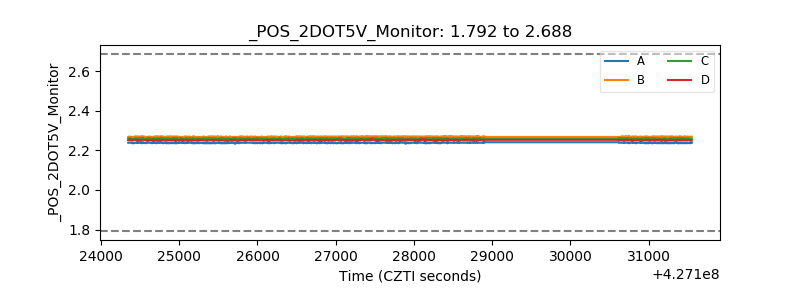 |
| +5 Volts monitor | 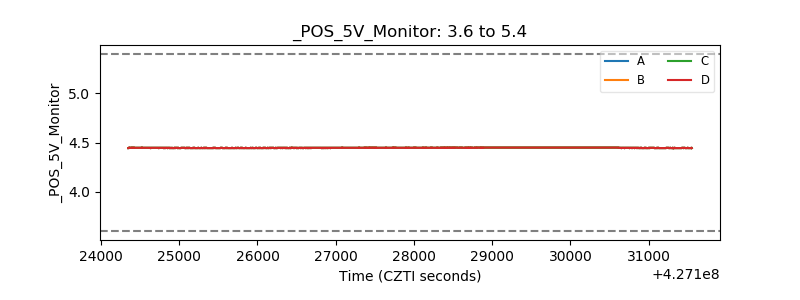 |
| _ROLL_ROT |  |
| _Roll_DEC | 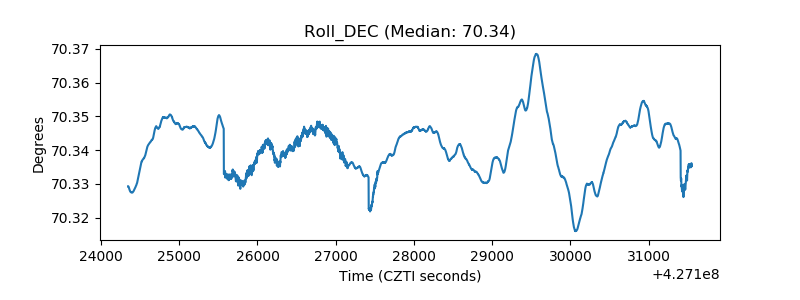 |
| _Roll_RA | 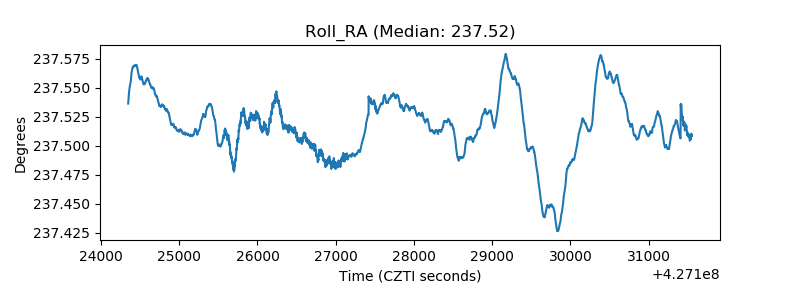 |
| Veto Counter | 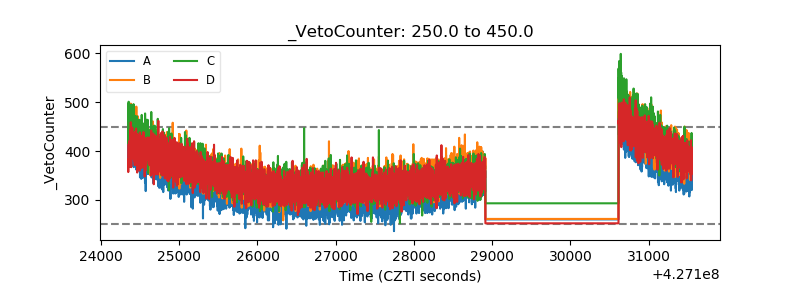 |