| Param | Original file | Final file |
|---|---|---|
| Filename | modeM0/AS1C07_001T11_9000005760_42153cztM0_level2.fits | modeM0/AS1C07_001T11_9000005760_42153cztM0_level2_quad_clean.evt |
| Size (bytes) | 316,670,400 | 88,272,000 |
| Size | 302.0 MB | 84.2 MB |
| Events in quadrant A | 3,198,880 | 589,639 |
| Events in quadrant B | 2,628,407 | 594,870 |
| Events in quadrant C | 2,410,073 | 586,778 |
| Events in quadrant D | 3,078,616 | 536,420 |
| Mode M0 | |||
|---|---|---|---|
| Quadrant | BADHDUFLAG | Total packets | Discarded packets |
| A | 0 | 12960 | 2 |
| B | 0 | 11519 | 2 |
| C | 0 | 10544 | 2 |
| D | 0 | 12910 | 2 |
| Mode M9 | |||
|---|---|---|---|
| Quadrant | BADHDUFLAG | Total packets | Discarded packets |
| A | 0 | 21 | 0 |
| B | 0 | 21 | 0 |
| C | 0 | 22 | 0 |
| D | 0 | 22 | 0 |
| Mode SS | |||
|---|---|---|---|
| Quadrant | BADHDUFLAG | Total packets | Discarded packets |
| A | 0 | 106 | 0 |
| B | 0 | 106 | 0 |
| C | 0 | 106 | 0 |
| D | 0 | 106 | 0 |
| Quadrant | Total seconds | Saturated seconds | Saturation percentage |
|---|---|---|---|
| A | 5211 | 44 | 0.844368% |
| B | 5211 | 66 | 1.266552% |
| C | 5211 | 2 | 0.038380% |
| D | 5211 | 110 | 2.110919% |
Noise dominated data is calculated using 1-second bins in cleaned event files. If a bin has >2000 counts, and if more than 50% of those come from <1% of pixels, then it is considered to be noise-dominated and hence unusable.
| Quadrant | # 1 sec bins | Bins with >0 counts | Bins with >2000 counts | High rate bins dominated by noise | Noise dominated (total time) | Noise dominated (detector-on time) | Marked lightcurve |
|---|---|---|---|---|---|---|---|
| A | 7063 | 5212 | 21 | 21 | 0.30% | 0.40% | 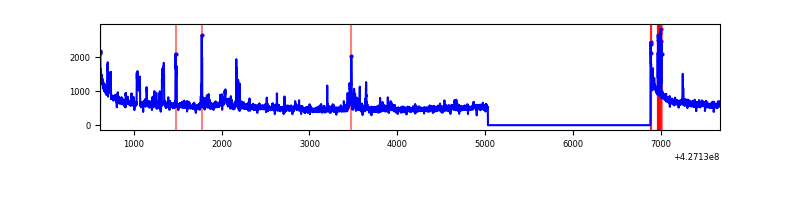 |
| B | 7063 | 5212 | 40 | 40 | 0.57% | 0.77% | 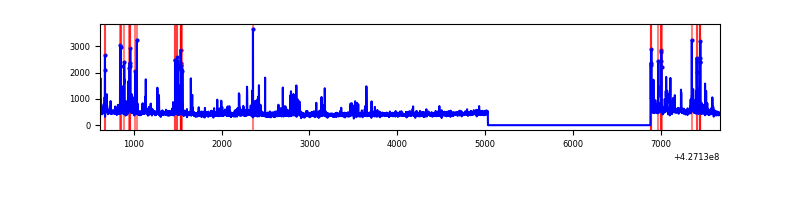 |
| C | 7063 | 5212 | 0 | 0 | 0.00% | 0.00% | 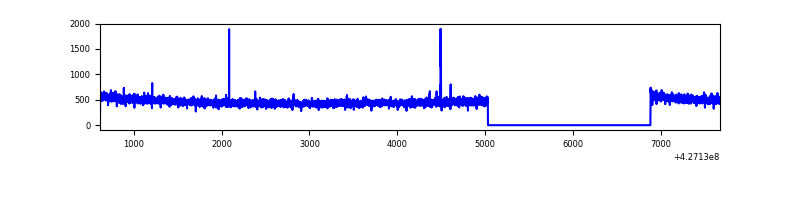 |
| D | 7063 | 5212 | 99 | 99 | 1.40% | 1.90% | 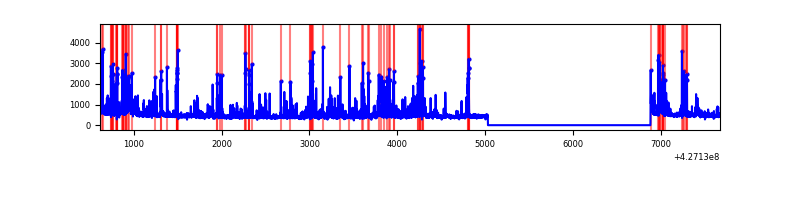 |
Top three noisy pixels from each quadrant. If the there are fewer than three noisy pixels in the level2.evt file, extra rows are filled as -1
| Pixel properties | Quadrant properties | ||||||
|---|---|---|---|---|---|---|---|
| Quadrant | DetID | PixID | Counts | Sigma | Mean | Median | Sigma |
| A | 10 | 83 | 612892 | 5320.2 | 560 | 548 | 115.1 |
| A | 15 | 223 | 192729 | 1669.72 | 560 | 548 | 115.1 |
| A | 12 | 189 | 154205 | 1335.01 | 560 | 548 | 115.1 |
| B | 4 | 171 | 180011 | 1718.41 | 558 | 543 | 104.4 |
| B | 15 | 35 | 107496 | 1024.08 | 558 | 543 | 104.4 |
| B | 5 | 255 | 46751 | 442.44 | 558 | 543 | 104.4 |
| C | 15 | 214 | 219866 | 1700.07 | 556 | 560 | 129.0 |
| C | 15 | 159 | 11997 | 88.66 | 556 | 560 | 129.0 |
| C | 3 | 233 | 4058 | 27.12 | 556 | 560 | 129.0 |
| D | 6 | 252 | 315819 | 2360.45 | 552 | 536 | 133.6 |
| D | 13 | 249 | 138996 | 1036.62 | 552 | 536 | 133.6 |
| D | 1 | 47 | 127290 | 948.98 | 552 | 536 | 133.6 |
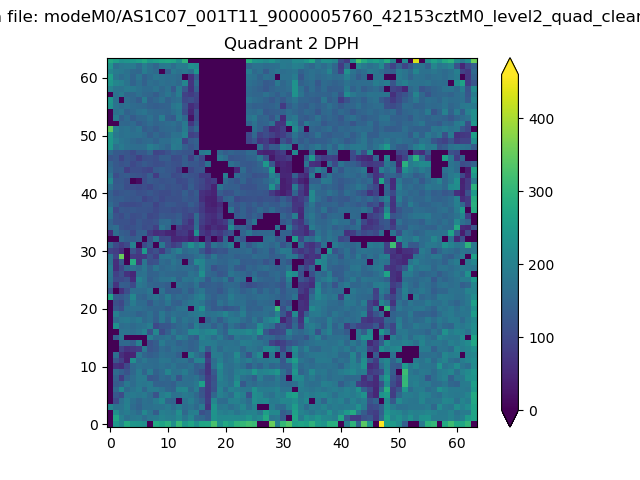
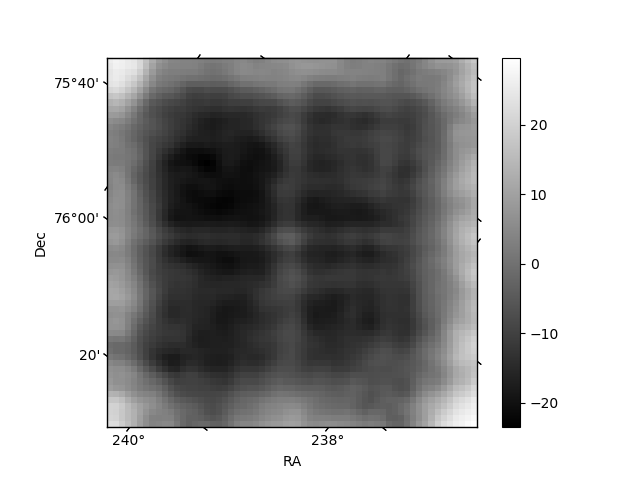
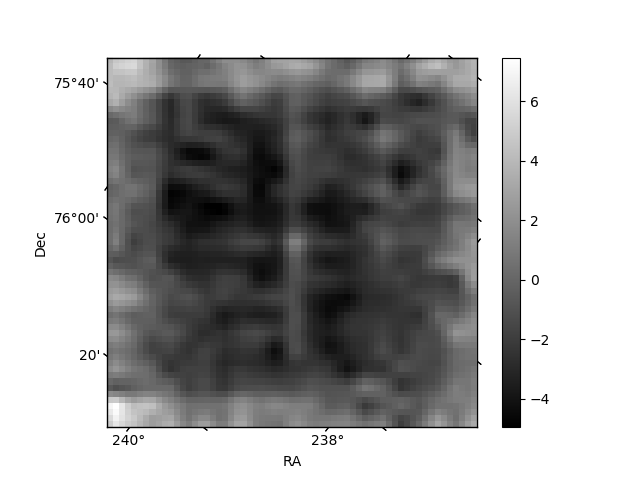
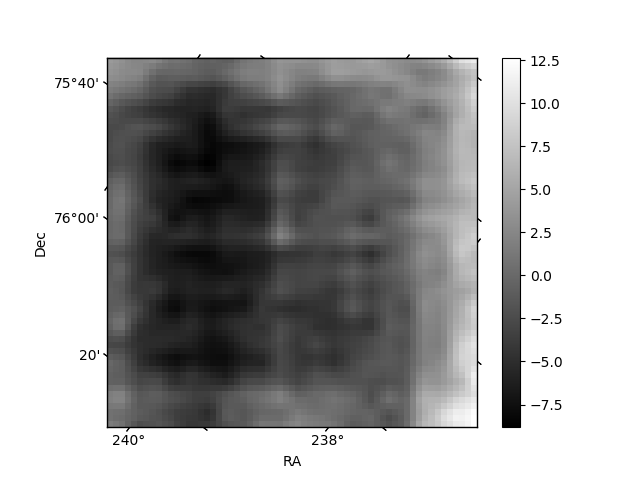
Histogram calculated using DETX and DETY for each event in the final _common_clean file
| Quadrant A | 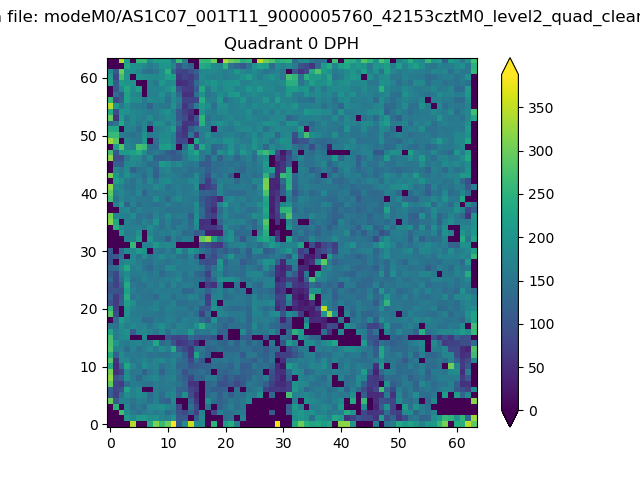 |
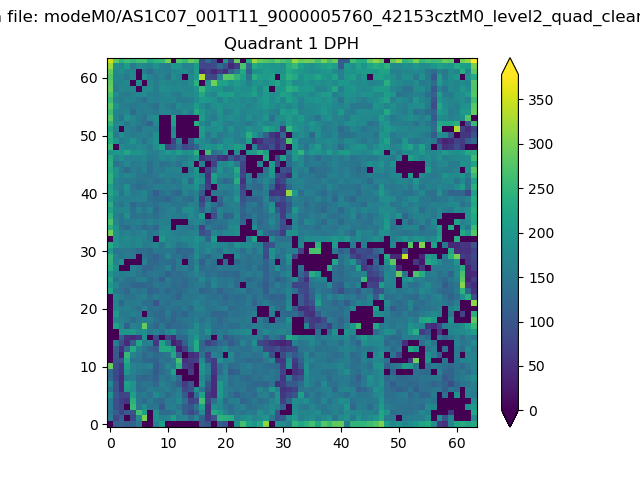 |
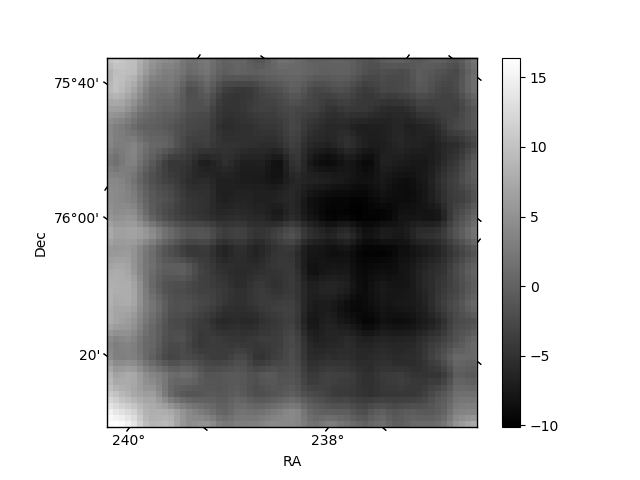
Quadrant B |
|---|---|---|---|
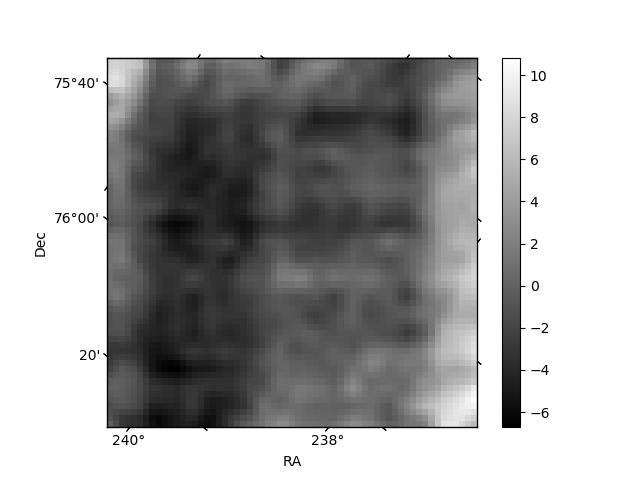
| Quadrant D | 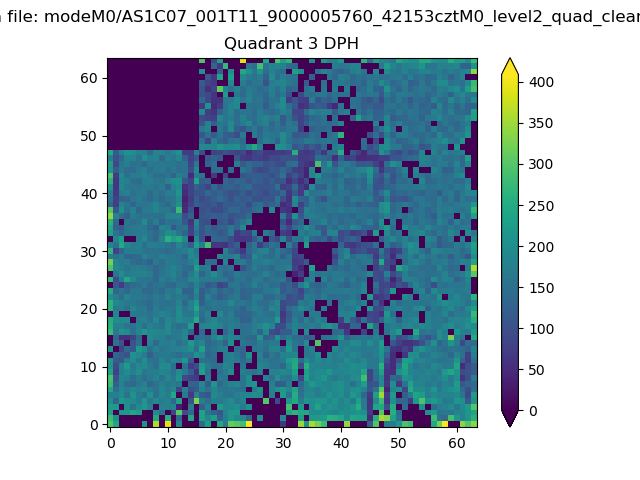 |
 |
Quadrant C |
| Plot type | Count rate plots | Images |
|---|---|---|
| Comparison with Poisson distribution Blue bars denote a histogram of data divided into 1 sec bins. Red curve is a Poisson curve with rate = median count rate of data. |
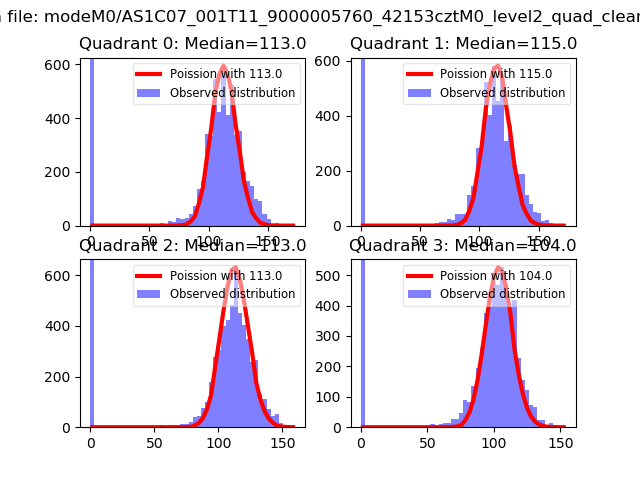 |
 |
| Quadrant-wise count rates Data is divided into 100 sec bins |
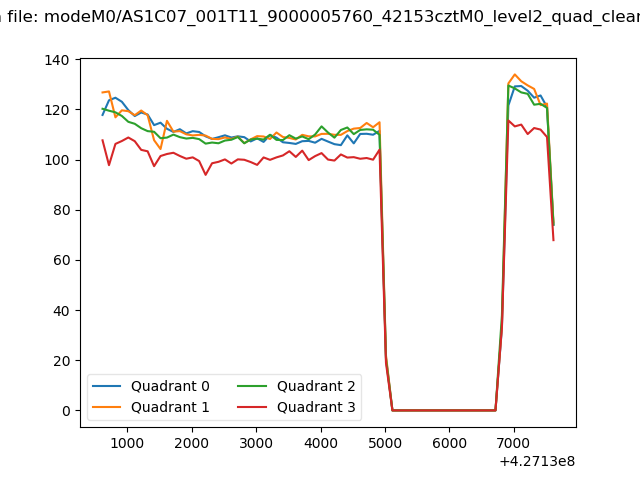 |
|
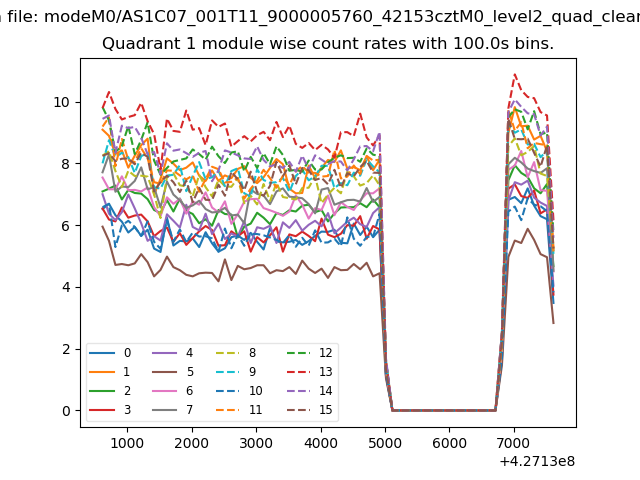
| Module-wise count rates for Quadrant A Data is divided into 100 sec bins |
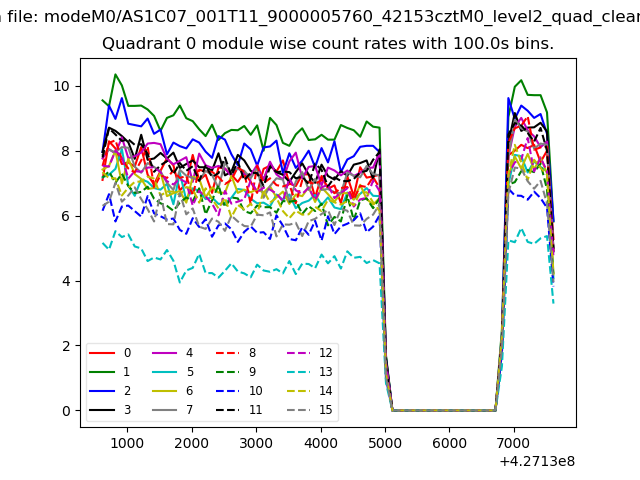 |
 |
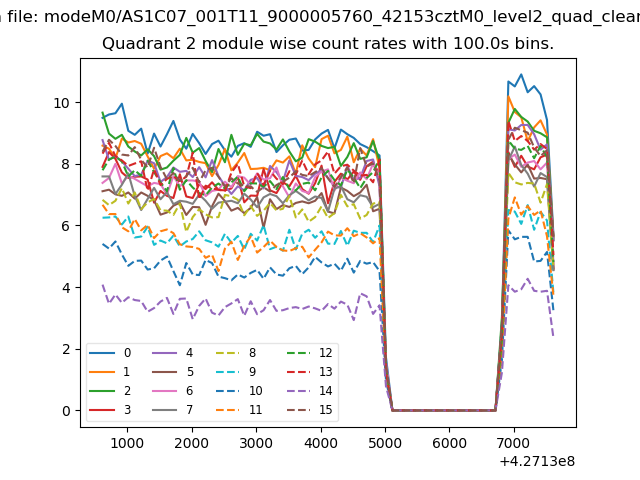
| Module-wise count rates for Quadrant B Data is divided into 100 sec bins |
 |
 |
| Module-wise count rates for Quadrant C Data is divided into 100 sec bins |
 |
 |
| Module-wise count rates for Quadrant D Data is divided into 100 sec bins |
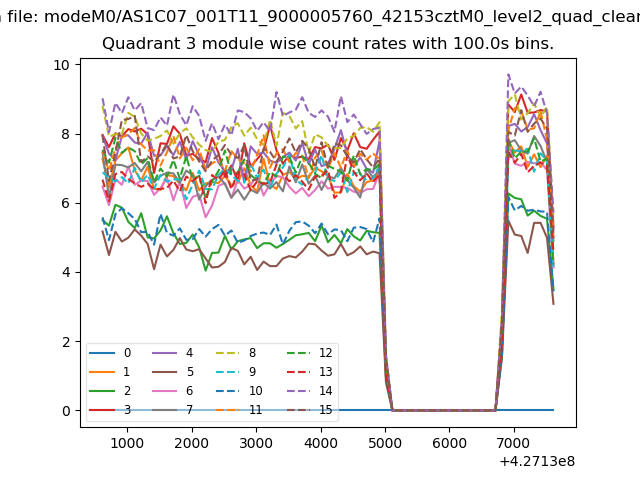 |
 |
| Parameter | Plot |
|---|---|
| CZT HV Monitor | 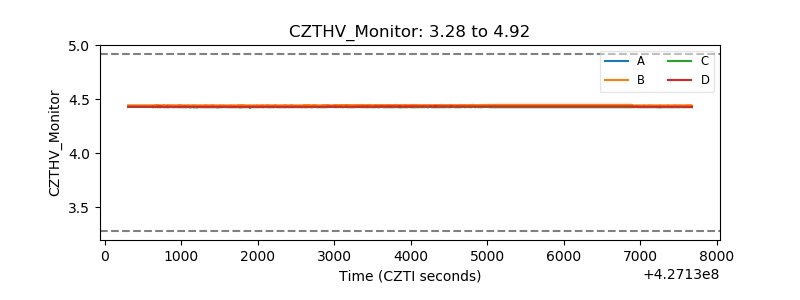 |
| D_VDD | 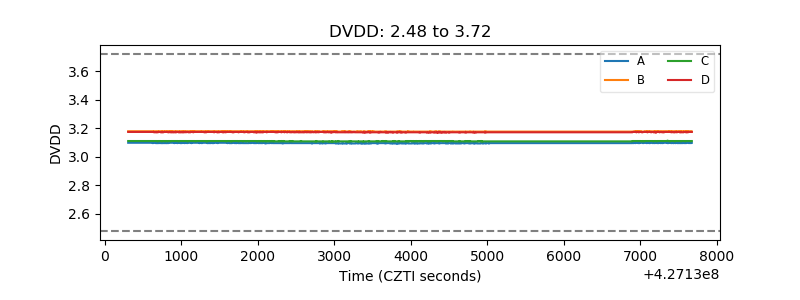 |
| Temperature 1 | 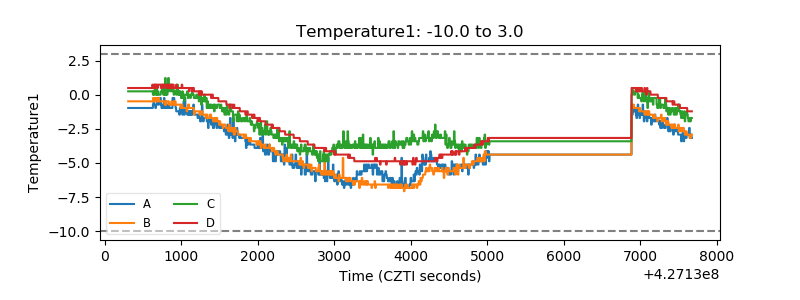 |
| Veto HV Monitor | 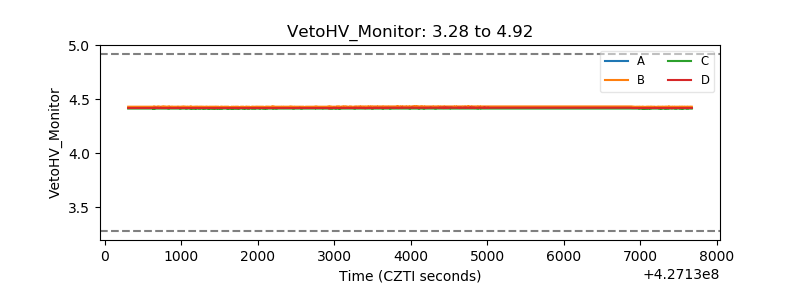 |
| Veto LLD | 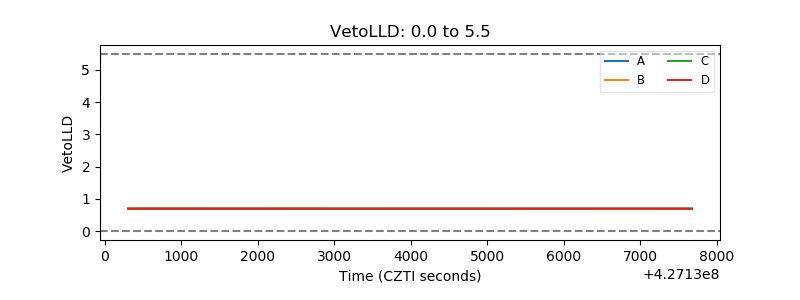 |
| Alpha Counter | 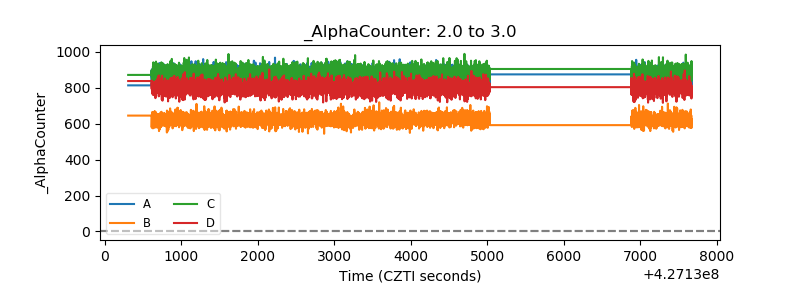 |
| _CPM_Rate | 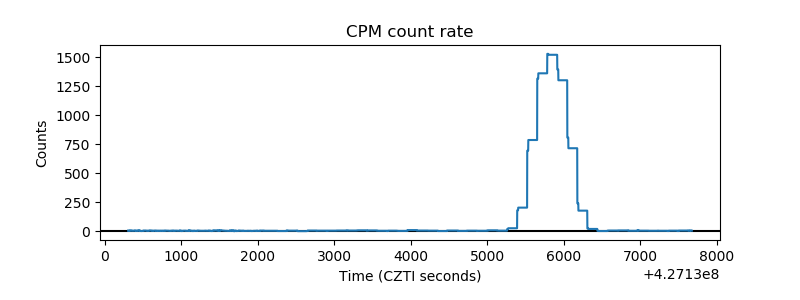 |
| CZT Counter | 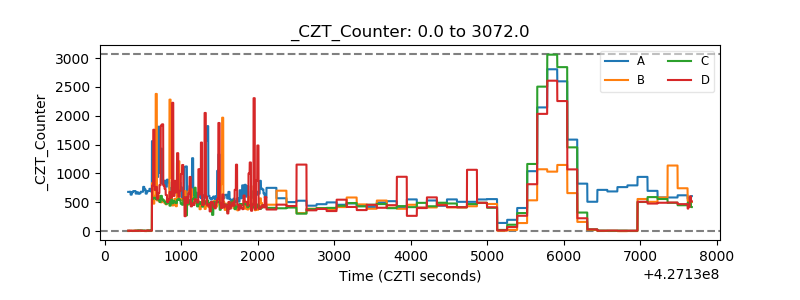 |
| +2.5 Volts monitor | 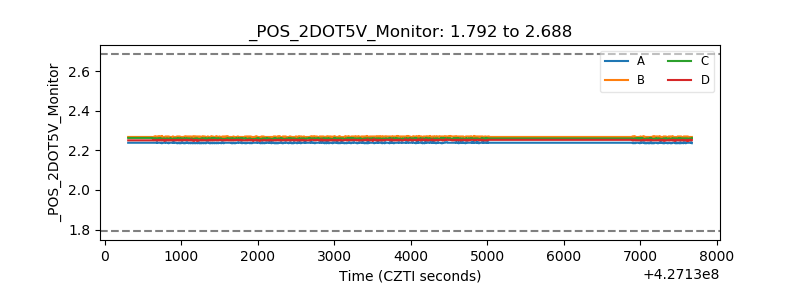 |
| +5 Volts monitor | 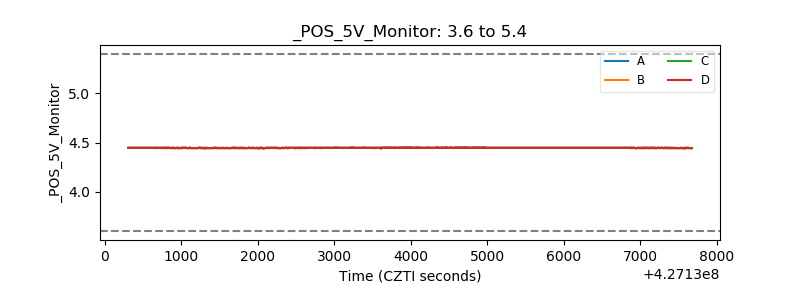 |
| _ROLL_ROT | 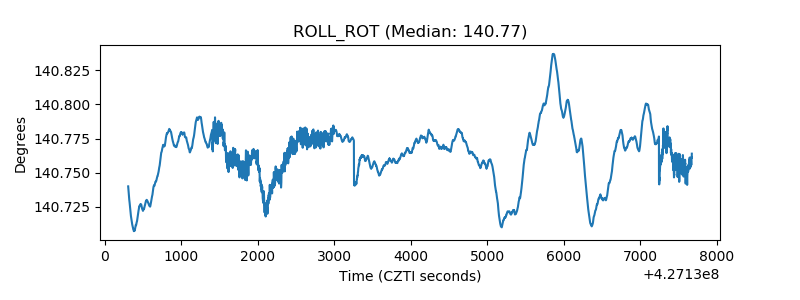 |
| _Roll_DEC | 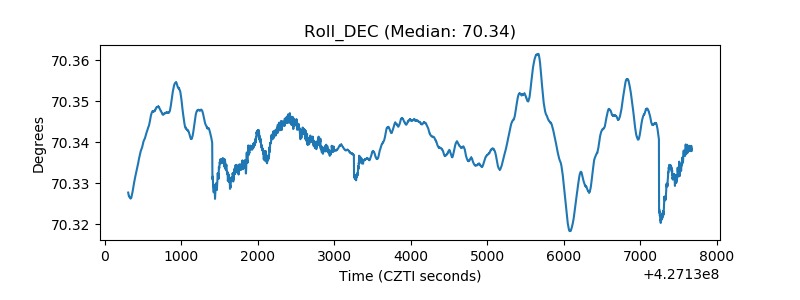 |
| _Roll_RA | 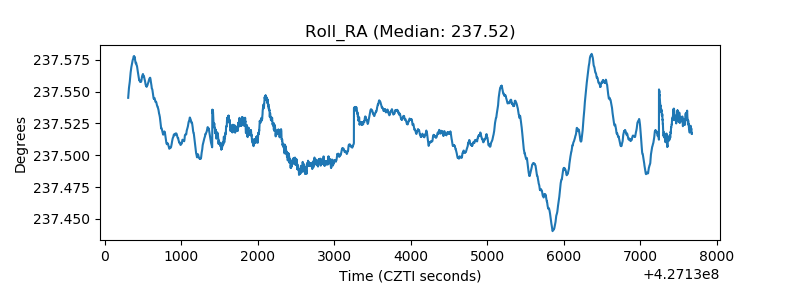 |
| Veto Counter |  |