| Param | Original file | Final file |
|---|---|---|
| Filename | modeM0/AS1C07_001T11_9000005760_42155cztM0_level2.fits | modeM0/AS1C07_001T11_9000005760_42155cztM0_level2_quad_clean.evt |
| Size (bytes) | 278,784,000 | 73,319,040 |
| Size | 265.9 MB | 69.9 MB |
| Events in quadrant A | 2,480,472 | 487,009 |
| Events in quadrant B | 2,192,613 | 502,343 |
| Events in quadrant C | 1,947,301 | 500,308 |
| Events in quadrant D | 3,370,294 | 433,608 |
| Mode M0 | |||
|---|---|---|---|
| Quadrant | BADHDUFLAG | Total packets | Discarded packets |
| A | 0 | 10019 | 1 |
| B | 0 | 9537 | 1 |
| C | 0 | 8499 | 1 |
| D | 0 | 12948 | 1 |
| Mode M9 | |||
|---|---|---|---|
| Quadrant | BADHDUFLAG | Total packets | Discarded packets |
| A | 0 | 26 | 0 |
| B | 0 | 27 | 0 |
| C | 0 | 27 | 0 |
| D | 0 | 27 | 0 |
| Mode SS | |||
|---|---|---|---|
| Quadrant | BADHDUFLAG | Total packets | Discarded packets |
| A | 0 | 86 | 0 |
| B | 0 | 86 | 0 |
| C | 0 | 86 | 0 |
| D | 0 | 86 | 0 |
| Quadrant | Total seconds | Saturated seconds | Saturation percentage |
|---|---|---|---|
| A | 4216 | 64 | 1.518027% |
| B | 4216 | 55 | 1.304554% |
| C | 4216 | 2 | 0.047438% |
| D | 4216 | 309 | 7.329222% |
Noise dominated data is calculated using 1-second bins in cleaned event files. If a bin has >2000 counts, and if more than 50% of those come from <1% of pixels, then it is considered to be noise-dominated and hence unusable.
| Quadrant | # 1 sec bins | Bins with >0 counts | Bins with >2000 counts | High rate bins dominated by noise | Noise dominated (total time) | Noise dominated (detector-on time) | Marked lightcurve |
|---|---|---|---|---|---|---|---|
| A | 6279 | 4217 | 43 | 43 | 0.68% | 1.02% | 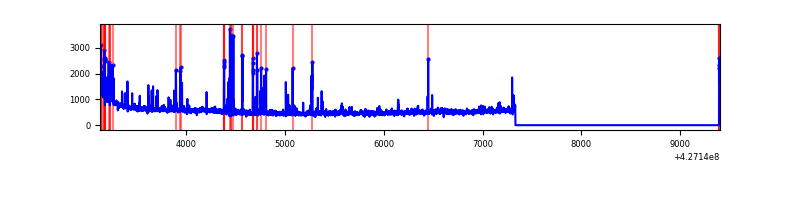 |
| B | 6279 | 4217 | 34 | 34 | 0.54% | 0.81% | 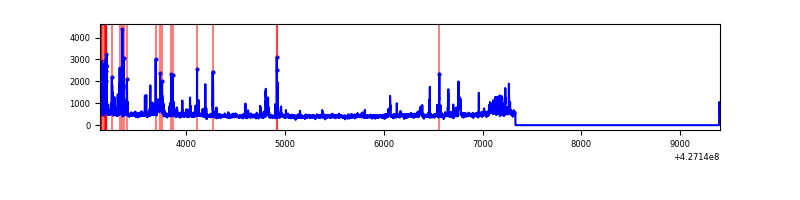 |
| C | 6279 | 4217 | 0 | 0 | 0.00% | 0.00% | 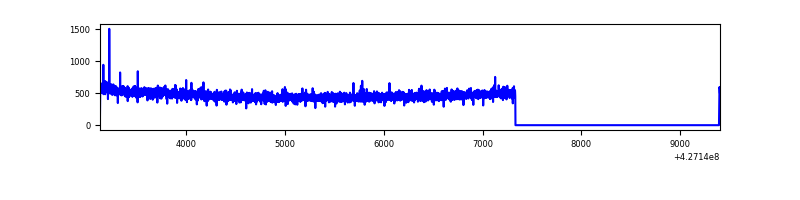 |
| D | 6278 | 4216 | 283 | 283 | 4.51% | 6.71% | 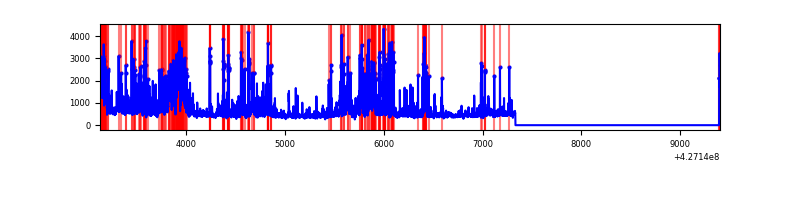 |
Top three noisy pixels from each quadrant. If the there are fewer than three noisy pixels in the level2.evt file, extra rows are filled as -1
| Pixel properties | Quadrant properties | ||||||
|---|---|---|---|---|---|---|---|
| Quadrant | DetID | PixID | Counts | Sigma | Mean | Median | Sigma |
| A | 10 | 83 | 402806 | 4392.84 | 449 | 440 | 91.6 |
| A | 15 | 222 | 153520 | 1671.26 | 449 | 440 | 91.6 |
| A | 12 | 189 | 113815 | 1237.78 | 449 | 440 | 91.6 |
| B | 4 | 171 | 227136 | 2623.86 | 454 | 442 | 86.4 |
| B | 15 | 33 | 43443 | 497.71 | 454 | 442 | 86.4 |
| B | 0 | 229 | 41067 | 470.21 | 454 | 442 | 86.4 |
| C | 15 | 214 | 169890 | 1610.79 | 453 | 455 | 105.2 |
| C | 12 | 249 | 4628 | 39.67 | 453 | 455 | 105.2 |
| C | 15 | 159 | 3532 | 29.25 | 453 | 455 | 105.2 |
| D | 1 | 52 | 426721 | 4021.3 | 434 | 422 | 106.0 |
| D | 13 | 249 | 296190 | 2789.99 | 434 | 422 | 106.0 |
| D | 12 | 6 | 213351 | 2008.57 | 434 | 422 | 106.0 |
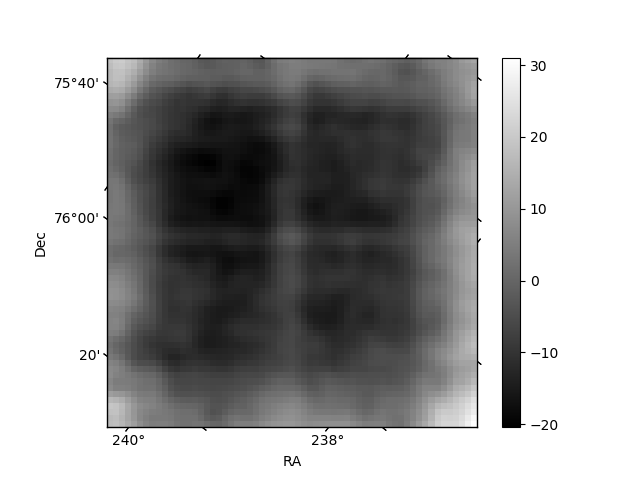
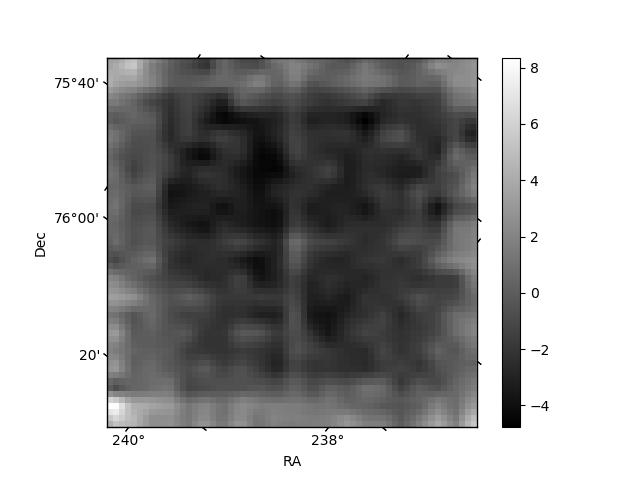
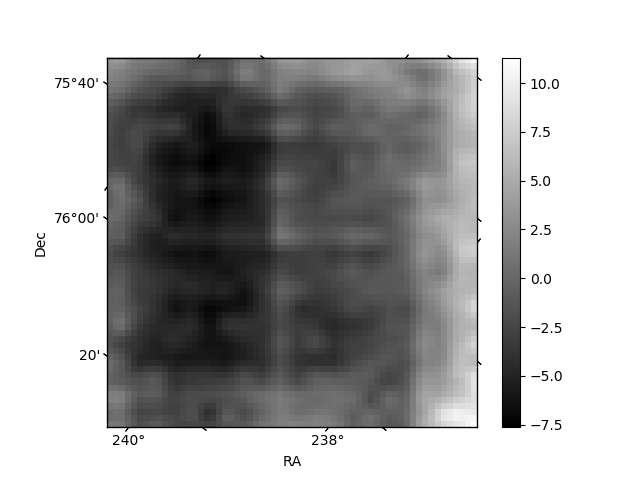
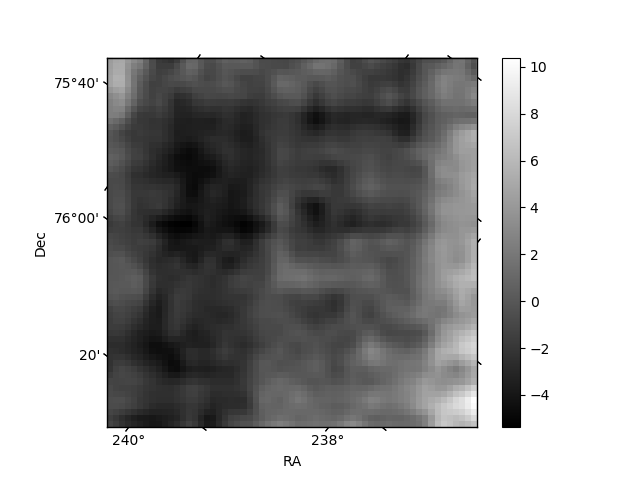
Histogram calculated using DETX and DETY for each event in the final _common_clean file
| Quadrant A | 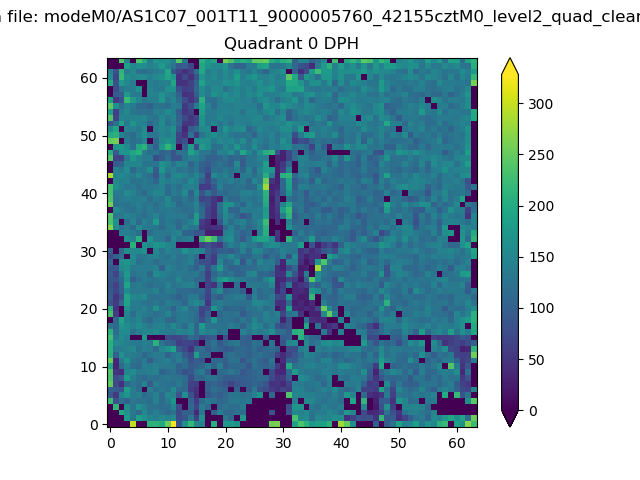 |
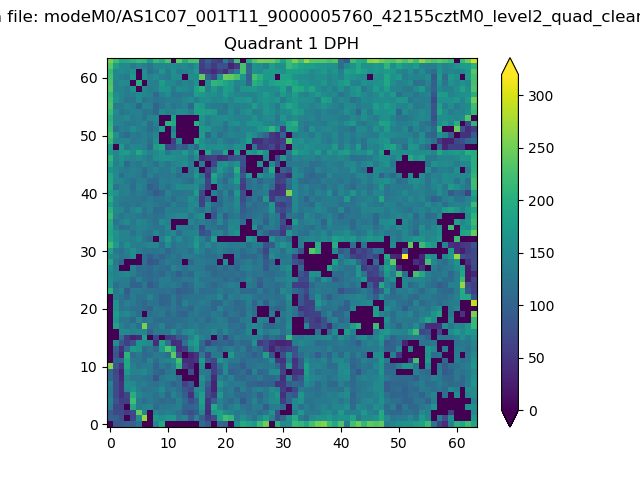 |
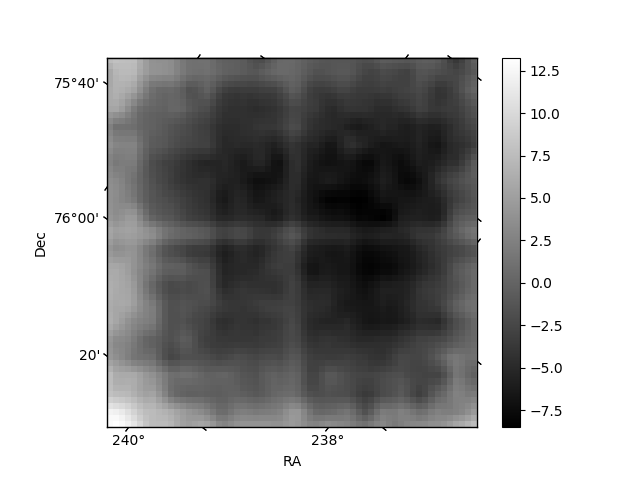
Quadrant B |
|---|---|---|---|
| Quadrant D | 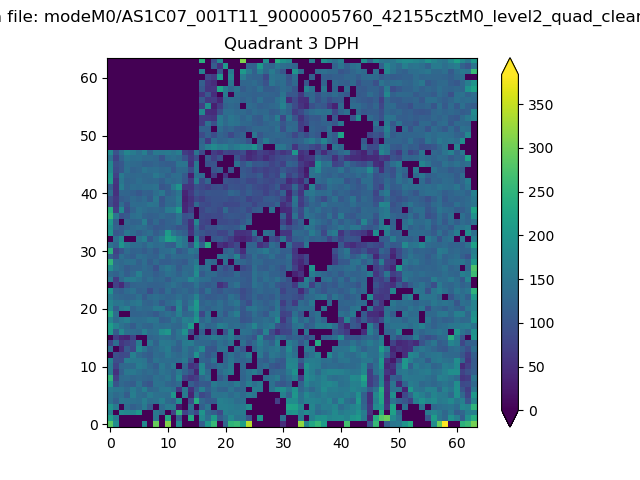 |
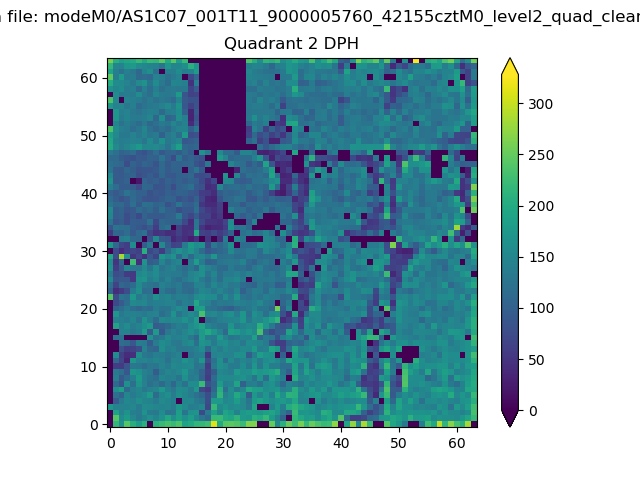 |
Quadrant C |
| Plot type | Count rate plots | Images |
|---|---|---|
| Comparison with Poisson distribution Blue bars denote a histogram of data divided into 1 sec bins. Red curve is a Poisson curve with rate = median count rate of data. |
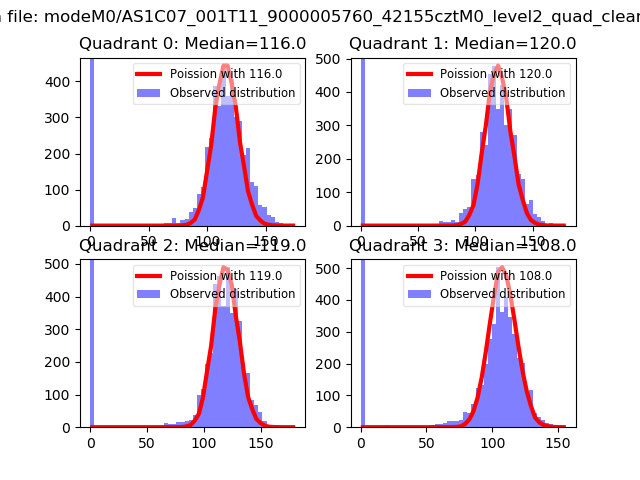 |
 |
| Quadrant-wise count rates Data is divided into 100 sec bins |
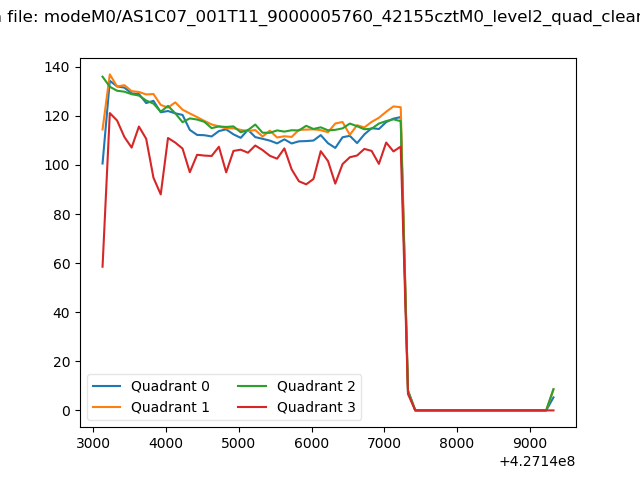 |
|
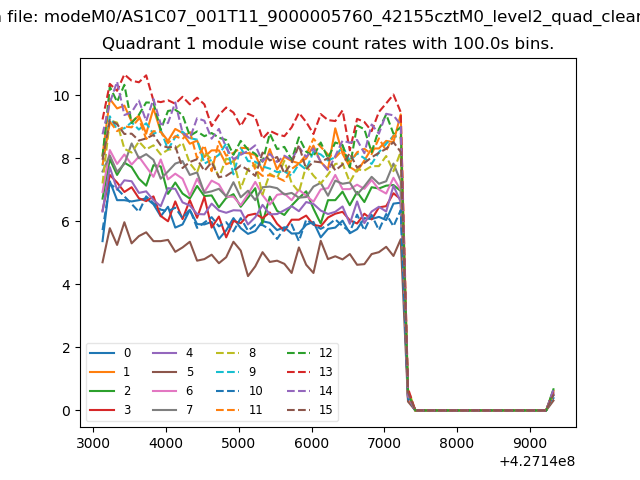
| Module-wise count rates for Quadrant A Data is divided into 100 sec bins |
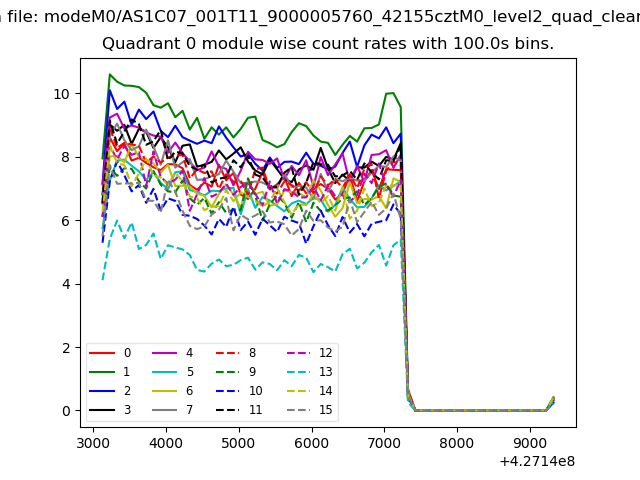 |
 |
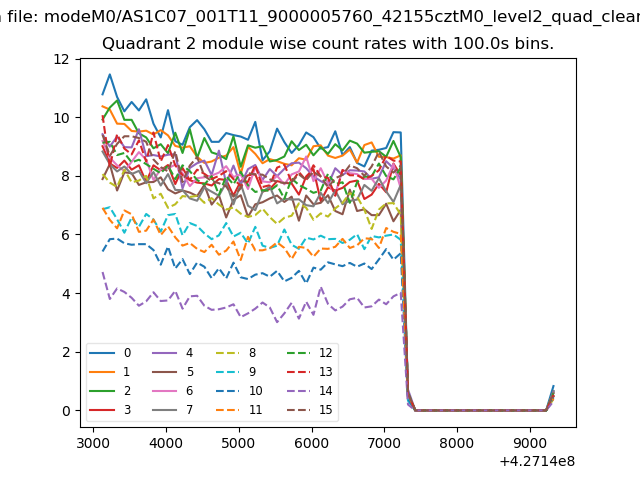
| Module-wise count rates for Quadrant B Data is divided into 100 sec bins |
 |
 |
| Module-wise count rates for Quadrant C Data is divided into 100 sec bins |
 |
 |
| Module-wise count rates for Quadrant D Data is divided into 100 sec bins |
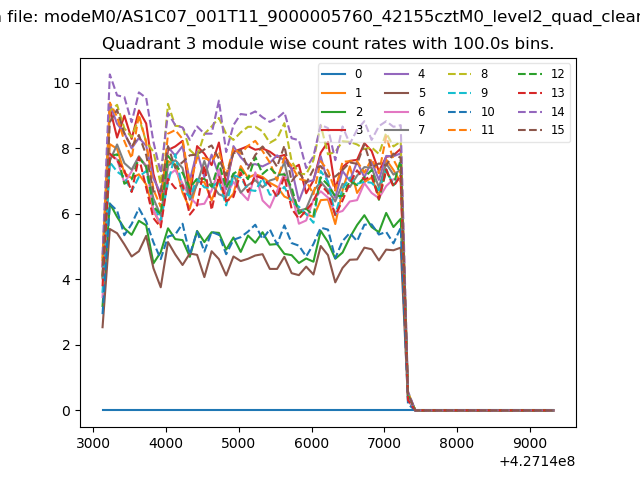 |
 |
| Parameter | Plot |
|---|---|
| CZT HV Monitor | 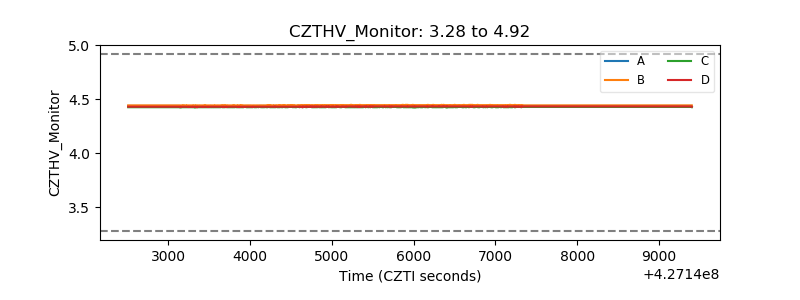 |
| D_VDD | 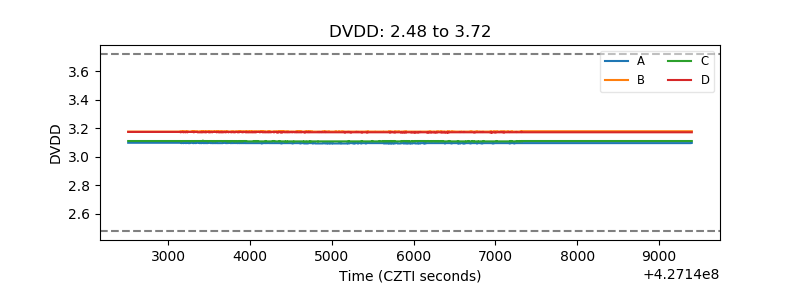 |
| Temperature 1 | 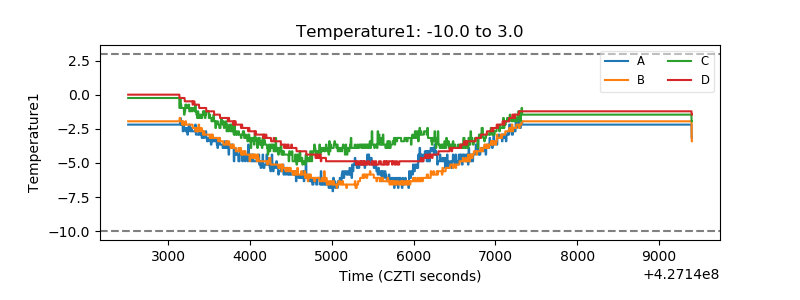 |
| Veto HV Monitor | 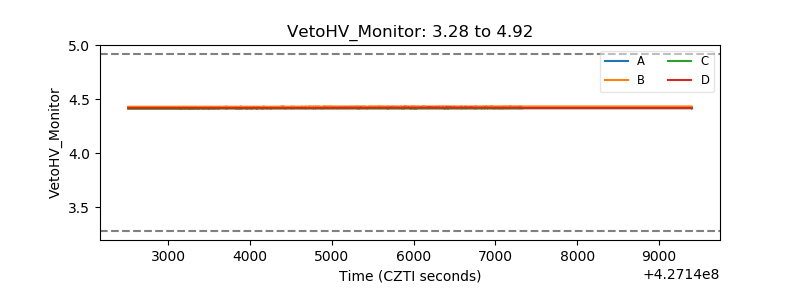 |
| Veto LLD | 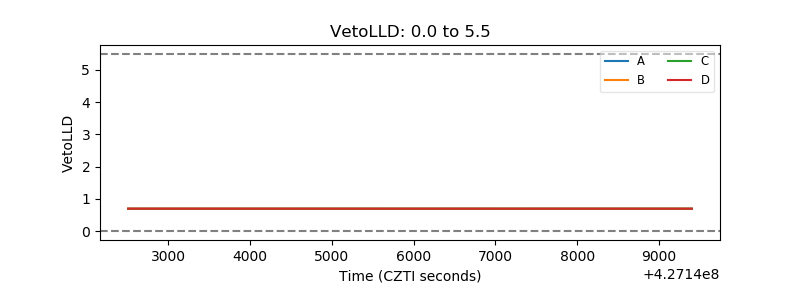 |
| Alpha Counter | 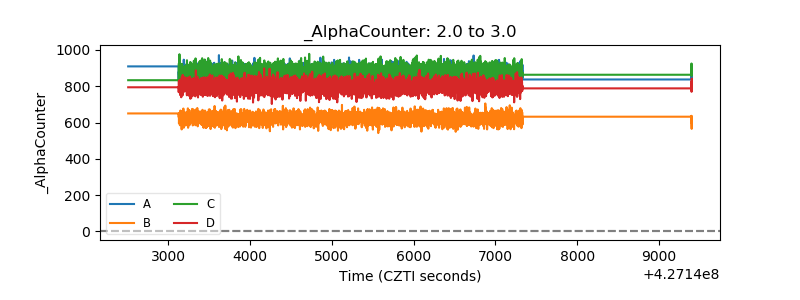 |
| _CPM_Rate | 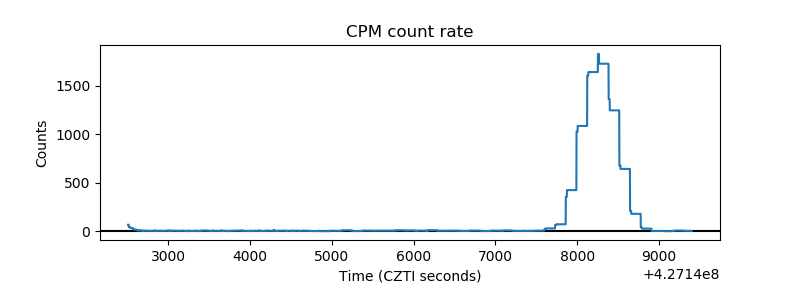 |
| CZT Counter | 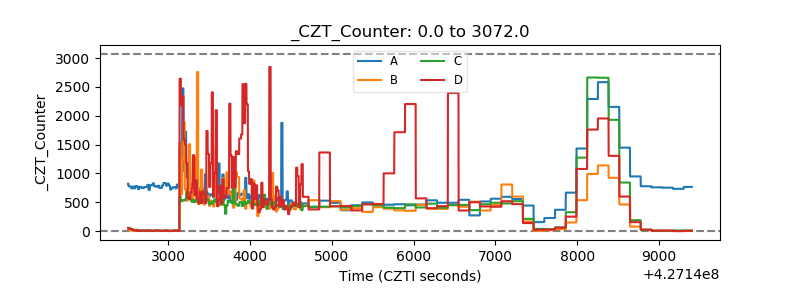 |
| +2.5 Volts monitor | 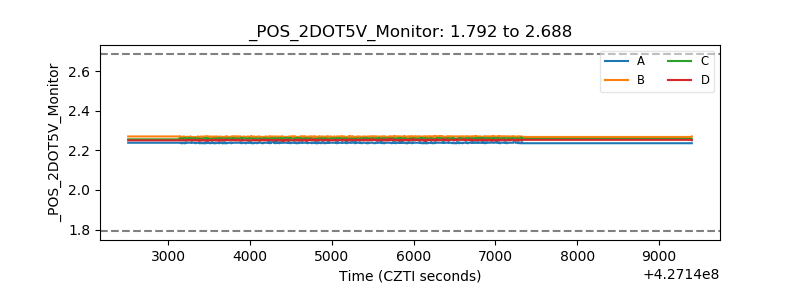 |
| +5 Volts monitor | 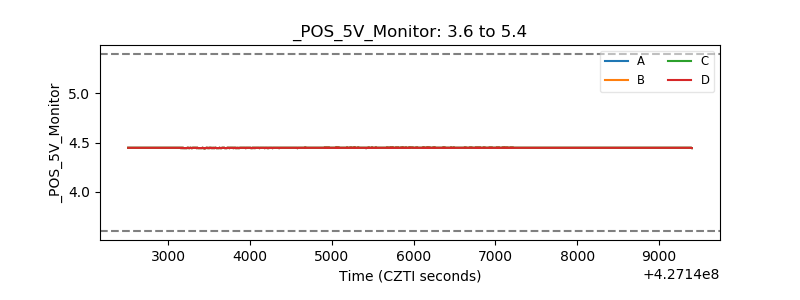 |
| _ROLL_ROT | 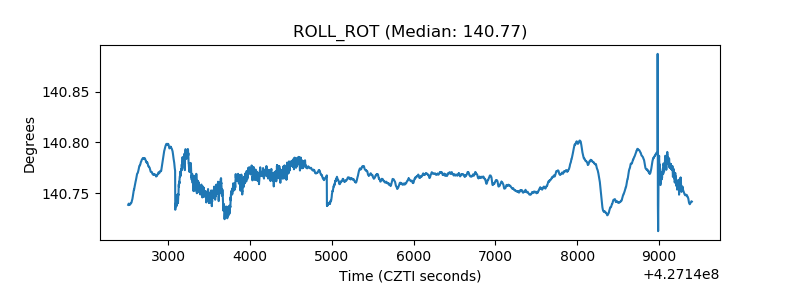 |
| _Roll_DEC | 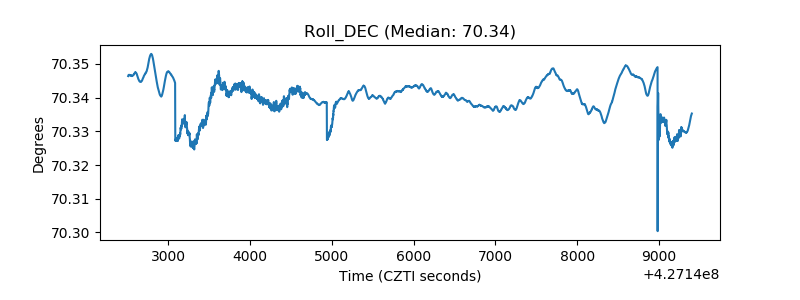 |
| _Roll_RA | 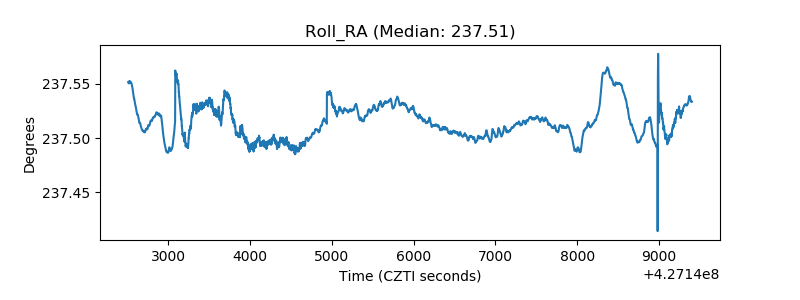 |
| Veto Counter | 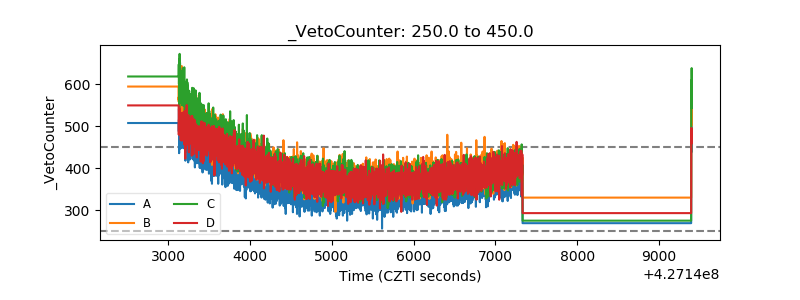 |