| Param | Original file | Final file |
|---|---|---|
| Filename | modeM0/AS1A12_088T23_9000005762_42157cztM0_level2.fits | modeM0/AS1A12_088T23_9000005762_42157cztM0_level2_quad_clean.evt |
| Size (bytes) | 315,273,600 | 82,627,200 |
| Size | 300.7 MB | 78.8 MB |
| Events in quadrant A | 3,006,590 | 553,230 |
| Events in quadrant B | 2,525,244 | 573,833 |
| Events in quadrant C | 2,267,868 | 546,421 |
| Events in quadrant D | 3,486,825 | 482,588 |
| Mode SS | |||
|---|---|---|---|
| Quadrant | BADHDUFLAG | Total packets | Discarded packets |
| A | 0 | 102 | 0 |
| B | 0 | 102 | 0 |
| C | 0 | 102 | 0 |
| D | 0 | 102 | 0 |
| Mode M9 | |||
|---|---|---|---|
| Quadrant | BADHDUFLAG | Total packets | Discarded packets |
| A | 0 | 35 | 0 |
| B | 0 | 36 | 0 |
| C | 0 | 36 | 0 |
| D | 0 | 36 | 0 |
| Mode M0 | |||
|---|---|---|---|
| Quadrant | BADHDUFLAG | Total packets | Discarded packets |
| A | 0 | 12029 | 2 |
| B | 0 | 10966 | 2 |
| C | 0 | 9932 | 2 |
| D | 0 | 13804 | 2 |
| Quadrant | Total seconds | Saturated seconds | Saturation percentage |
|---|---|---|---|
| A | 4926 | 47 | 0.954121% |
| B | 4926 | 29 | 0.588713% |
| C | 4926 | 4 | 0.081202% |
| D | 4926 | 224 | 4.547300% |
Noise dominated data is calculated using 1-second bins in cleaned event files. If a bin has >2000 counts, and if more than 50% of those come from <1% of pixels, then it is considered to be noise-dominated and hence unusable.
| Quadrant | # 1 sec bins | Bins with >0 counts | Bins with >2000 counts | High rate bins dominated by noise | Noise dominated (total time) | Noise dominated (detector-on time) | Marked lightcurve |
|---|---|---|---|---|---|---|---|
| A | 7049 | 4927 | 44 | 44 | 0.62% | 0.89% | 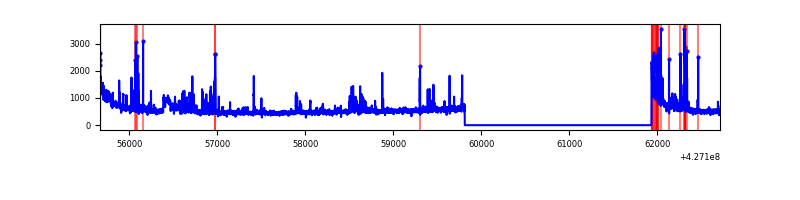 |
| B | 7049 | 4927 | 16 | 16 | 0.23% | 0.32% | 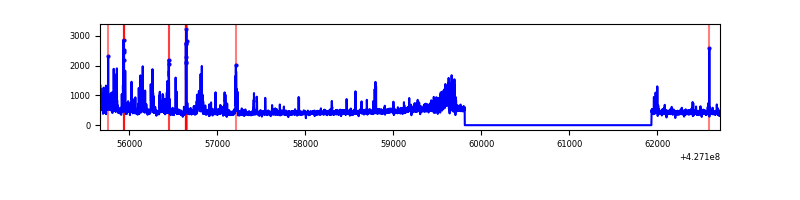 |
| C | 7049 | 4927 | 0 | 0 | 0.00% | 0.00% | 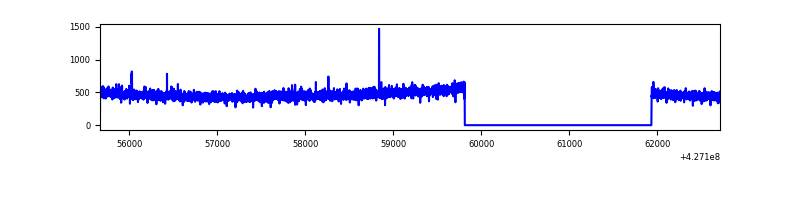 |
| D | 7049 | 4927 | 199 | 199 | 2.82% | 4.04% | 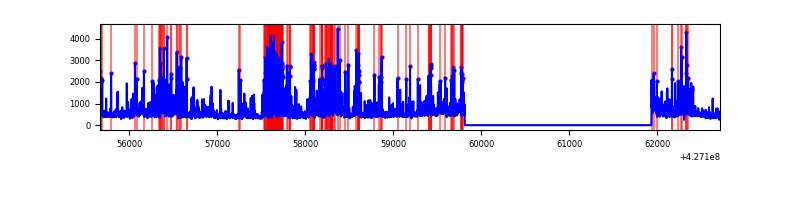 |
Top three noisy pixels from each quadrant. If the there are fewer than three noisy pixels in the level2.evt file, extra rows are filled as -1
| Pixel properties | Quadrant properties | ||||||
|---|---|---|---|---|---|---|---|
| Quadrant | DetID | PixID | Counts | Sigma | Mean | Median | Sigma |
| A | 10 | 83 | 523147 | 4735.33 | 534 | 524 | 110.4 |
| A | 15 | 222 | 221244 | 1999.88 | 534 | 524 | 110.4 |
| A | 15 | 223 | 134584 | 1214.68 | 534 | 524 | 110.4 |
| B | 15 | 33 | 113709 | 1073.46 | 538 | 523 | 105.4 |
| B | 5 | 255 | 85189 | 802.97 | 538 | 523 | 105.4 |
| B | 4 | 171 | 69875 | 657.73 | 538 | 523 | 105.4 |
| C | 15 | 214 | 204626 | 1651.82 | 527 | 532 | 123.6 |
| C | 12 | 249 | 6953 | 51.97 | 527 | 532 | 123.6 |
| C | 13 | 61 | 3496 | 23.99 | 527 | 532 | 123.6 |
| D | 12 | 6 | 567987 | 4516.82 | 510 | 495 | 125.6 |
| D | 1 | 52 | 370954 | 2948.58 | 510 | 495 | 125.6 |
| D | 6 | 252 | 222657 | 1768.25 | 510 | 495 | 125.6 |
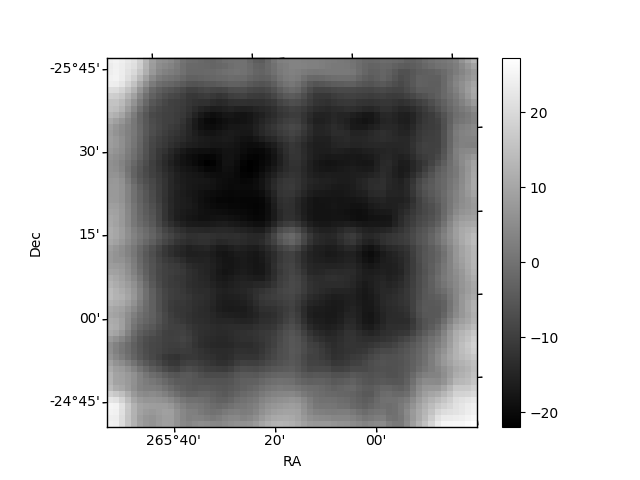
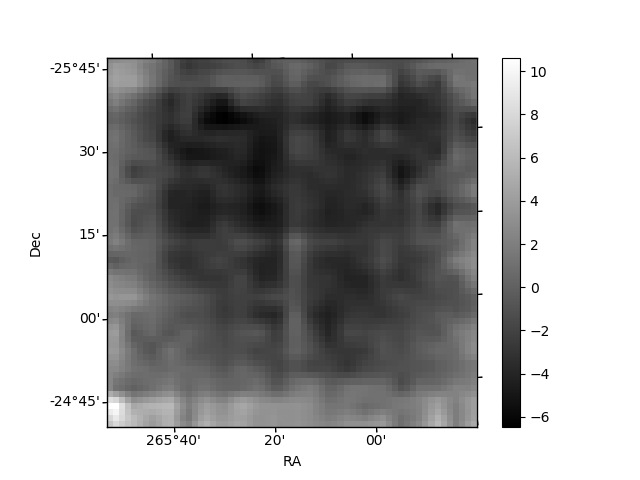
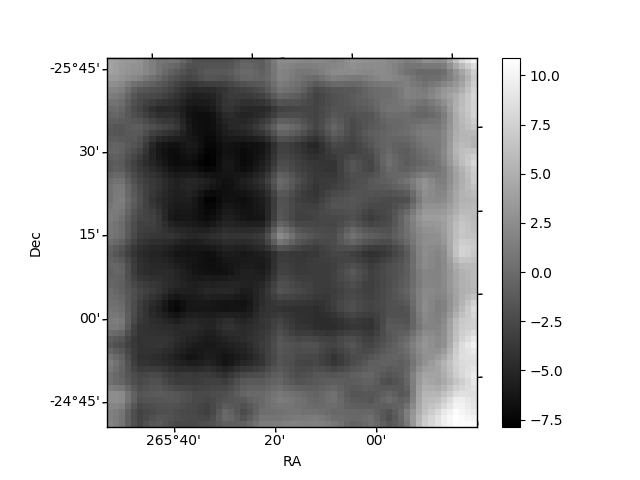
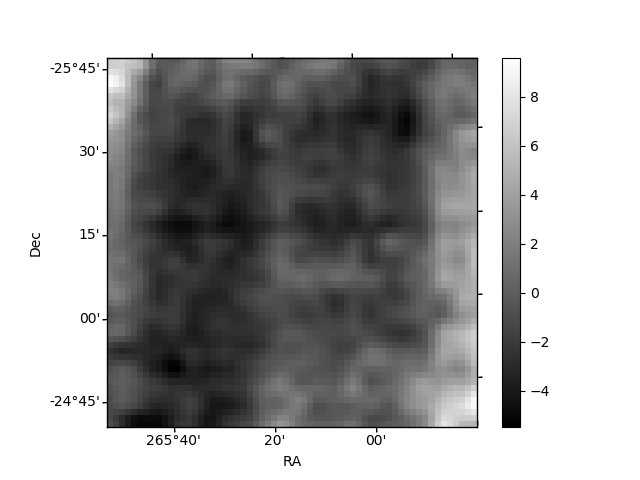
Histogram calculated using DETX and DETY for each event in the final _common_clean file
| Quadrant A | 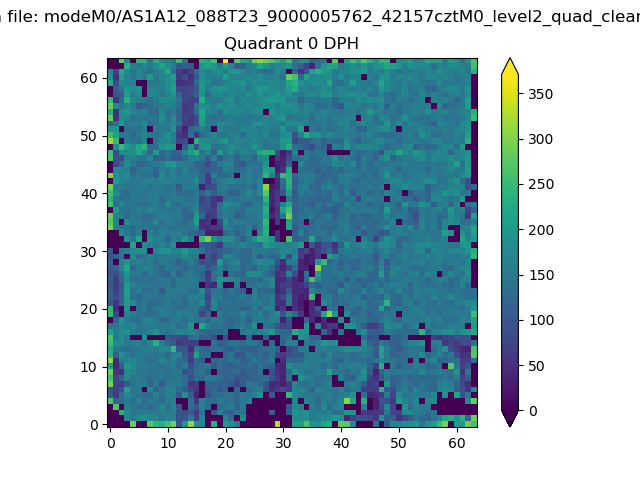 |
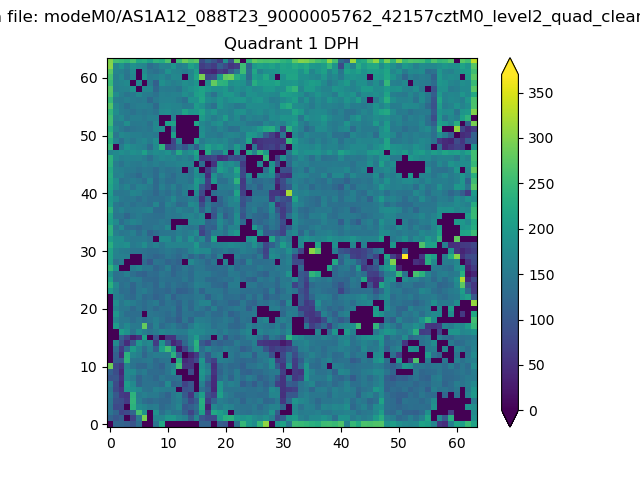 |
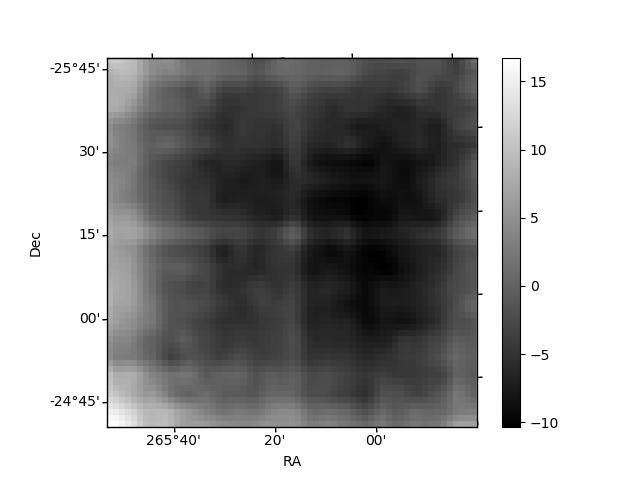
Quadrant B |
|---|---|---|---|
| Quadrant D | 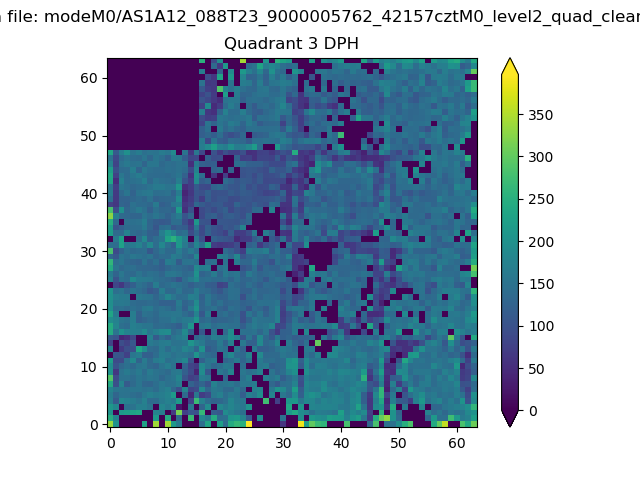 |
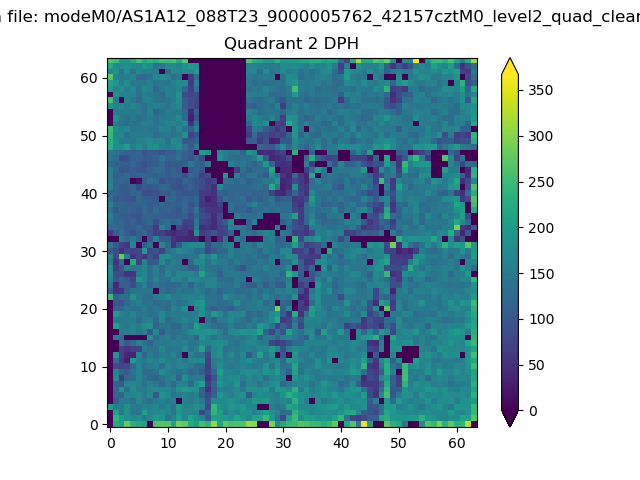 |
Quadrant C |
| Plot type | Count rate plots | Images |
|---|---|---|
| Comparison with Poisson distribution Blue bars denote a histogram of data divided into 1 sec bins. Red curve is a Poisson curve with rate = median count rate of data. |
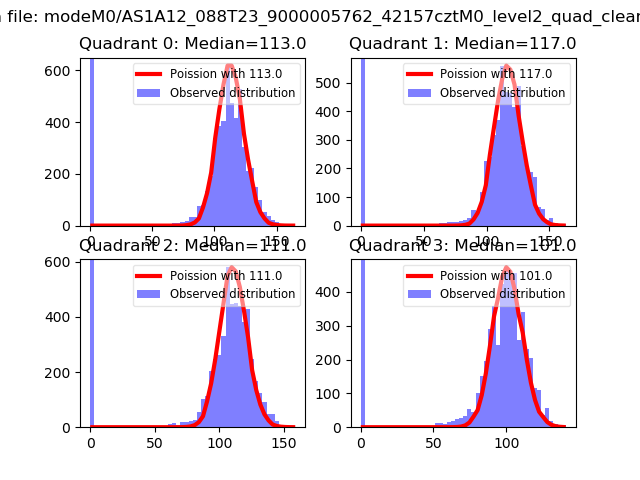 |
 |
| Quadrant-wise count rates Data is divided into 100 sec bins |
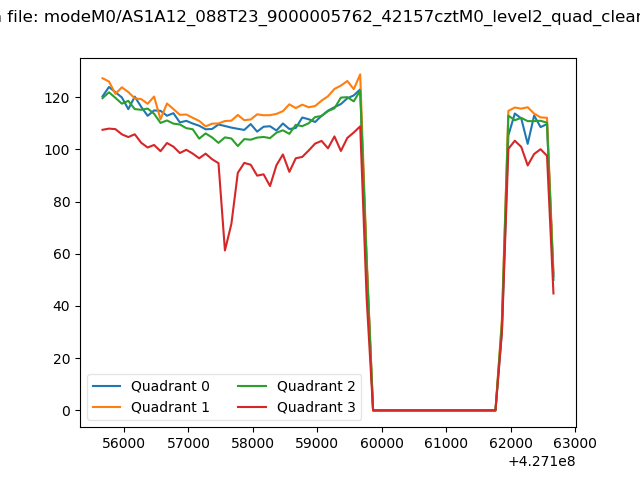 |
|
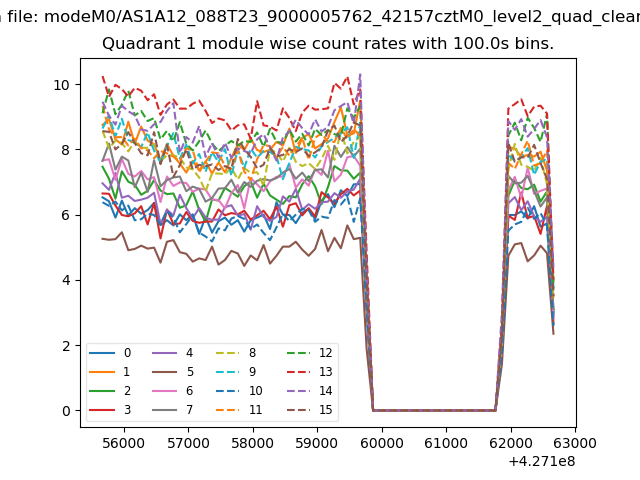
| Module-wise count rates for Quadrant A Data is divided into 100 sec bins |
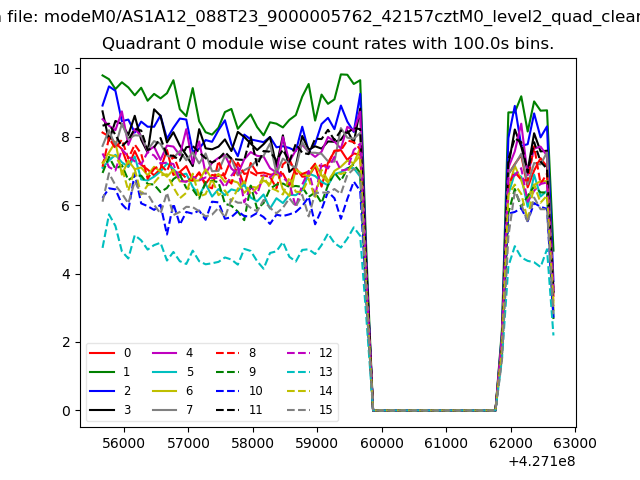 |
 |
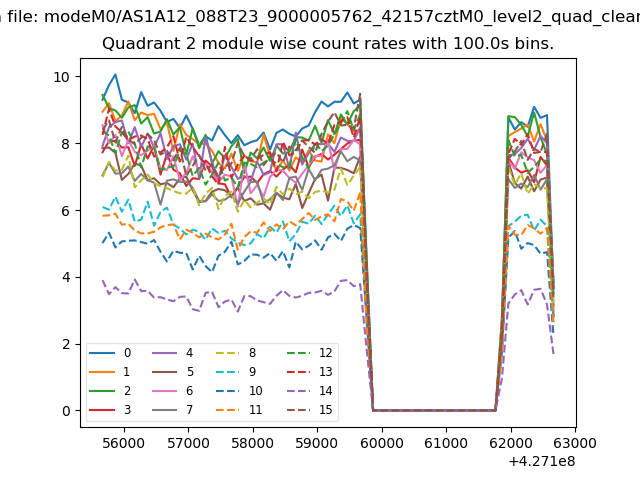
| Module-wise count rates for Quadrant B Data is divided into 100 sec bins |
 |
 |
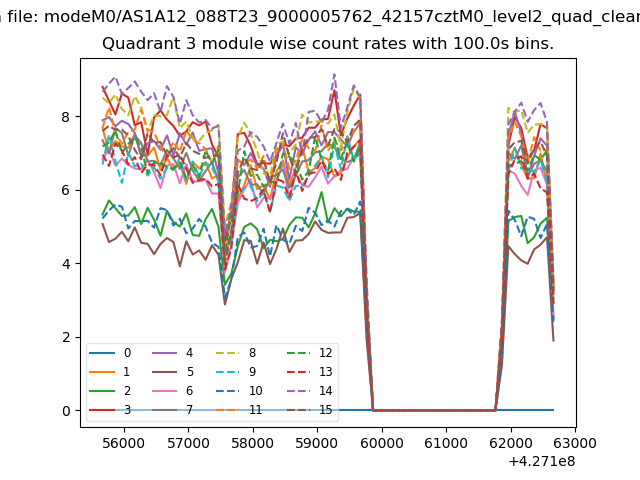
| Module-wise count rates for Quadrant C Data is divided into 100 sec bins |
 |
 |
| Module-wise count rates for Quadrant D Data is divided into 100 sec bins |
 |
 |
| Parameter | Plot |
|---|---|
| CZT HV Monitor | 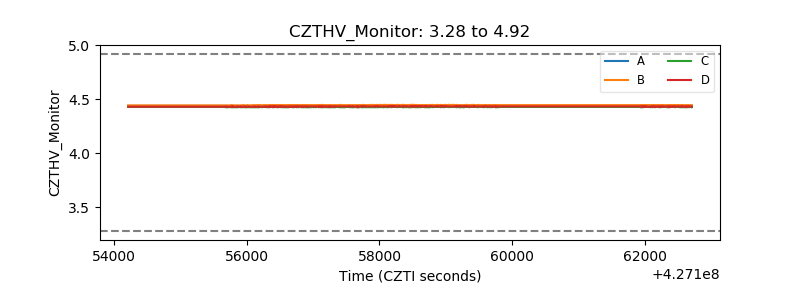 |
| D_VDD | 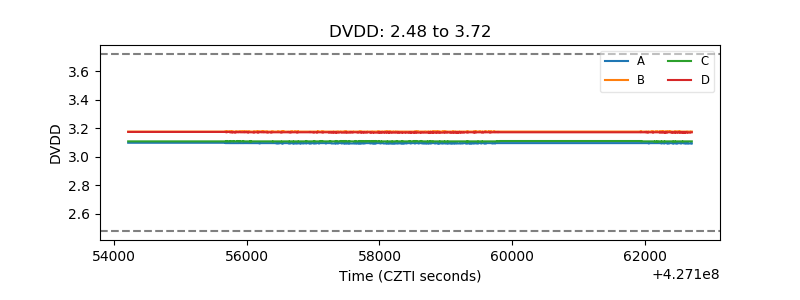 |
| Temperature 1 | 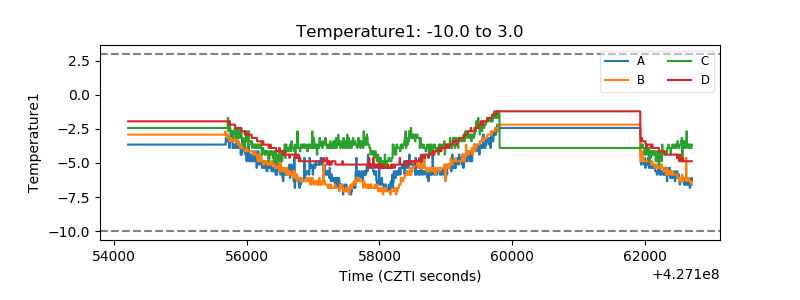 |
| Veto HV Monitor | 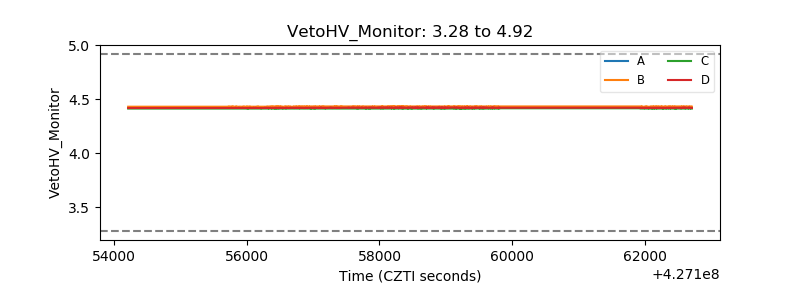 |
| Veto LLD | 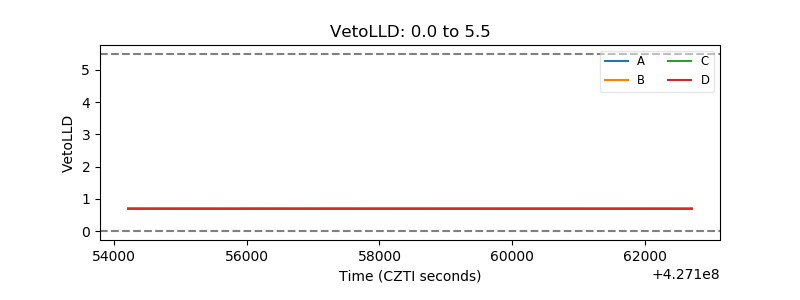 |
| Alpha Counter | 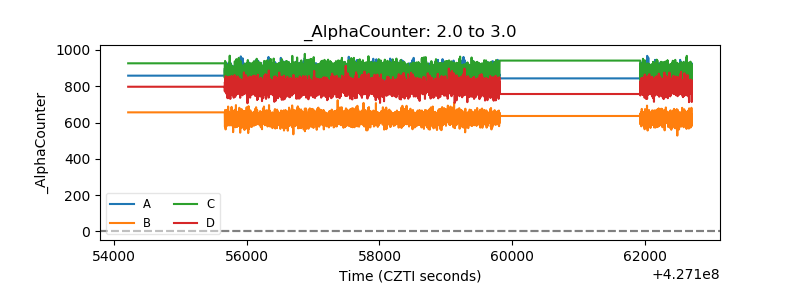 |
| _CPM_Rate | 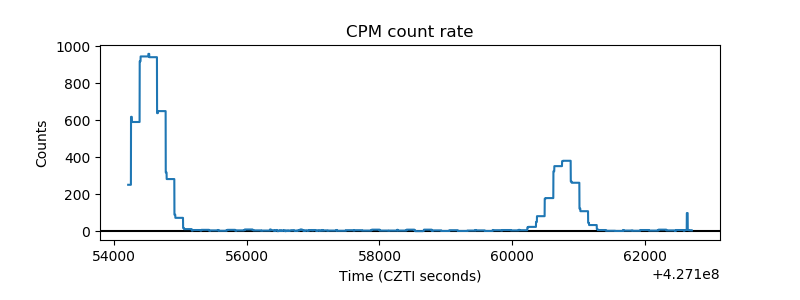 |
| CZT Counter | 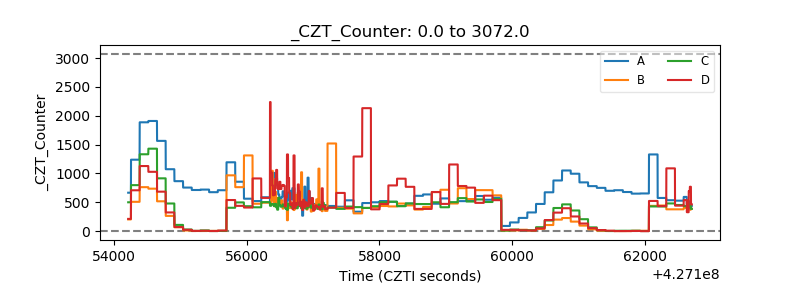 |
| +2.5 Volts monitor | 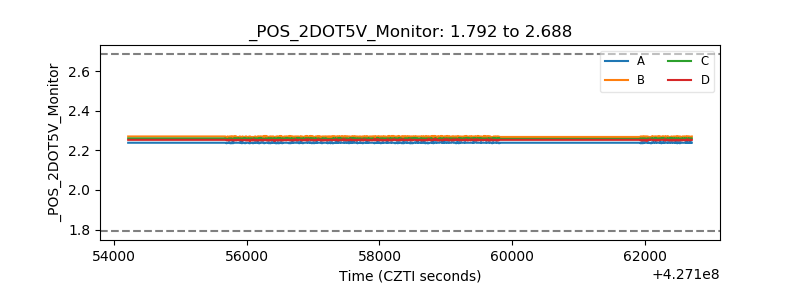 |
| +5 Volts monitor | 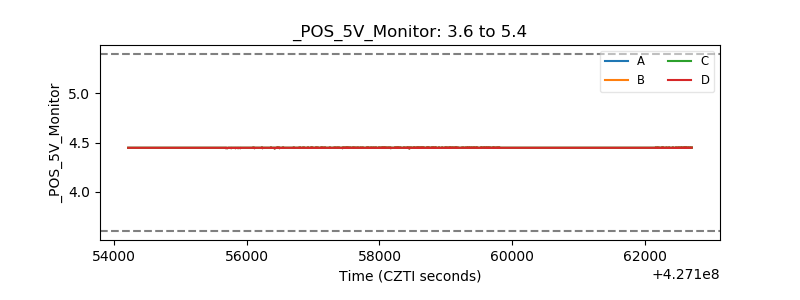 |
| _ROLL_ROT | 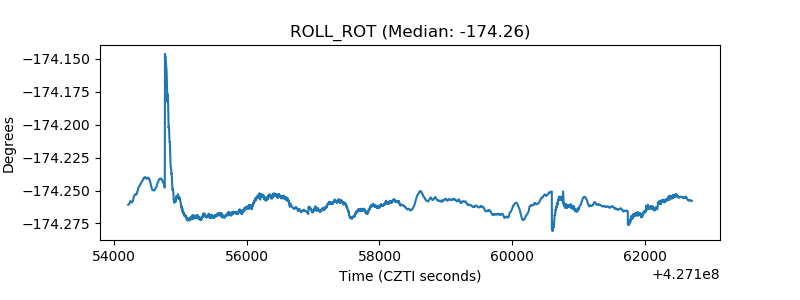 |
| _Roll_DEC | 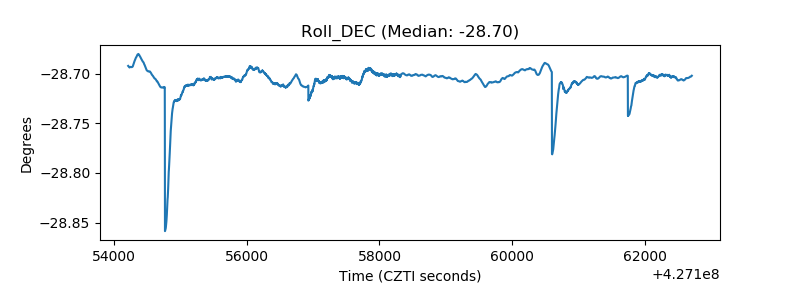 |
| _Roll_RA | 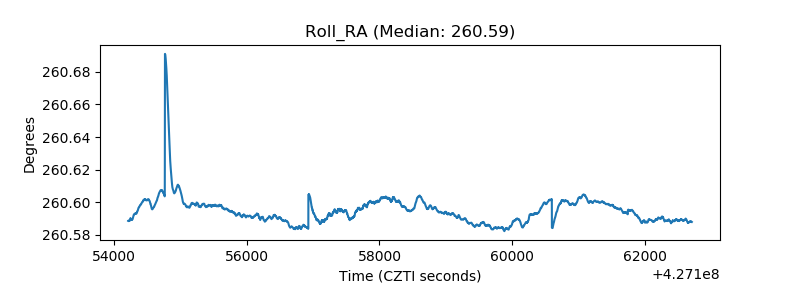 |
| Veto Counter | 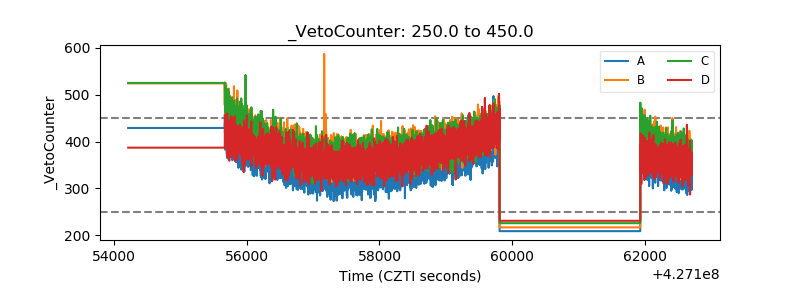 |