| Param | Original file | Final file |
|---|---|---|
| Filename | modeM0/AS1A12_088T23_9000005762_42158cztM0_level2.fits | modeM0/AS1A12_088T23_9000005762_42158cztM0_level2_quad_clean.evt |
| Size (bytes) | 307,100,160 | 73,537,920 |
| Size | 292.9 MB | 70.1 MB |
| Events in quadrant A | 2,911,403 | 485,933 |
| Events in quadrant B | 2,176,020 | 516,290 |
| Events in quadrant C | 2,086,300 | 488,072 |
| Events in quadrant D | 3,841,094 | 418,494 |
| Mode SS | |||
|---|---|---|---|
| Quadrant | BADHDUFLAG | Total packets | Discarded packets |
| A | 0 | 94 | 0 |
| B | 0 | 94 | 0 |
| C | 0 | 94 | 0 |
| D | 0 | 94 | 0 |
| Mode M9 | |||
|---|---|---|---|
| Quadrant | BADHDUFLAG | Total packets | Discarded packets |
| A | 0 | 41 | 0 |
| B | 0 | 41 | 0 |
| C | 0 | 41 | 0 |
| D | 0 | 41 | 0 |
| Mode M0 | |||
|---|---|---|---|
| Quadrant | BADHDUFLAG | Total packets | Discarded packets |
| A | 0 | 11474 | 2 |
| B | 0 | 9665 | 2 |
| C | 0 | 9114 | 2 |
| D | 0 | 14581 | 2 |
| Quadrant | Total seconds | Saturated seconds | Saturation percentage |
|---|---|---|---|
| A | 4524 | 152 | 3.359859% |
| B | 4524 | 13 | 0.287356% |
| C | 4524 | 2 | 0.044209% |
| D | 4524 | 404 | 8.930150% |
Noise dominated data is calculated using 1-second bins in cleaned event files. If a bin has >2000 counts, and if more than 50% of those come from <1% of pixels, then it is considered to be noise-dominated and hence unusable.
| Quadrant | # 1 sec bins | Bins with >0 counts | Bins with >2000 counts | High rate bins dominated by noise | Noise dominated (total time) | Noise dominated (detector-on time) | Marked lightcurve |
|---|---|---|---|---|---|---|---|
| A | 8650 | 4526 | 140 | 140 | 1.62% | 3.09% | 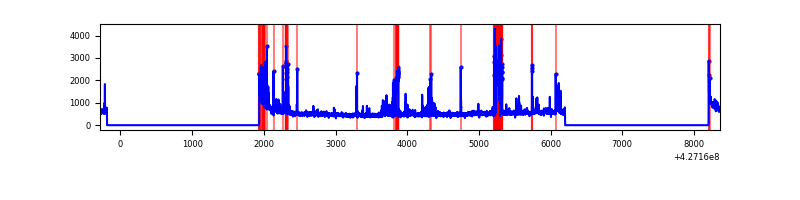 |
| B | 8650 | 4526 | 6 | 6 | 0.07% | 0.13% | 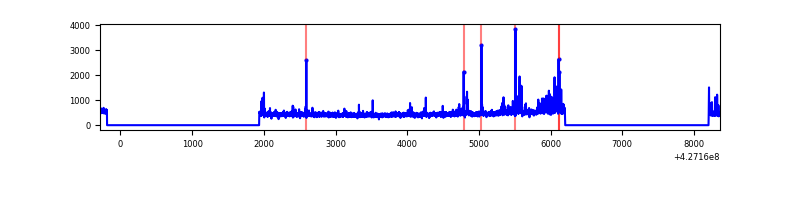 |
| C | 8650 | 4526 | 0 | 0 | 0.00% | 0.00% | 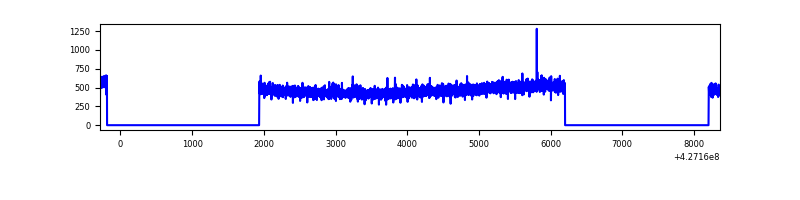 |
| D | 8650 | 4526 | 371 | 371 | 4.29% | 8.20% | 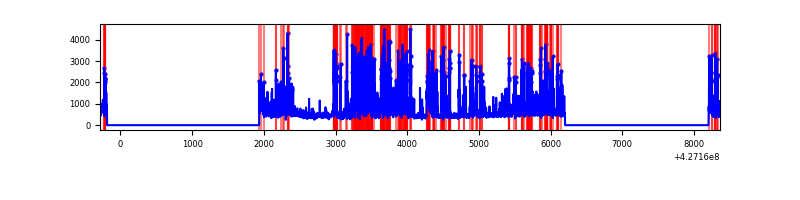 |
Top three noisy pixels from each quadrant. If the there are fewer than three noisy pixels in the level2.evt file, extra rows are filled as -1
| Pixel properties | Quadrant properties | ||||||
|---|---|---|---|---|---|---|---|
| Quadrant | DetID | PixID | Counts | Sigma | Mean | Median | Sigma |
| A | 10 | 83 | 440362 | 4329.78 | 487 | 477 | 101.6 |
| A | 15 | 223 | 190637 | 1871.74 | 487 | 477 | 101.6 |
| A | 13 | 248 | 190462 | 1870.02 | 487 | 477 | 101.6 |
| B | 5 | 255 | 94968 | 980.13 | 494 | 482 | 96.4 |
| B | 15 | 33 | 81564 | 841.09 | 494 | 482 | 96.4 |
| B | 0 | 229 | 26172 | 266.49 | 494 | 482 | 96.4 |
| C | 15 | 214 | 185588 | 1615.94 | 486 | 489 | 114.5 |
| C | 12 | 249 | 3429 | 25.67 | 486 | 489 | 114.5 |
| C | 13 | 61 | 3228 | 23.91 | 486 | 489 | 114.5 |
| D | 12 | 6 | 981762 | 8585.26 | 463 | 450 | 114.3 |
| D | 6 | 252 | 422437 | 3691.86 | 463 | 450 | 114.3 |
| D | 1 | 52 | 324668 | 2836.5 | 463 | 450 | 114.3 |
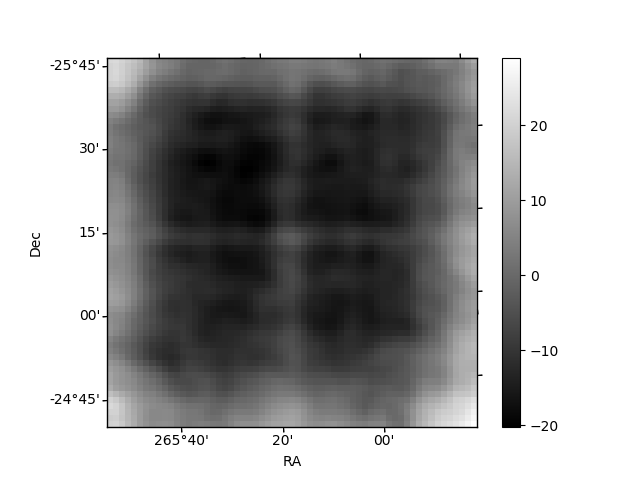
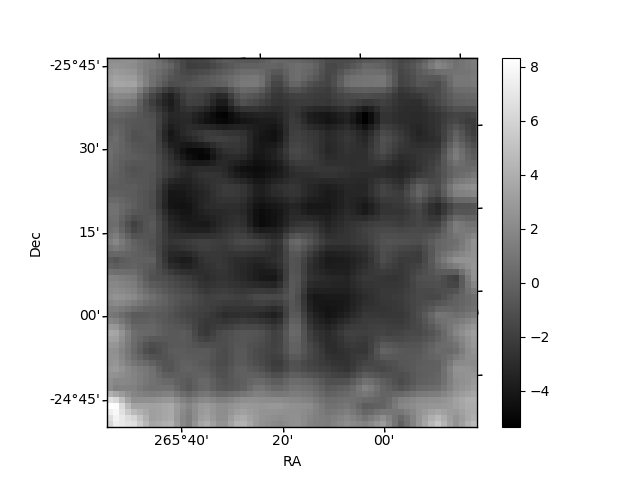
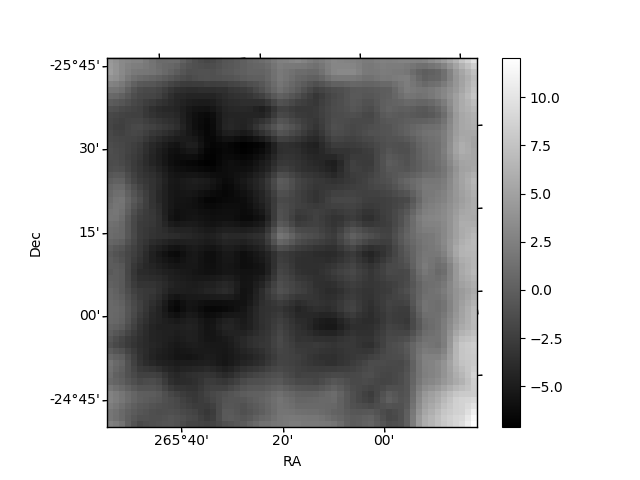
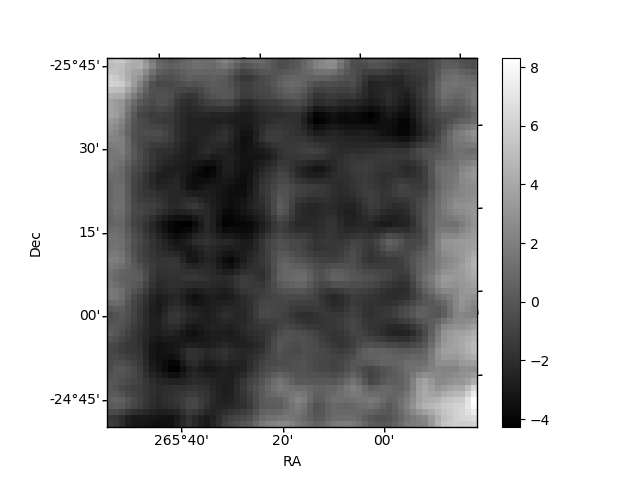
Histogram calculated using DETX and DETY for each event in the final _common_clean file
| Quadrant A | 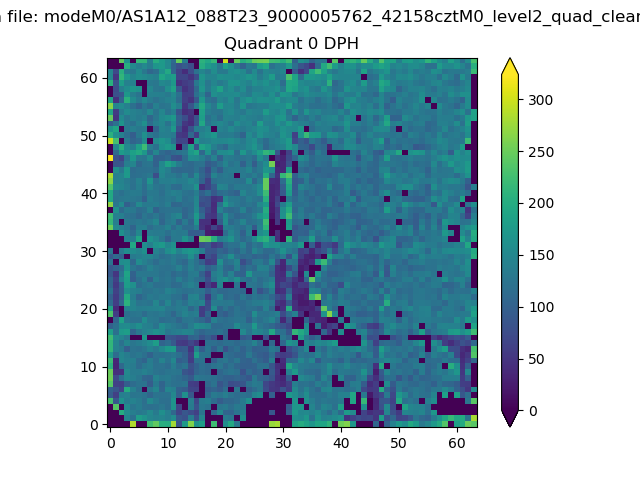 |
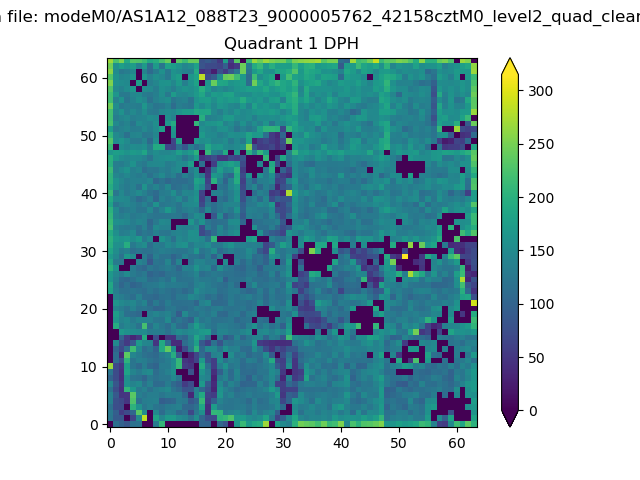 |
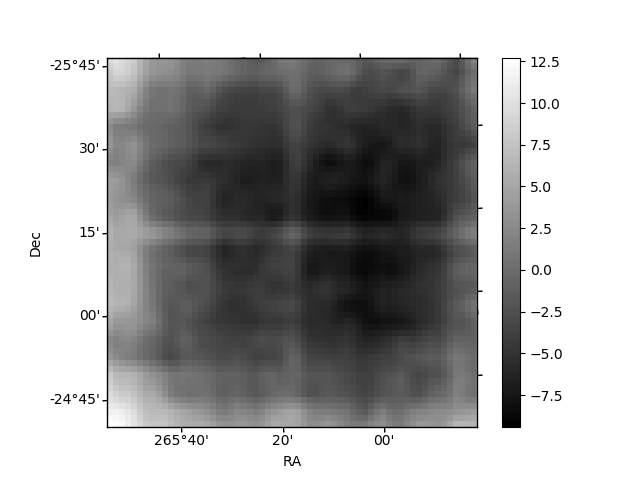
Quadrant B |
|---|---|---|---|
| Quadrant D | 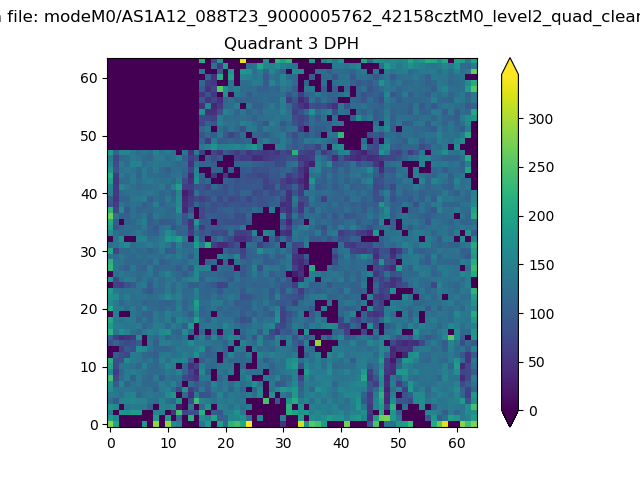 |
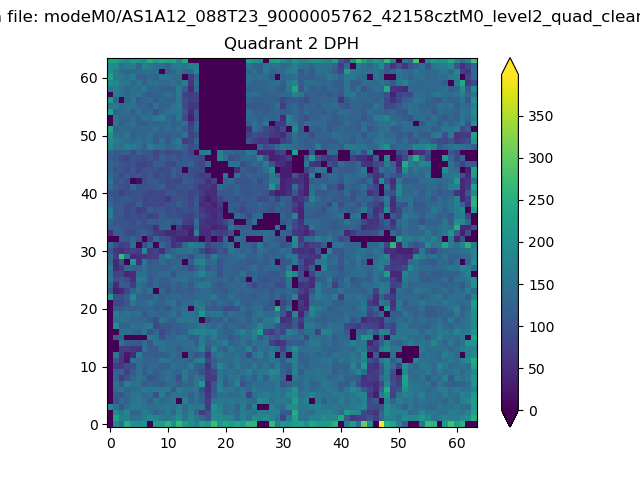 |
Quadrant C |
| Plot type | Count rate plots | Images |
|---|---|---|
| Comparison with Poisson distribution Blue bars denote a histogram of data divided into 1 sec bins. Red curve is a Poisson curve with rate = median count rate of data. |
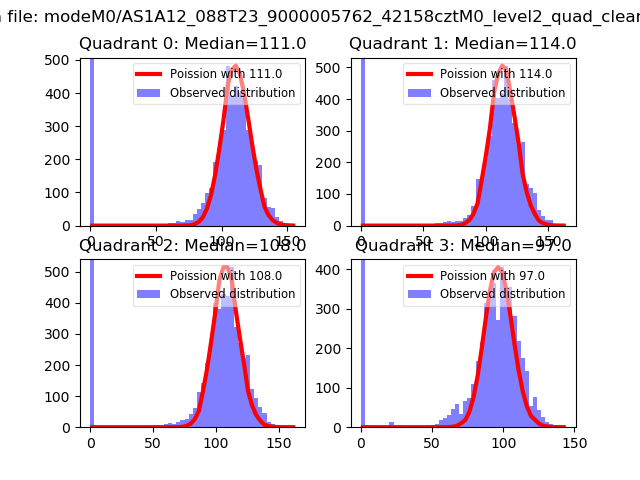 |
 |
| Quadrant-wise count rates Data is divided into 100 sec bins |
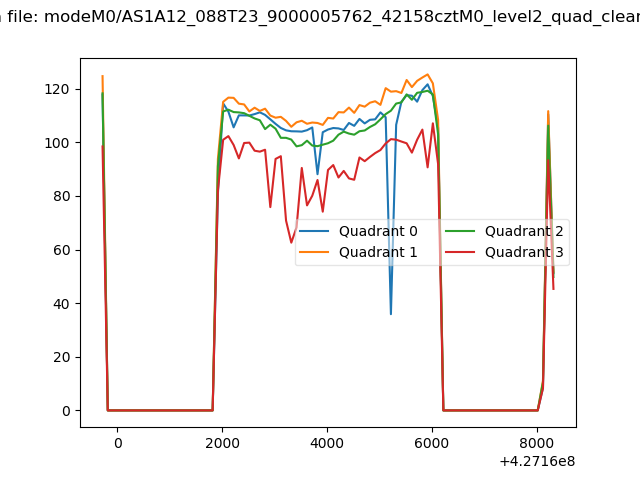 |
|
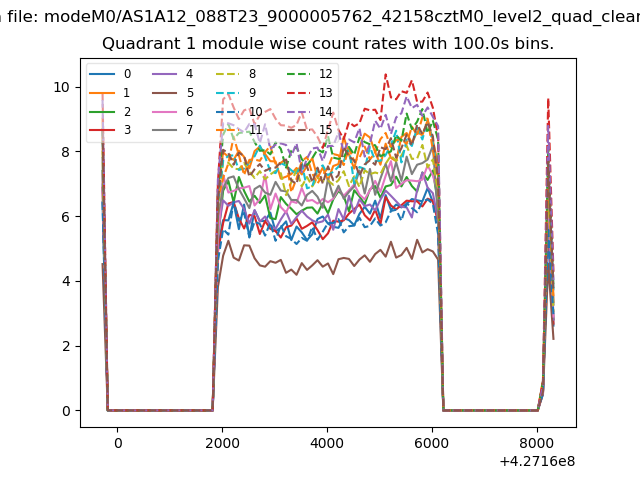
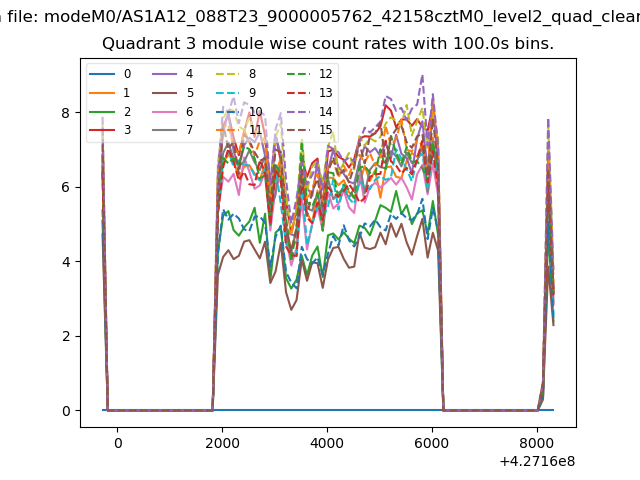
| Module-wise count rates for Quadrant A Data is divided into 100 sec bins |
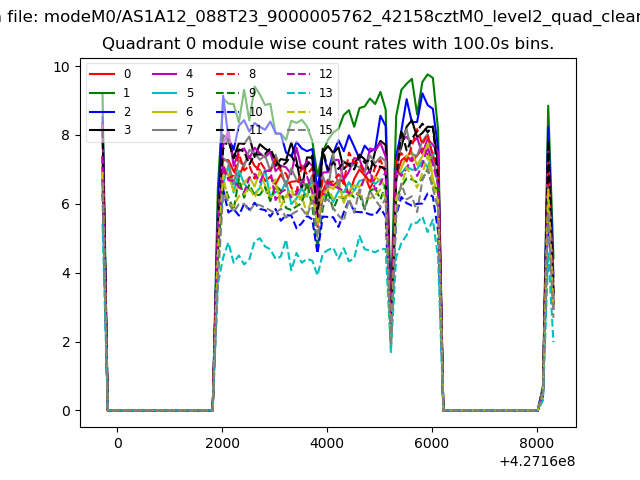 |
 |
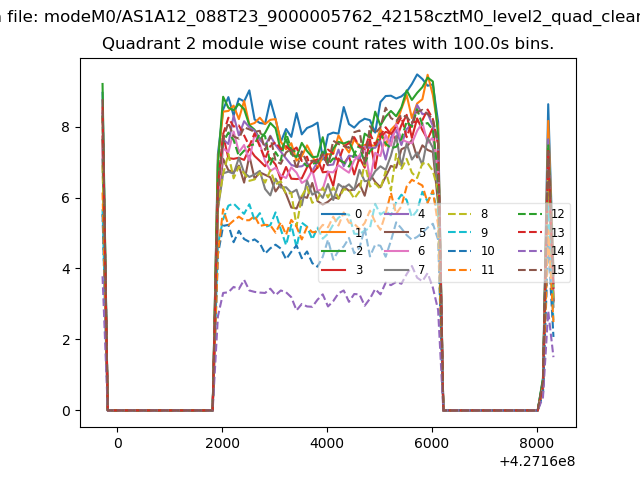
| Module-wise count rates for Quadrant B Data is divided into 100 sec bins |
 |
 |
| Module-wise count rates for Quadrant C Data is divided into 100 sec bins |
 |
 |
| Module-wise count rates for Quadrant D Data is divided into 100 sec bins |
 |
 |
| Parameter | Plot |
|---|---|
| CZT HV Monitor | 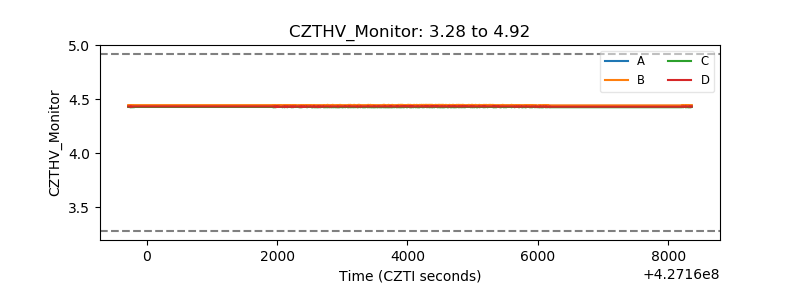 |
| D_VDD | 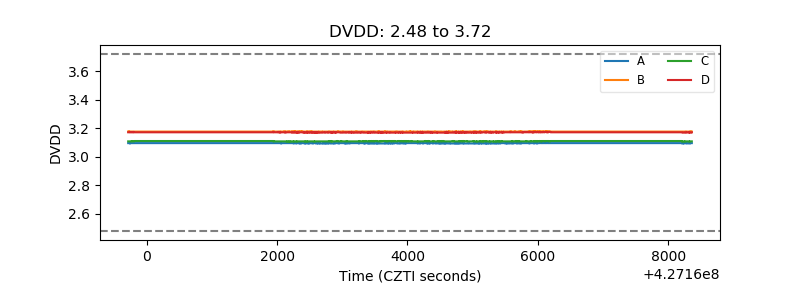 |
| Temperature 1 | 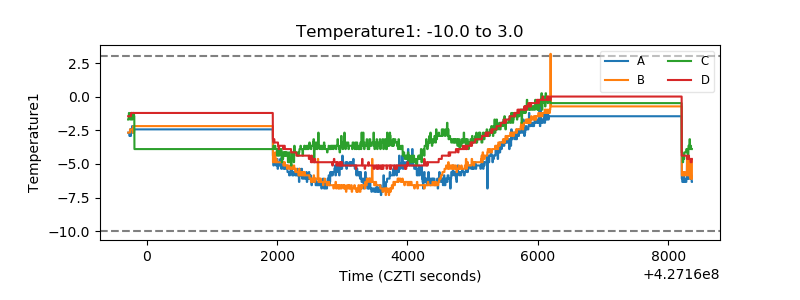 |
| Veto HV Monitor | 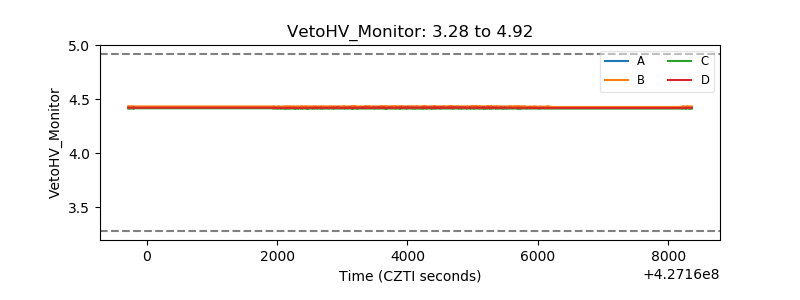 |
| Veto LLD | 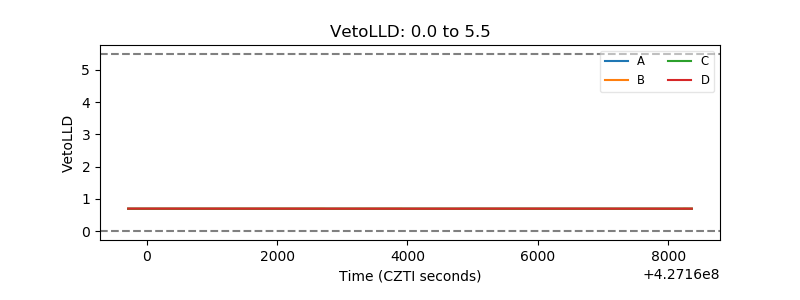 |
| Alpha Counter | 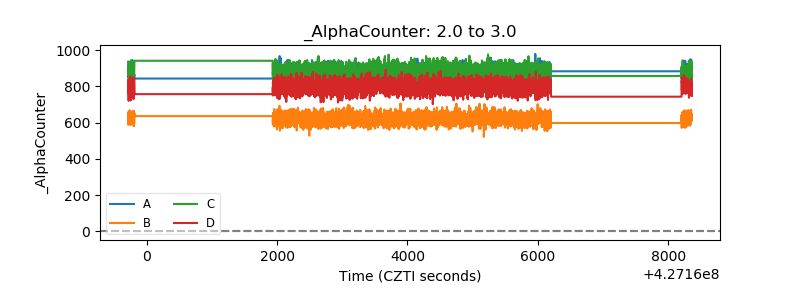 |
| _CPM_Rate | 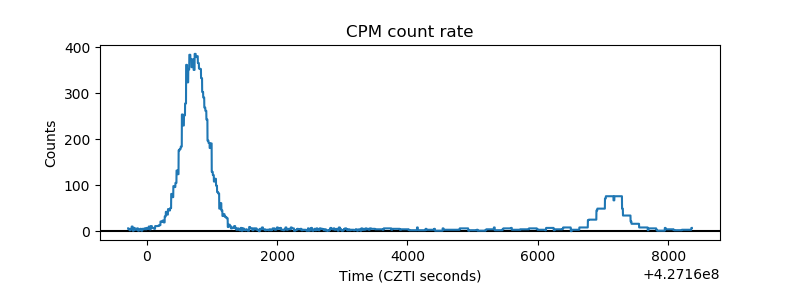 |
| CZT Counter | 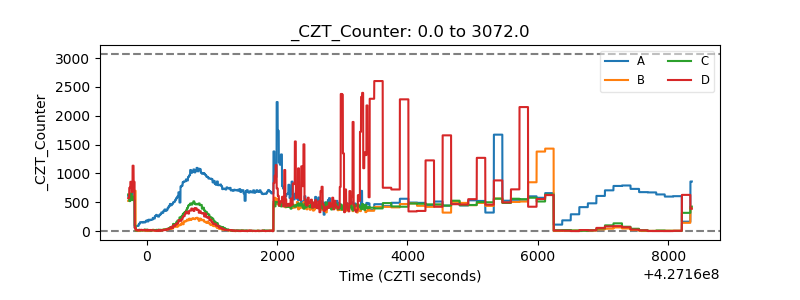 |
| +2.5 Volts monitor | 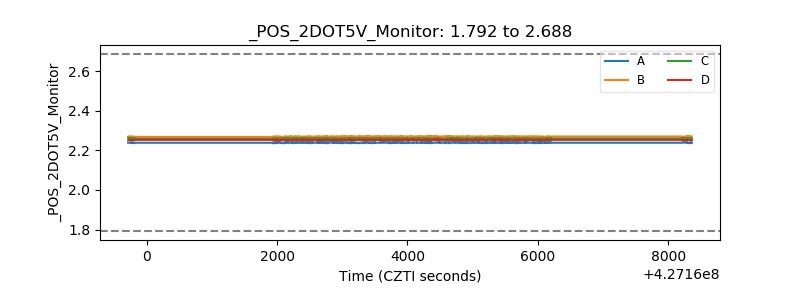 |
| +5 Volts monitor | 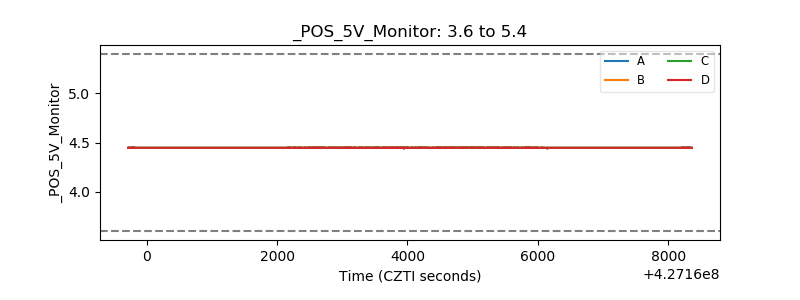 |
| _ROLL_ROT | 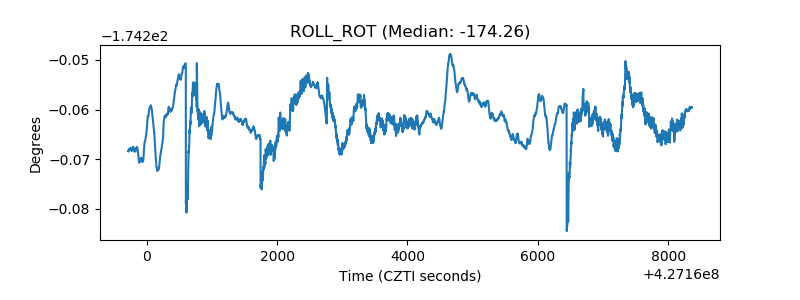 |
| _Roll_DEC | 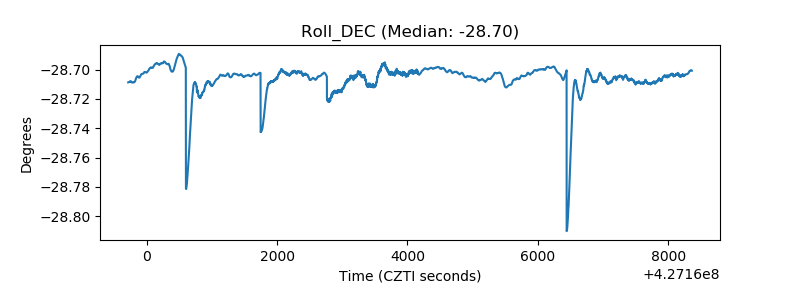 |
| _Roll_RA | 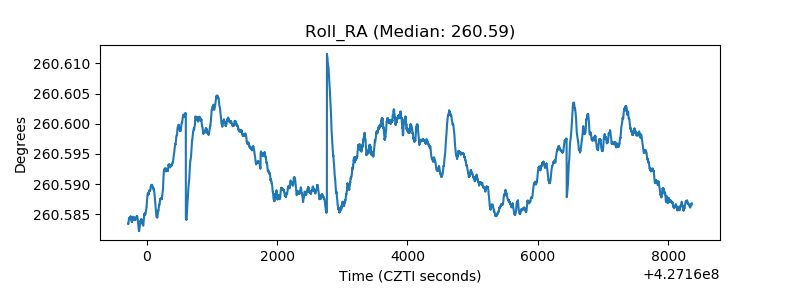 |
| Veto Counter | 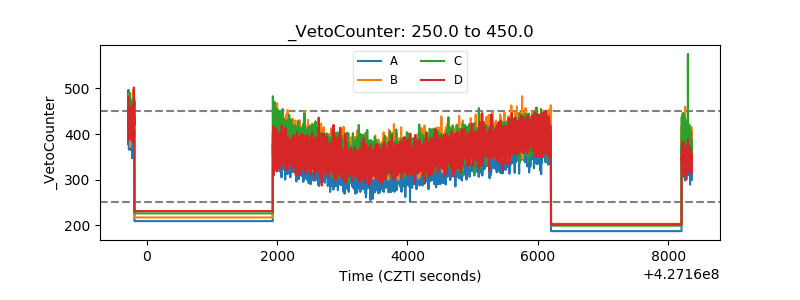 |