| Param | Original file | Final file |
|---|---|---|
| Filename | modeM0/AS1A12_088T23_9000005762_42159cztM0_level2.fits | modeM0/AS1A12_088T23_9000005762_42159cztM0_level2_quad_clean.evt |
| Size (bytes) | 12,294,720 | 1,632,960 |
| Size | 11.7 MB | 1.6 MB |
| Events in quadrant A | 149,168 | 7,635 |
| Events in quadrant B | 81,363 | 8,351 |
| Events in quadrant C | 72,882 | 7,940 |
| Events in quadrant D | 135,528 | 6,146 |
| Mode SS | |||
|---|---|---|---|
| Quadrant | BADHDUFLAG | Total packets | Discarded packets |
| A | 0 | 4 | 0 |
| B | 0 | 4 | 0 |
| C | 0 | 4 | 0 |
| D | 0 | 4 | 0 |
| Mode M9 | |||
|---|---|---|---|
| Quadrant | BADHDUFLAG | Total packets | Discarded packets |
| A | 0 | 14 | 0 |
| B | 0 | 15 | 0 |
| C | 0 | 15 | 0 |
| D | 0 | 15 | 0 |
| Mode M0 | |||
|---|---|---|---|
| Quadrant | BADHDUFLAG | Total packets | Discarded packets |
| A | 0 | 559 | 1 |
| B | 0 | 352 | 1 |
| C | 0 | 318 | 1 |
| D | 0 | 518 | 1 |
| Quadrant | Total seconds | Saturated seconds | Saturation percentage |
|---|---|---|---|
| A | 159 | 5 | 3.144654% |
| B | 159 | 1 | 0.628931% |
| C | 159 | 1 | 0.628931% |
| D | 159 | 9 | 5.660377% |
Noise dominated data is calculated using 1-second bins in cleaned event files. If a bin has >2000 counts, and if more than 50% of those come from <1% of pixels, then it is considered to be noise-dominated and hence unusable.
| Quadrant | # 1 sec bins | Bins with >0 counts | Bins with >2000 counts | High rate bins dominated by noise | Noise dominated (total time) | Noise dominated (detector-on time) | Marked lightcurve |
|---|---|---|---|---|---|---|---|
| A | 159 | 159 | 3 | 3 | 1.89% | 1.89% | 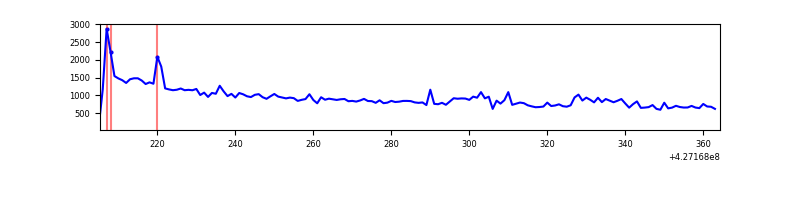 |
| B | 159 | 159 | 0 | 0 | 0.00% | 0.00% | 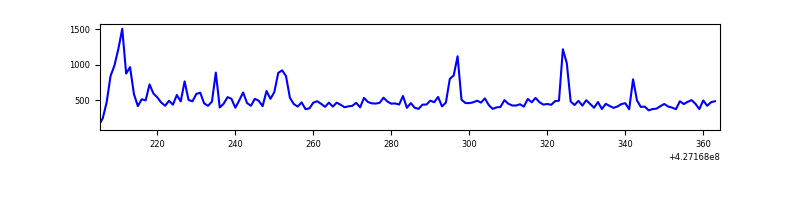 |
| C | 159 | 159 | 0 | 0 | 0.00% | 0.00% | 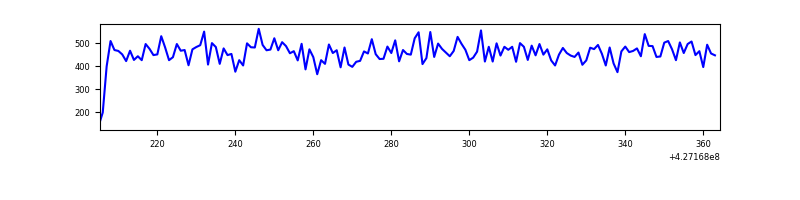 |
| D | 159 | 159 | 10 | 10 | 6.29% | 6.29% | 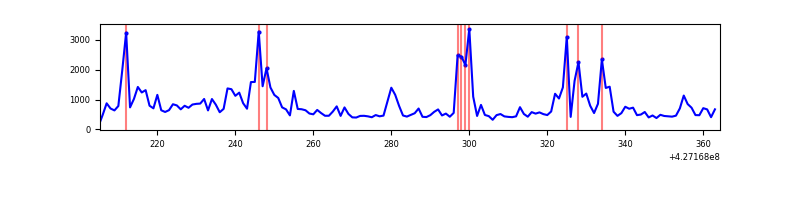 |
Top three noisy pixels from each quadrant. If the there are fewer than three noisy pixels in the level2.evt file, extra rows are filled as -1
| Pixel properties | Quadrant properties | ||||||
|---|---|---|---|---|---|---|---|
| Quadrant | DetID | PixID | Counts | Sigma | Mean | Median | Sigma |
| A | 10 | 83 | 71483 | 13457.62 | 16 | 15 | 5.3 |
| A | 15 | 223 | 9874 | 1856.48 | 16 | 15 | 5.3 |
| A | 10 | 67 | 1884 | 351.94 | 16 | 15 | 5.3 |
| B | 5 | 255 | 6251 | 1206.04 | 16 | 16 | 5.2 |
| B | 15 | 33 | 5519 | 1064.45 | 16 | 16 | 5.2 |
| B | 3 | 112 | 2243 | 430.77 | 16 | 16 | 5.2 |
| C | 15 | 214 | 8793 | 1552.11 | 16 | 16 | 5.7 |
| C | 0 | 207 | 548 | 94.08 | 16 | 16 | 5.7 |
| C | 13 | 61 | 114 | 17.33 | 16 | 16 | 5.7 |
| D | 1 | 52 | 28399 | 5080.46 | 15 | 14 | 5.6 |
| D | 12 | 33 | 18754 | 3354.16 | 15 | 14 | 5.6 |
| D | 10 | 199 | 11345 | 2028.07 | 15 | 14 | 5.6 |
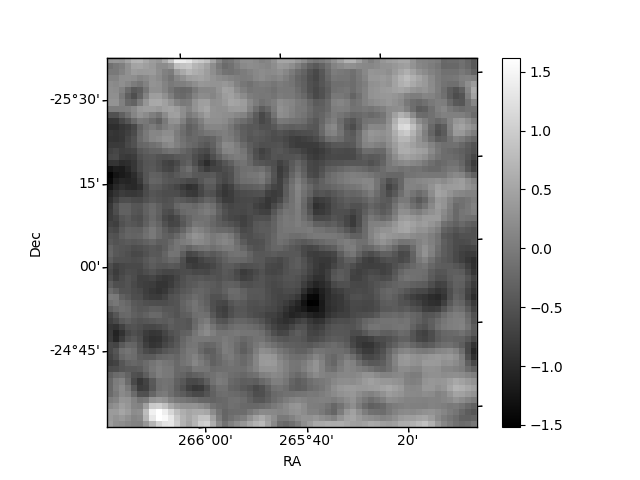
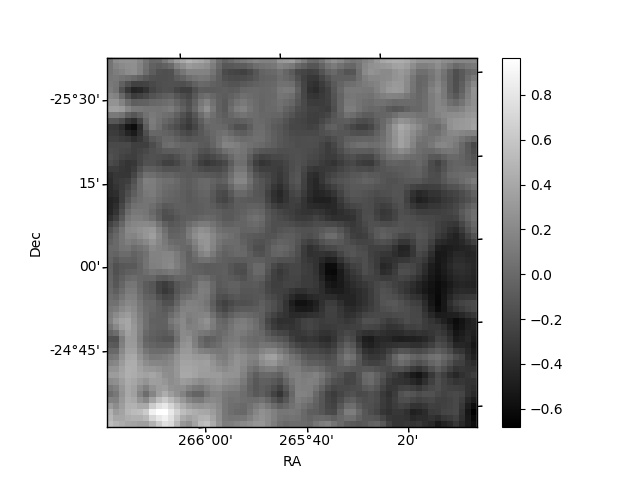
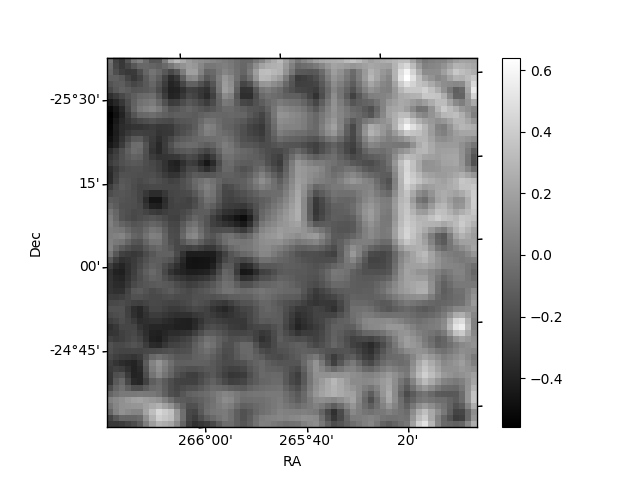
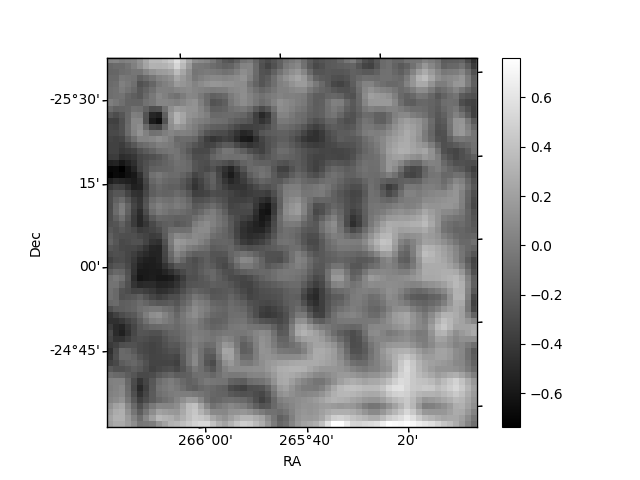
Histogram calculated using DETX and DETY for each event in the final _common_clean file
| Quadrant A | 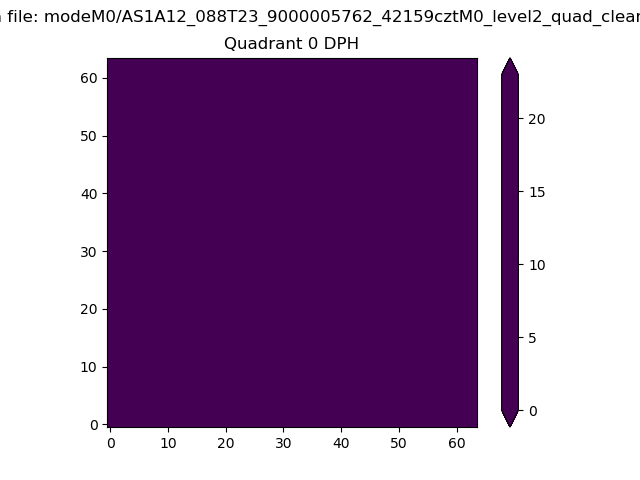 |
 |
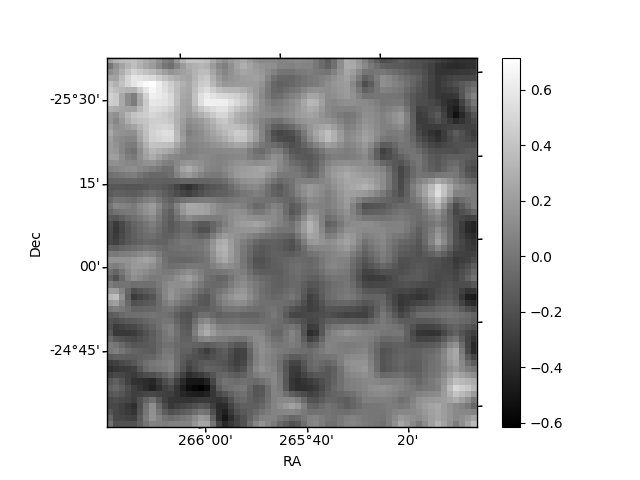
Quadrant B |
|---|---|---|---|
| Quadrant D | 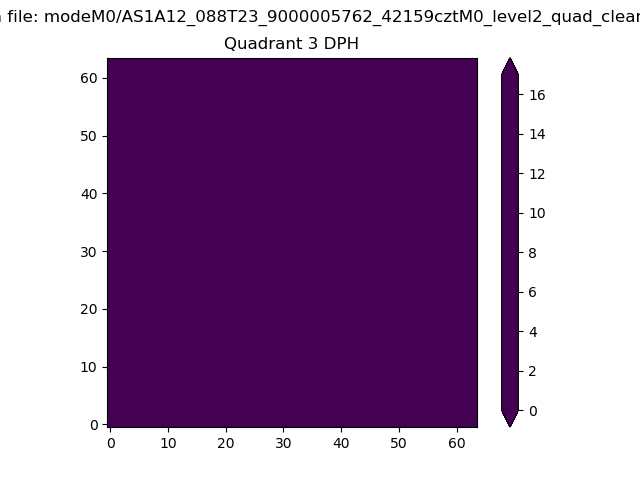 |
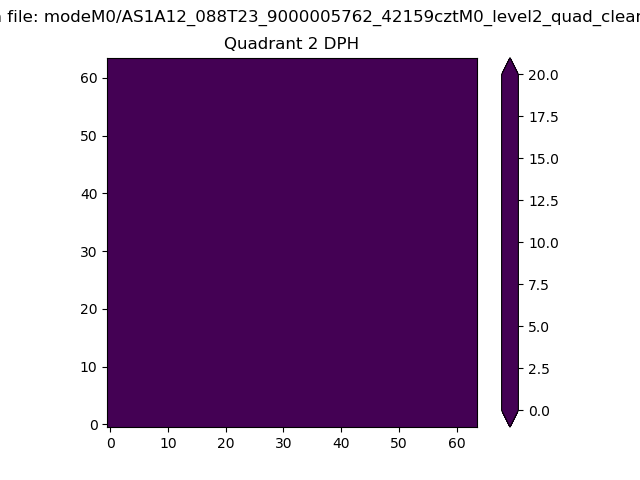 |
Quadrant C |
| Plot type | Count rate plots | Images |
|---|---|---|
| Comparison with Poisson distribution Blue bars denote a histogram of data divided into 1 sec bins. Red curve is a Poisson curve with rate = median count rate of data. |
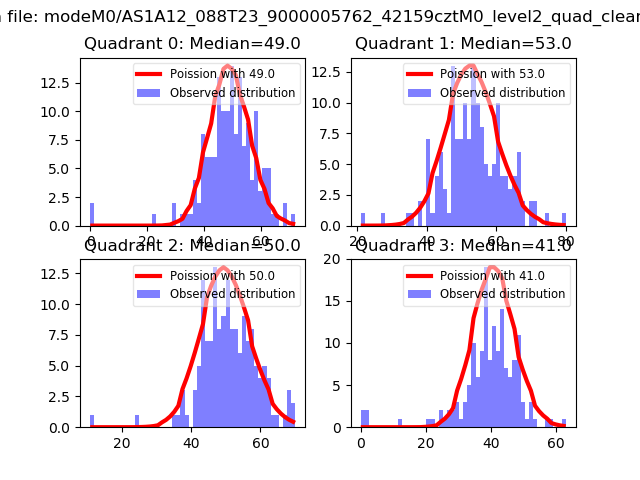 |
 |
| Quadrant-wise count rates Data is divided into 100 sec bins |
 |
|
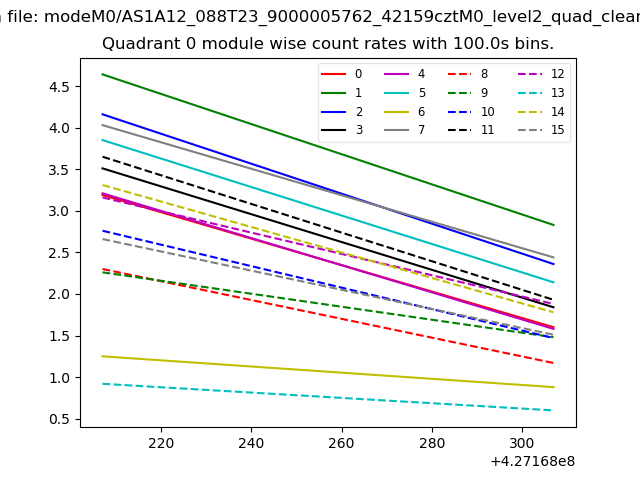
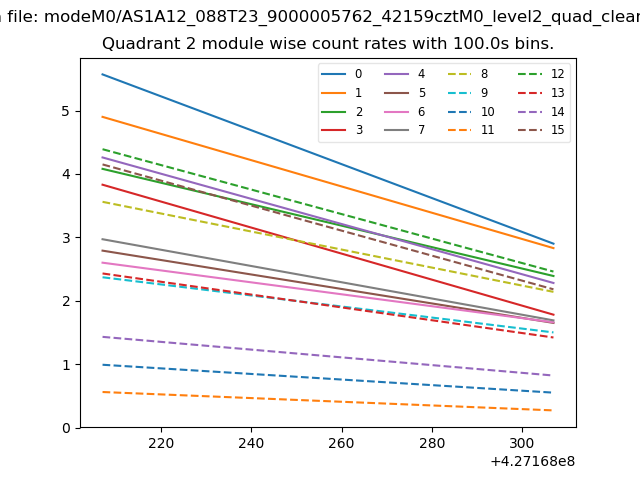
| Module-wise count rates for Quadrant A Data is divided into 100 sec bins |
 |
 |
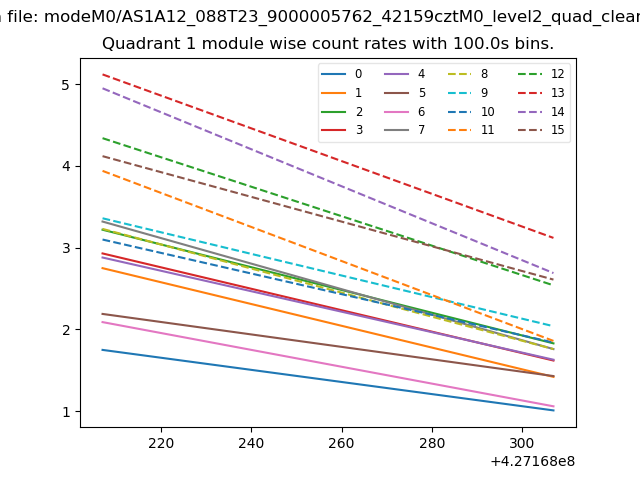
| Module-wise count rates for Quadrant B Data is divided into 100 sec bins |
 |
 |
| Module-wise count rates for Quadrant C Data is divided into 100 sec bins |
 |
 |
| Module-wise count rates for Quadrant D Data is divided into 100 sec bins |
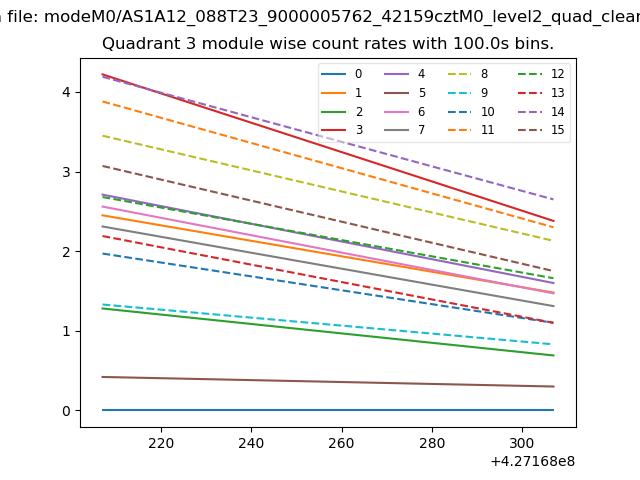 |
 |
| Parameter | Plot |
|---|---|
| CZT HV Monitor | 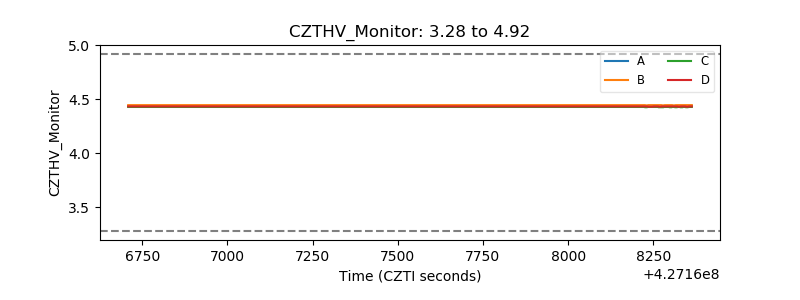 |
| D_VDD | 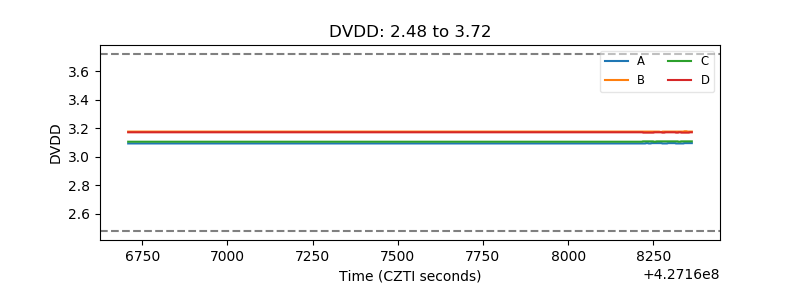 |
| Temperature 1 | 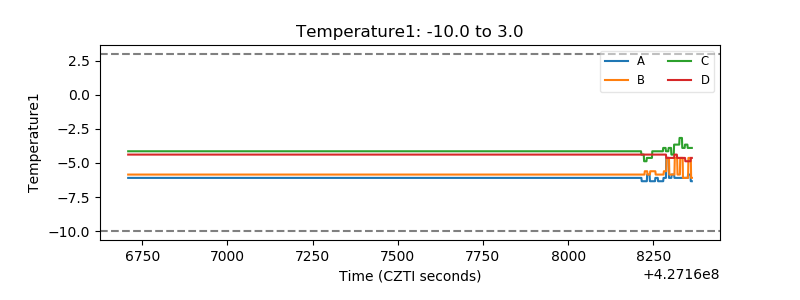 |
| Veto HV Monitor |  |
| Veto LLD | 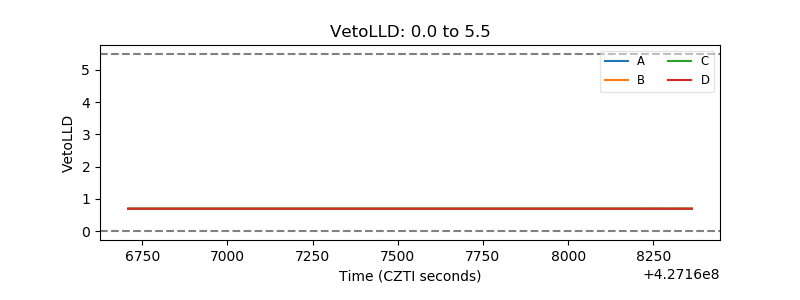 |
| Alpha Counter | 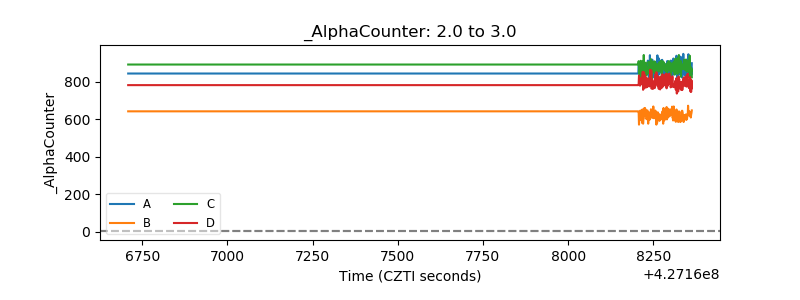 |
| _CPM_Rate | 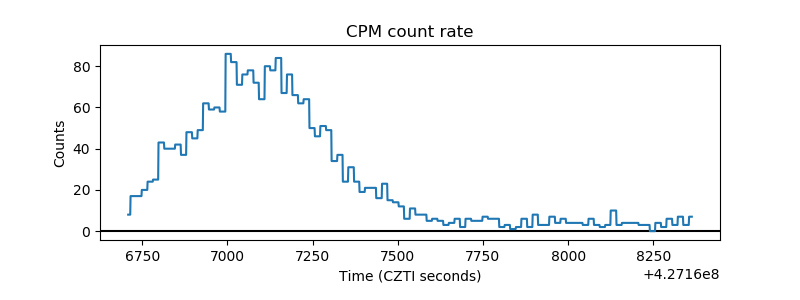 |
| CZT Counter | 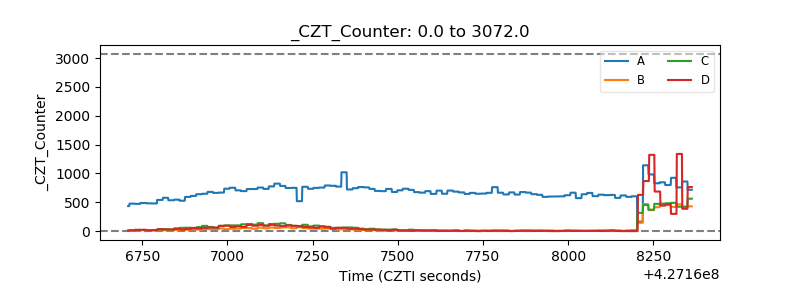 |
| +2.5 Volts monitor | 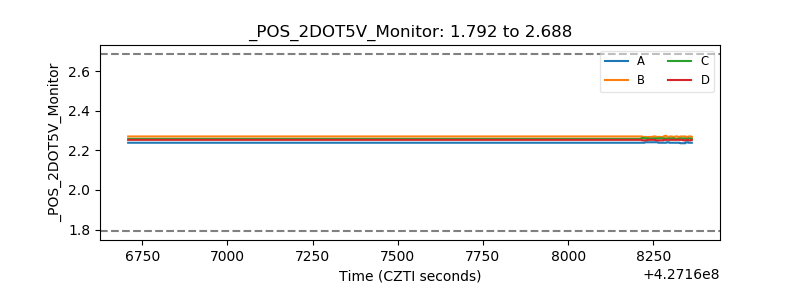 |
| +5 Volts monitor | 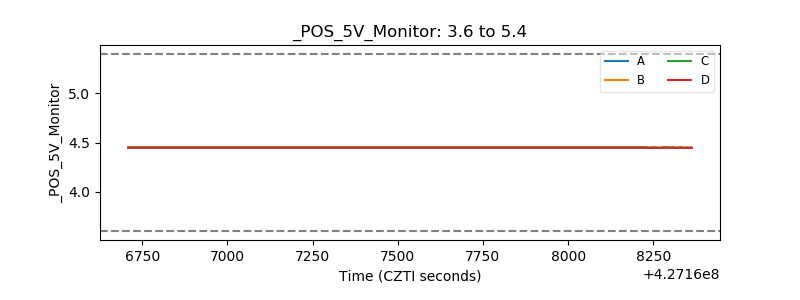 |
| _ROLL_ROT | 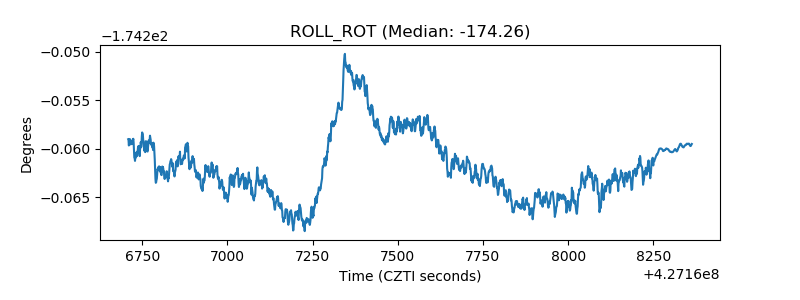 |
| _Roll_DEC | 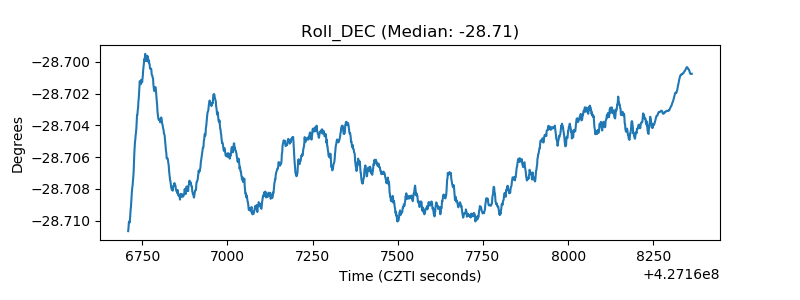 |
| _Roll_RA | 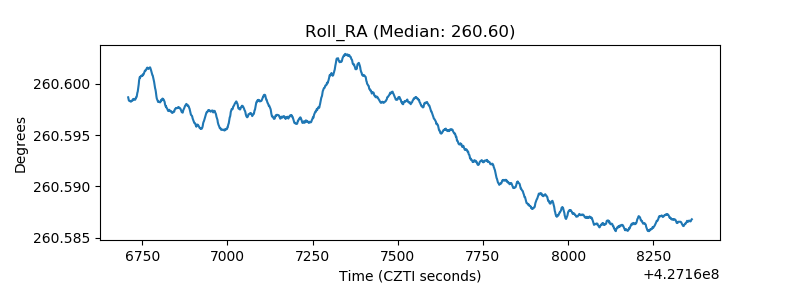 |
| Veto Counter | 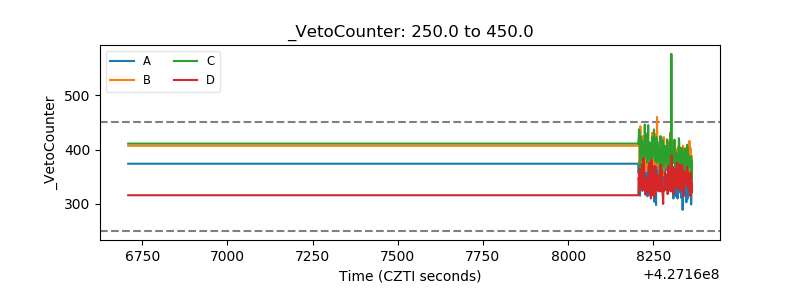 |