| Param | Original file | Final file |
|---|---|---|
| Filename | modeM0/AS1A11_032T04_9000005766_42164cztM0_level2.fits | modeM0/AS1A11_032T04_9000005766_42164cztM0_level2_quad_clean.evt |
| Size (bytes) | 388,419,840 | 101,874,240 |
| Size | 370.4 MB | 97.2 MB |
| Events in quadrant A | 3,497,096 | 682,907 |
| Events in quadrant B | 3,041,038 | 699,051 |
| Events in quadrant C | 2,925,371 | 668,035 |
| Events in quadrant D | 4,426,903 | 596,900 |
| Mode M0 | |||
|---|---|---|---|
| Quadrant | BADHDUFLAG | Total packets | Discarded packets |
| A | 0 | 14119 | 2 |
| B | 0 | 13285 | 2 |
| C | 0 | 12602 | 2 |
| D | 0 | 17318 | 2 |
| Mode M9 | |||
|---|---|---|---|
| Quadrant | BADHDUFLAG | Total packets | Discarded packets |
| A | 0 | 29 | 0 |
| B | 0 | 29 | 0 |
| C | 0 | 29 | 0 |
| D | 0 | 29 | 0 |
| Mode SS | |||
|---|---|---|---|
| Quadrant | BADHDUFLAG | Total packets | Discarded packets |
| A | 0 | 130 | 0 |
| B | 0 | 130 | 0 |
| C | 0 | 130 | 0 |
| D | 0 | 130 | 0 |
| Quadrant | Total seconds | Saturated seconds | Saturation percentage |
|---|---|---|---|
| A | 6267 | 32 | 0.510611% |
| B | 6267 | 20 | 0.319132% |
| C | 6267 | 3 | 0.047870% |
| D | 6267 | 283 | 4.515717% |
Noise dominated data is calculated using 1-second bins in cleaned event files. If a bin has >2000 counts, and if more than 50% of those come from <1% of pixels, then it is considered to be noise-dominated and hence unusable.
| Quadrant | # 1 sec bins | Bins with >0 counts | Bins with >2000 counts | High rate bins dominated by noise | Noise dominated (total time) | Noise dominated (detector-on time) | Marked lightcurve |
|---|---|---|---|---|---|---|---|
| A | 9193 | 6269 | 16 | 16 | 0.17% | 0.26% | 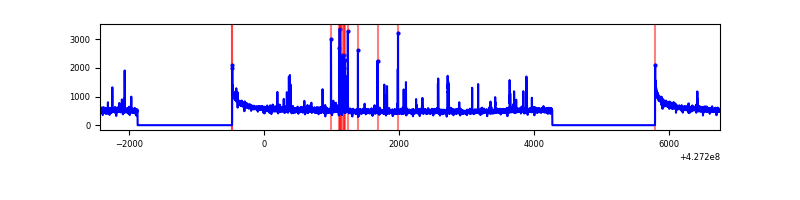 |
| B | 9193 | 6269 | 10 | 10 | 0.11% | 0.16% | 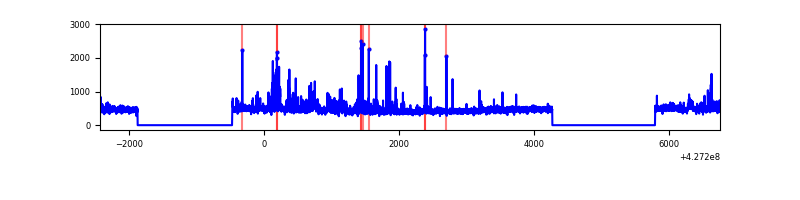 |
| C | 9193 | 6269 | 0 | 0 | 0.00% | 0.00% | 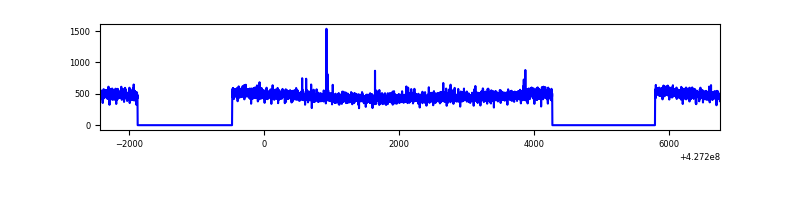 |
| D | 9193 | 6269 | 258 | 258 | 2.81% | 4.12% | 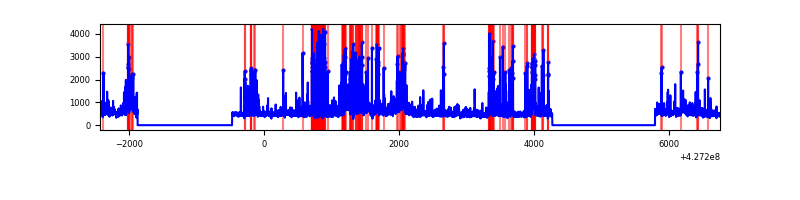 |
Top three noisy pixels from each quadrant. If the there are fewer than three noisy pixels in the level2.evt file, extra rows are filled as -1
| Pixel properties | Quadrant properties | ||||||
|---|---|---|---|---|---|---|---|
| Quadrant | DetID | PixID | Counts | Sigma | Mean | Median | Sigma |
| A | 10 | 83 | 639413 | 4477.79 | 693 | 680 | 142.6 |
| A | 15 | 222 | 139787 | 975.2 | 693 | 680 | 142.6 |
| A | 12 | 189 | 21667 | 147.13 | 693 | 680 | 142.6 |
| B | 0 | 229 | 128124 | 942.66 | 689 | 669 | 135.2 |
| B | 5 | 255 | 105449 | 774.95 | 689 | 669 | 135.2 |
| B | 15 | 35 | 48709 | 355.3 | 689 | 669 | 135.2 |
| C | 15 | 214 | 263187 | 1648.36 | 677 | 679 | 159.3 |
| C | 0 | 207 | 8714 | 50.45 | 677 | 679 | 159.3 |
| C | 12 | 249 | 7745 | 44.37 | 677 | 679 | 159.3 |
| D | 12 | 33 | 564916 | 3484.8 | 664 | 645 | 161.9 |
| D | 1 | 52 | 472408 | 2913.49 | 664 | 645 | 161.9 |
| D | 12 | 6 | 282290 | 1739.37 | 664 | 645 | 161.9 |
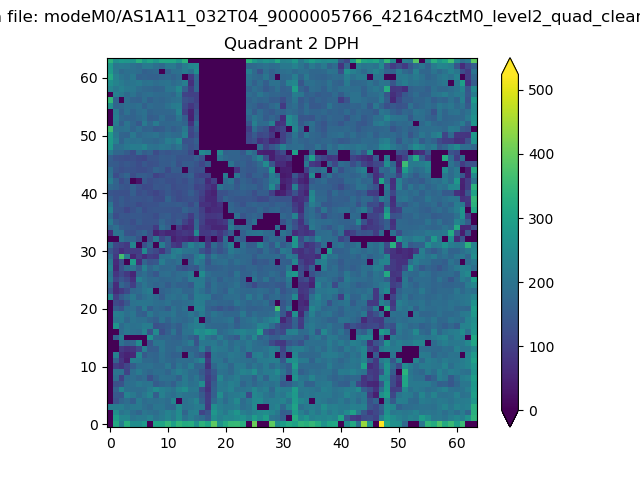
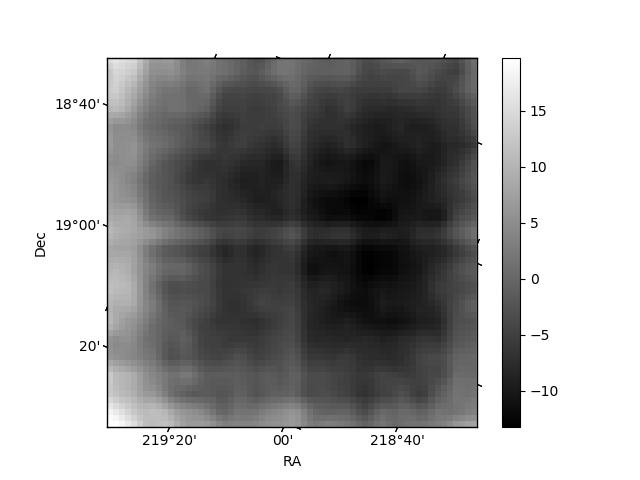
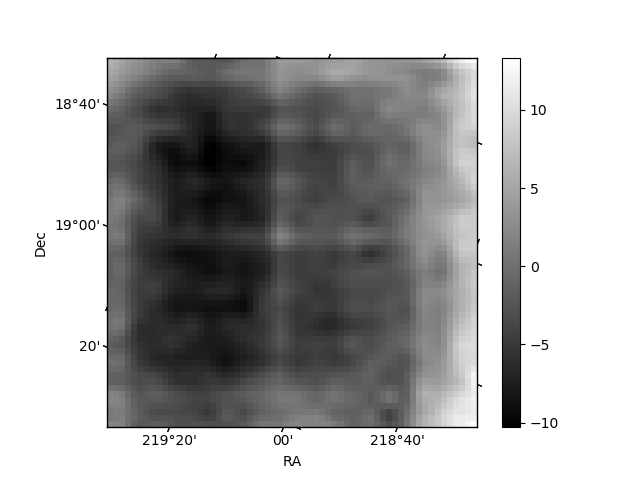
Histogram calculated using DETX and DETY for each event in the final _common_clean file
| Quadrant A | 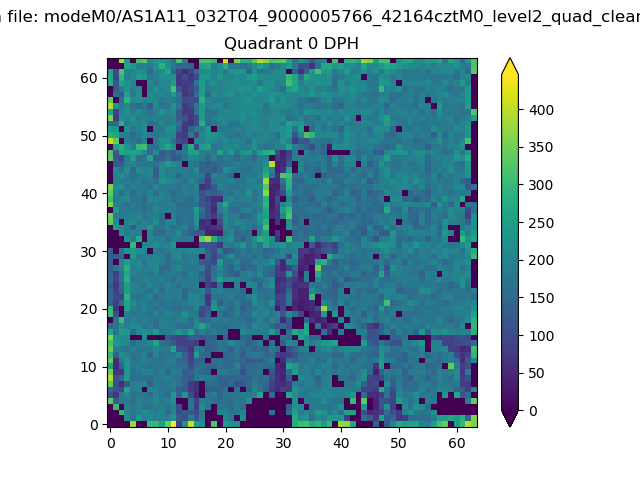 |
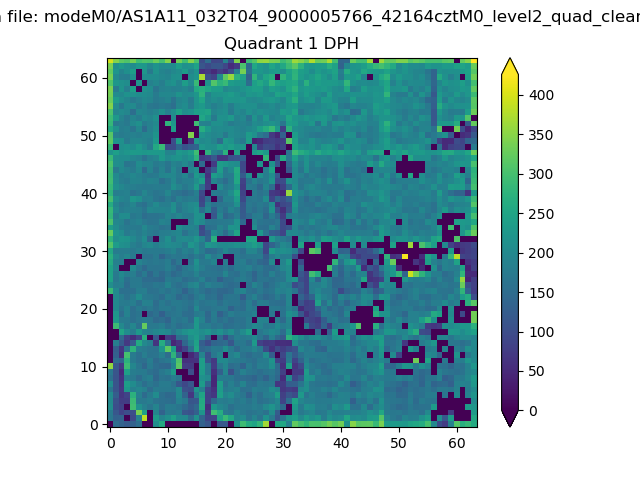 |
Quadrant B |
|---|---|---|---|
| Quadrant D | 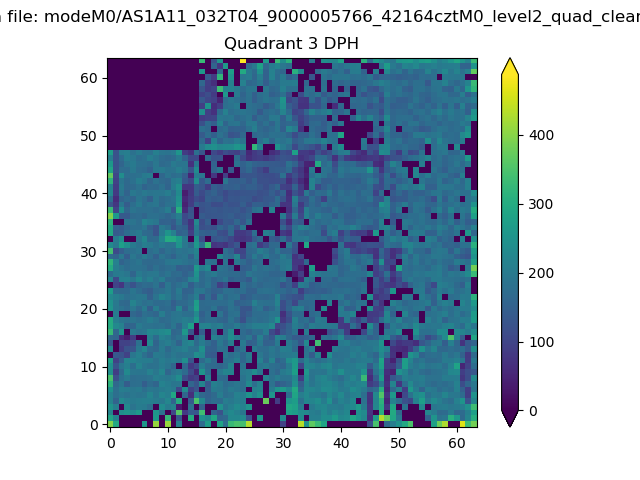 |
 |
Quadrant C |
| Plot type | Count rate plots | Images |
|---|---|---|
| Comparison with Poisson distribution Blue bars denote a histogram of data divided into 1 sec bins. Red curve is a Poisson curve with rate = median count rate of data. |
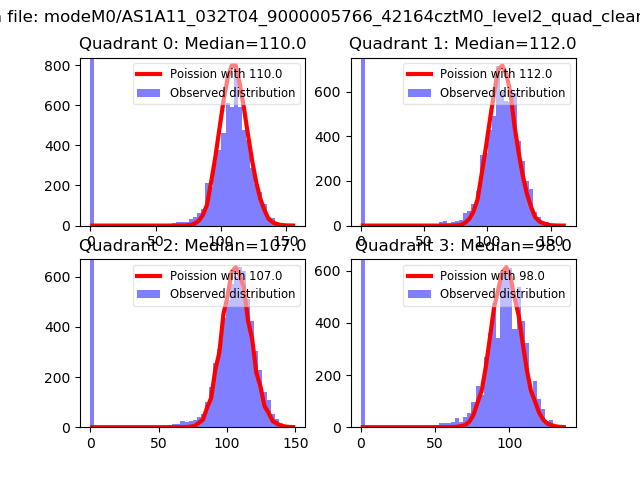 |
 |
| Quadrant-wise count rates Data is divided into 100 sec bins |
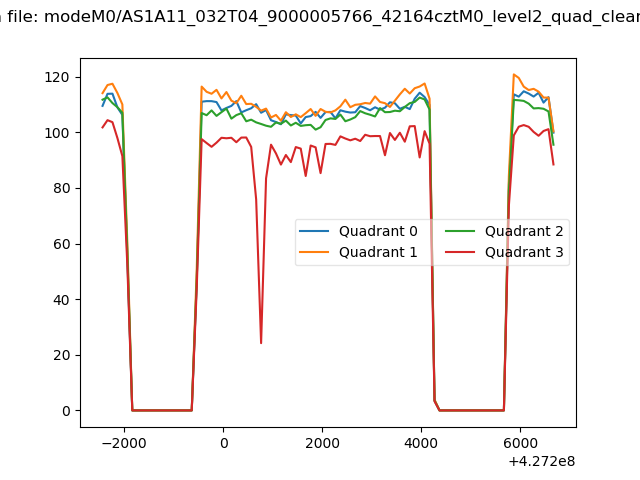 |
|
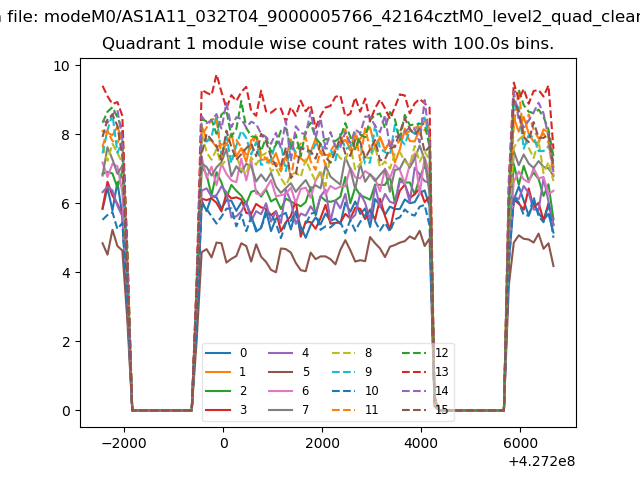
| Module-wise count rates for Quadrant A Data is divided into 100 sec bins |
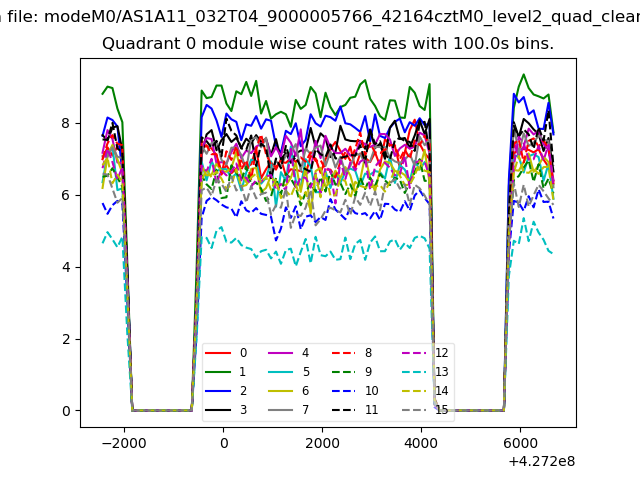 |
 |
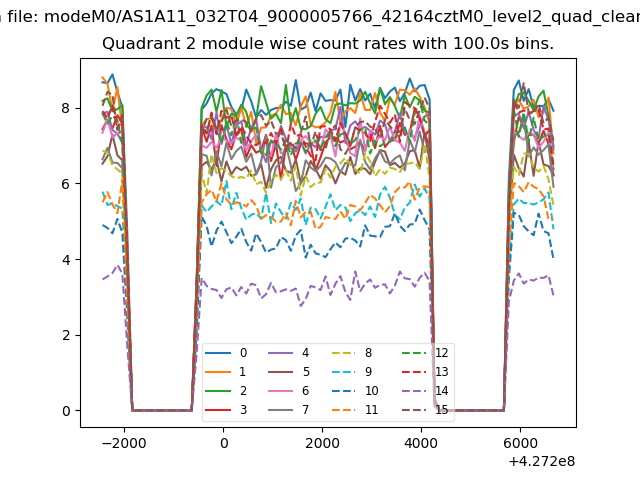
| Module-wise count rates for Quadrant B Data is divided into 100 sec bins |
 |
 |
| Module-wise count rates for Quadrant C Data is divided into 100 sec bins |
 |
 |
| Module-wise count rates for Quadrant D Data is divided into 100 sec bins |
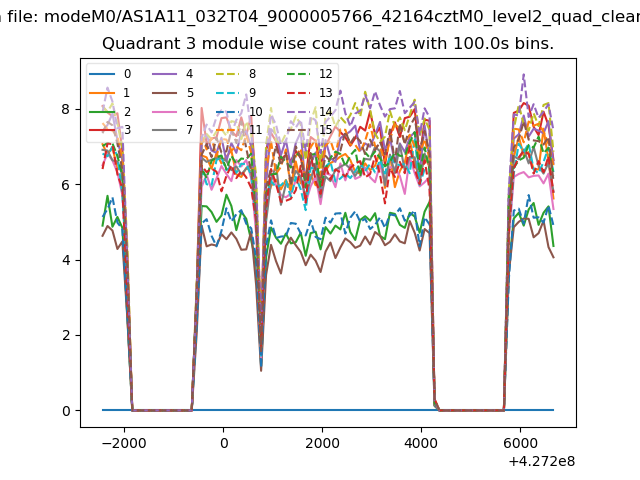 |
 |
| Parameter | Plot |
|---|---|
| CZT HV Monitor | 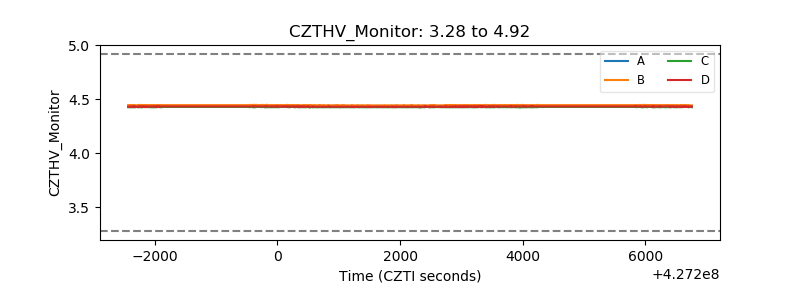 |
| D_VDD | 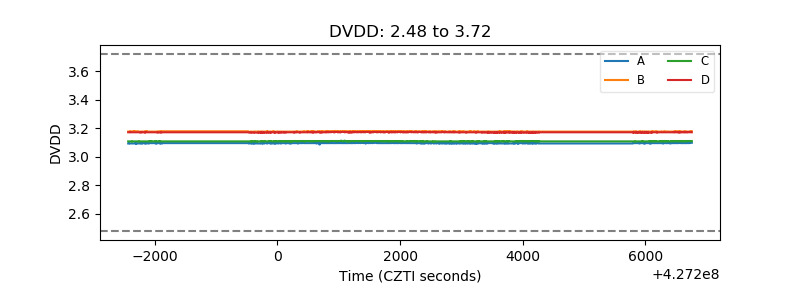 |
| Temperature 1 | 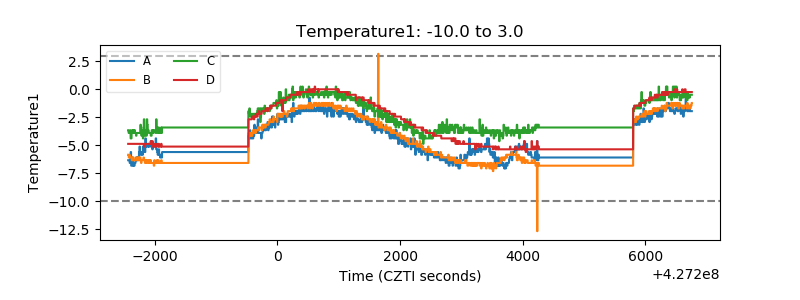 |
| Veto HV Monitor | 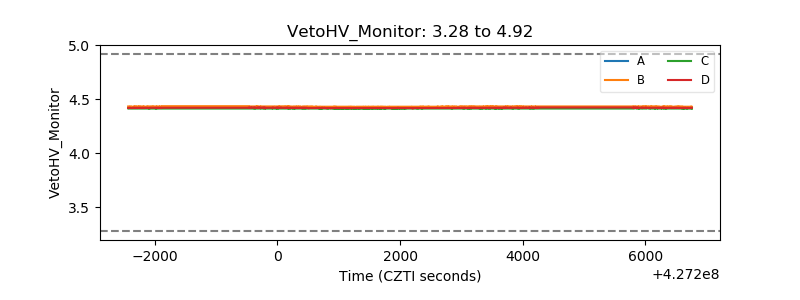 |
| Veto LLD | 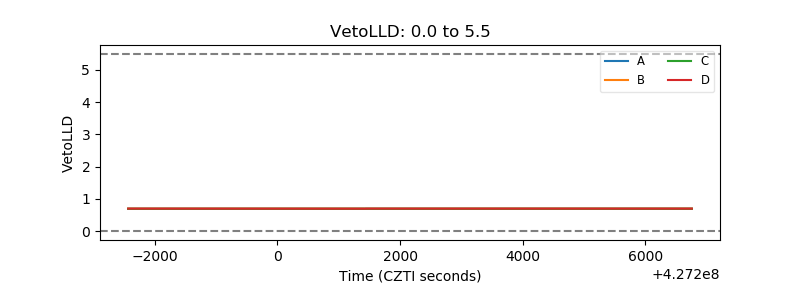 |
| Alpha Counter | 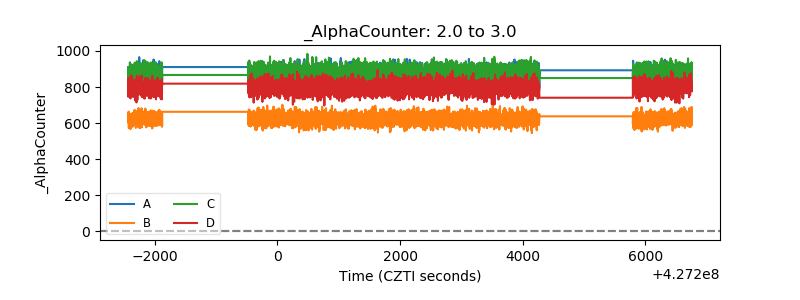 |
| _CPM_Rate | 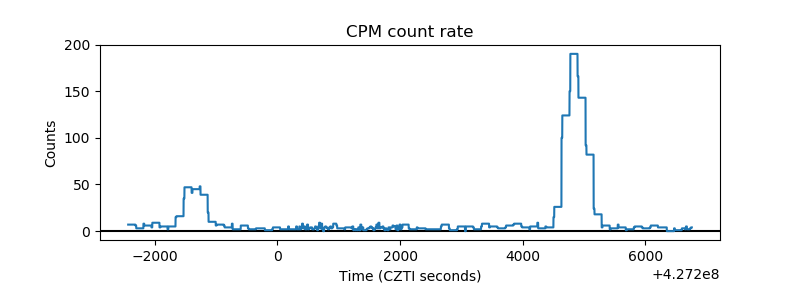 |
| CZT Counter |  |
| +2.5 Volts monitor | 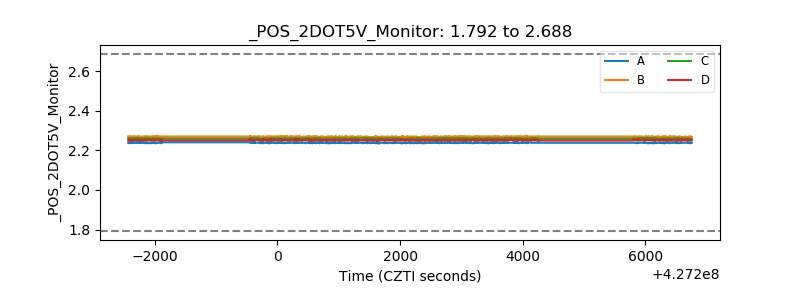 |
| +5 Volts monitor | 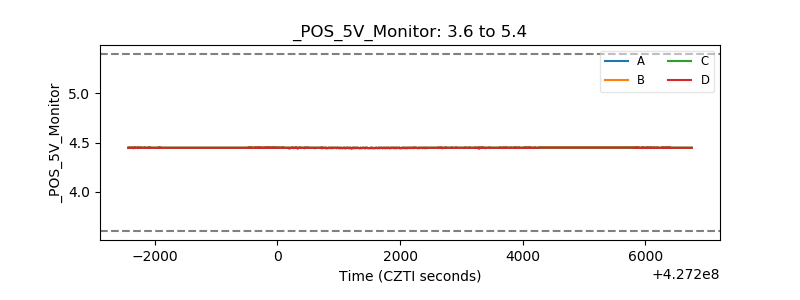 |
| _ROLL_ROT | 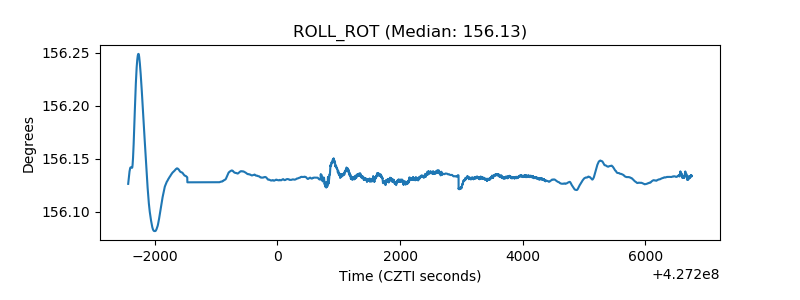 |
| _Roll_DEC | 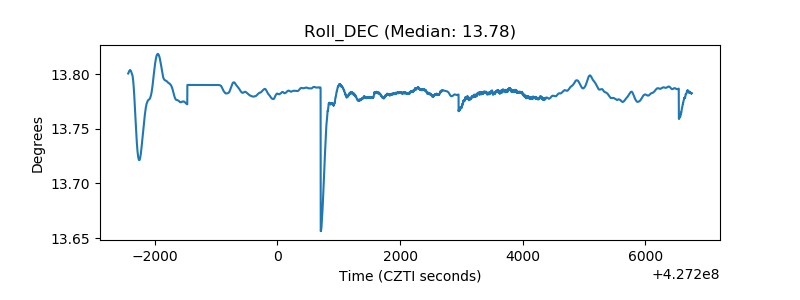 |
| _Roll_RA | 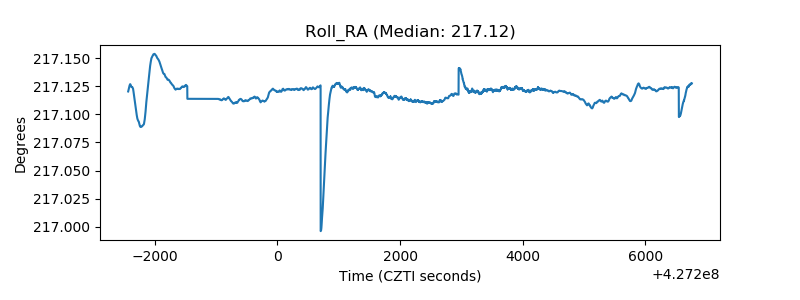 |
| Veto Counter | 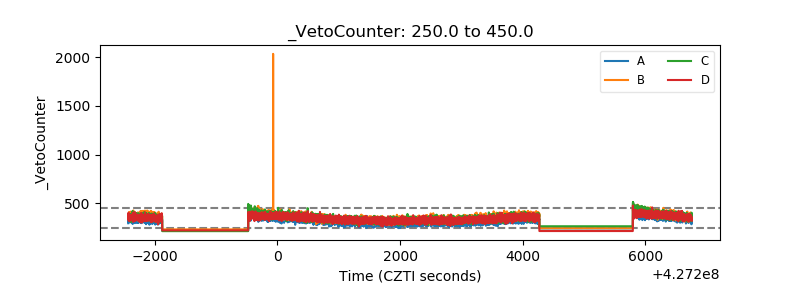 |