| Param | Original file | Final file |
|---|---|---|
| Filename | modeM0/AS1A11_032T04_9000005766_42165cztM0_level2.fits | modeM0/AS1A11_032T04_9000005766_42165cztM0_level2_quad_clean.evt |
| Size (bytes) | 317,537,280 | 88,344,000 |
| Size | 302.8 MB | 84.3 MB |
| Events in quadrant A | 3,121,934 | 590,770 |
| Events in quadrant B | 2,552,872 | 602,565 |
| Events in quadrant C | 2,467,108 | 576,697 |
| Events in quadrant D | 3,193,529 | 529,288 |
| Mode M0 | |||
|---|---|---|---|
| Quadrant | BADHDUFLAG | Total packets | Discarded packets |
| A | 0 | 12581 | 1 |
| B | 0 | 11239 | 1 |
| C | 0 | 10799 | 1 |
| D | 0 | 13271 | 2 |
| Mode M9 | |||
|---|---|---|---|
| Quadrant | BADHDUFLAG | Total packets | Discarded packets |
| A | 0 | 17 | 0 |
| B | 0 | 17 | 0 |
| C | 0 | 17 | 0 |
| D | 0 | 17 | 0 |
| Mode SS | |||
|---|---|---|---|
| Quadrant | BADHDUFLAG | Total packets | Discarded packets |
| A | 0 | 108 | 0 |
| B | 0 | 108 | 0 |
| C | 0 | 108 | 0 |
| D | 0 | 108 | 0 |
| Quadrant | Total seconds | Saturated seconds | Saturation percentage |
|---|---|---|---|
| A | 5370 | 30 | 0.558659% |
| B | 5371 | 10 | 0.186185% |
| C | 5371 | 2 | 0.037237% |
| D | 5370 | 135 | 2.513966% |
Noise dominated data is calculated using 1-second bins in cleaned event files. If a bin has >2000 counts, and if more than 50% of those come from <1% of pixels, then it is considered to be noise-dominated and hence unusable.
| Quadrant | # 1 sec bins | Bins with >0 counts | Bins with >2000 counts | High rate bins dominated by noise | Noise dominated (total time) | Noise dominated (detector-on time) | Marked lightcurve |
|---|---|---|---|---|---|---|---|
| A | 7013 | 5371 | 18 | 18 | 0.26% | 0.34% | 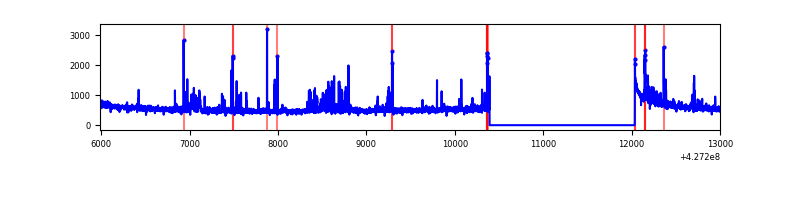 |
| B | 7014 | 5372 | 1 | 1 | 0.01% | 0.02% | 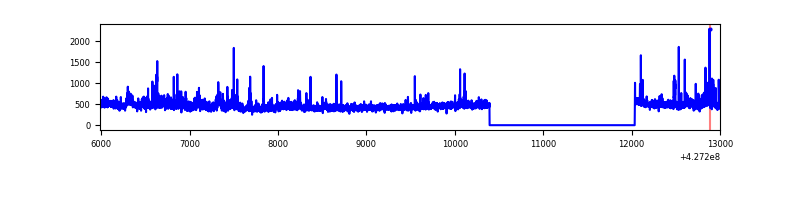 |
| C | 7014 | 5372 | 0 | 0 | 0.00% | 0.00% | 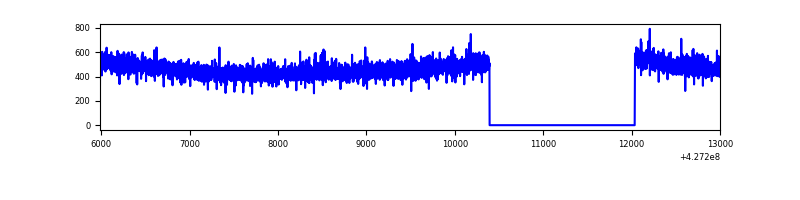 |
| D | 7013 | 5371 | 120 | 120 | 1.71% | 2.23% | 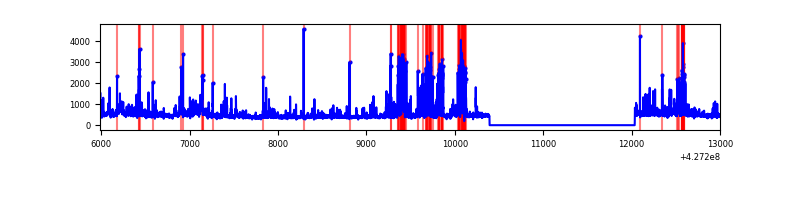 |
Top three noisy pixels from each quadrant. If the there are fewer than three noisy pixels in the level2.evt file, extra rows are filled as -1
| Pixel properties | Quadrant properties | ||||||
|---|---|---|---|---|---|---|---|
| Quadrant | DetID | PixID | Counts | Sigma | Mean | Median | Sigma |
| A | 10 | 83 | 524981 | 4338.14 | 586 | 574 | 120.9 |
| A | 15 | 222 | 272366 | 2248.39 | 586 | 574 | 120.9 |
| A | 12 | 189 | 39046 | 318.25 | 586 | 574 | 120.9 |
| B | 0 | 229 | 139849 | 1224.56 | 582 | 566 | 113.7 |
| B | 0 | 156 | 61925 | 539.46 | 582 | 566 | 113.7 |
| B | 15 | 35 | 35154 | 304.09 | 582 | 566 | 113.7 |
| C | 15 | 214 | 222327 | 1650.77 | 573 | 576 | 134.3 |
| C | 7 | 220 | 4568 | 29.72 | 573 | 576 | 134.3 |
| C | 13 | 61 | 3786 | 23.9 | 573 | 576 | 134.3 |
| D | 12 | 6 | 424740 | 3047.05 | 569 | 553 | 139.2 |
| D | 1 | 52 | 185888 | 1331.31 | 569 | 553 | 139.2 |
| D | 1 | 47 | 97263 | 694.69 | 569 | 553 | 139.2 |
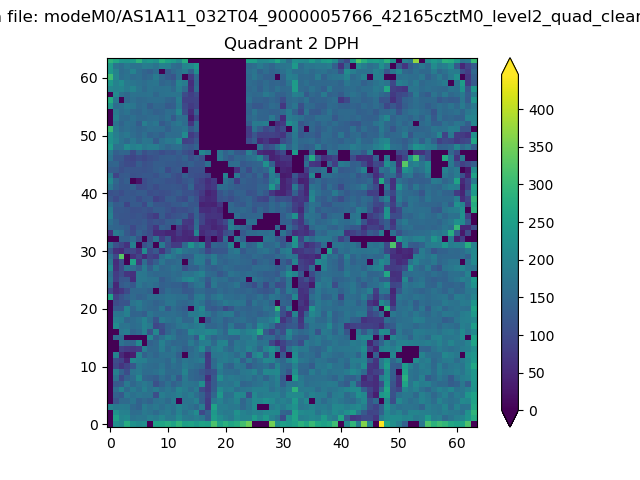
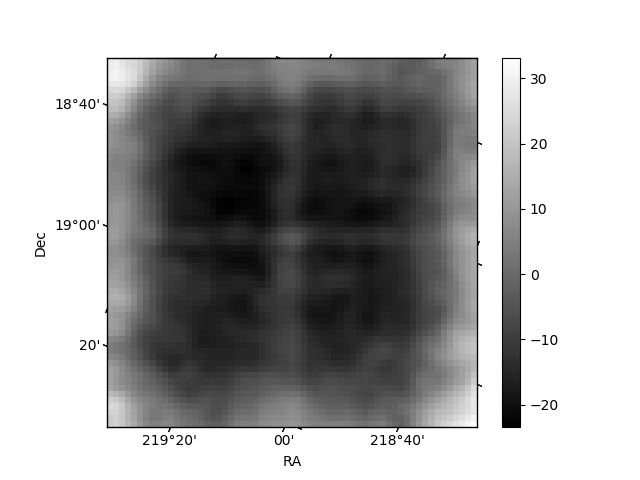
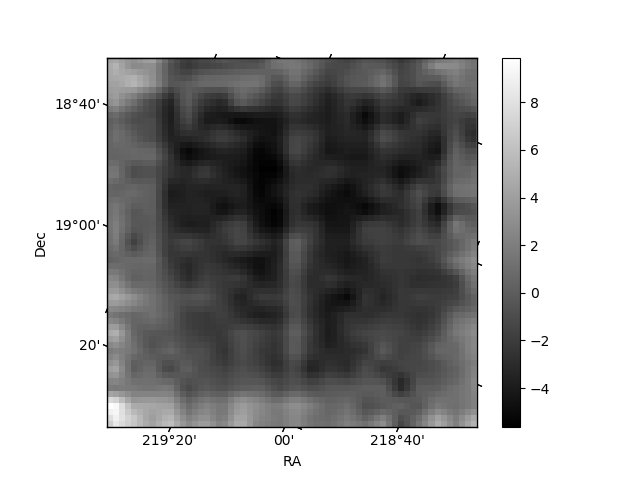
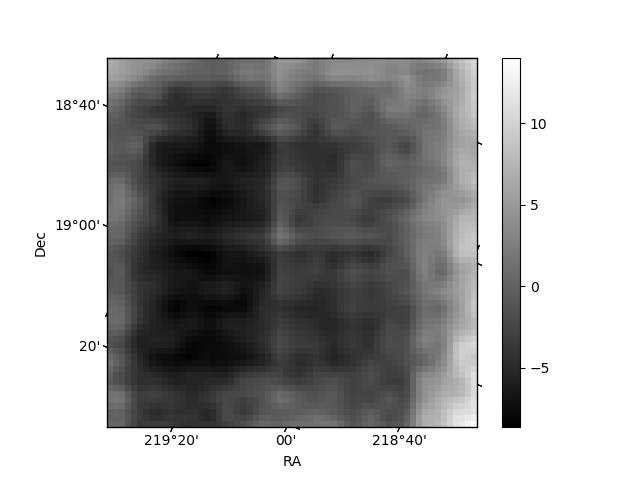
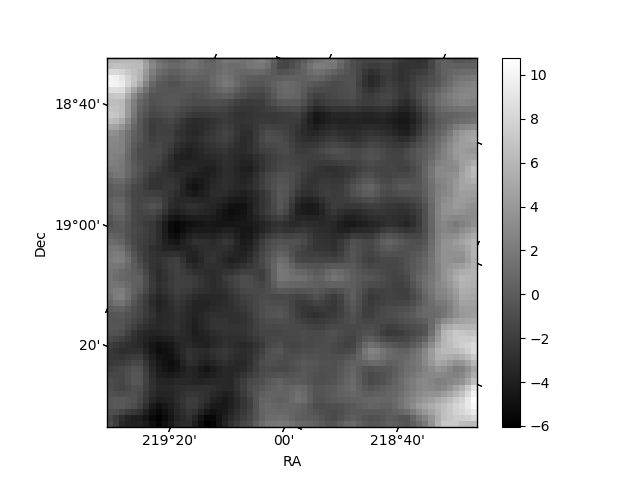
Histogram calculated using DETX and DETY for each event in the final _common_clean file
| Quadrant A | 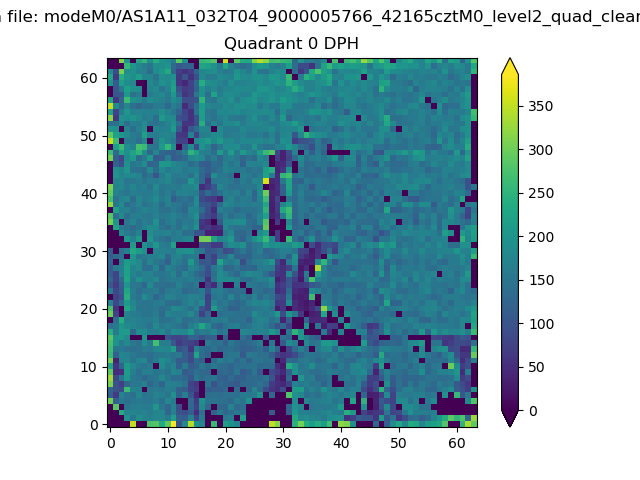 |
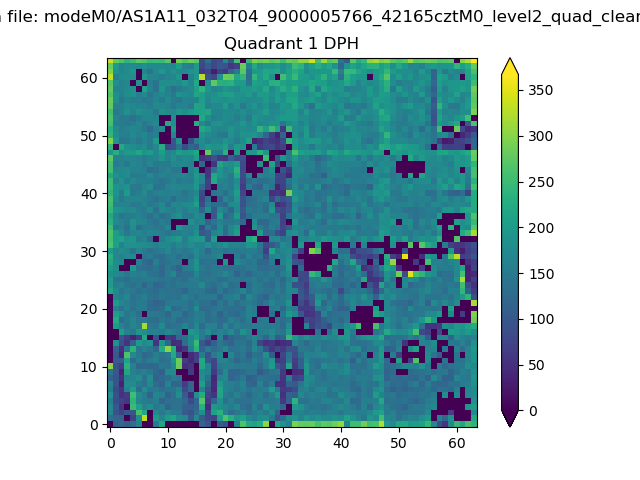 |
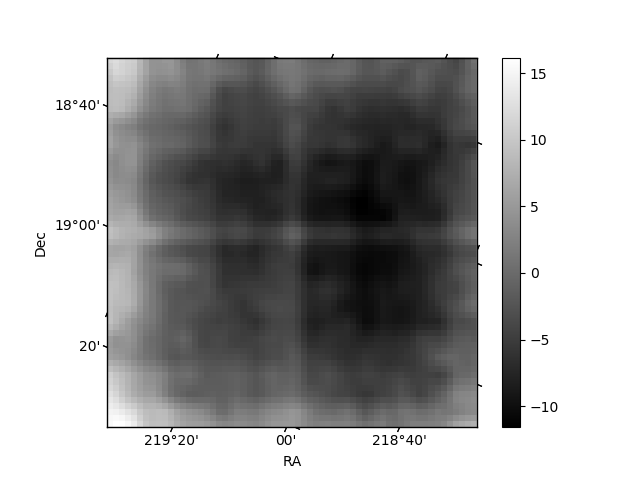
Quadrant B |
|---|---|---|---|
| Quadrant D | 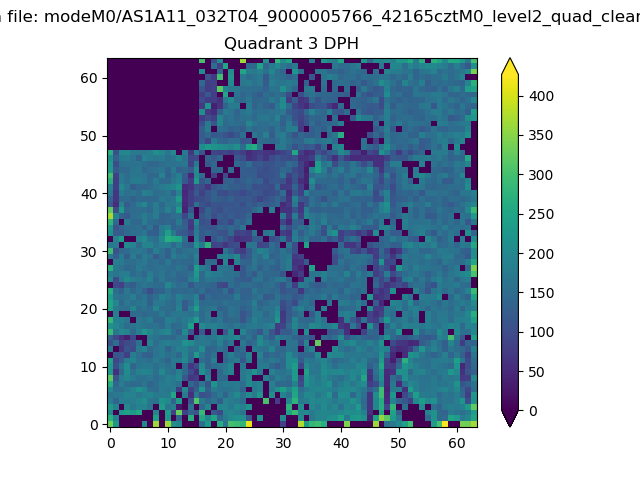 |
 |
Quadrant C |
| Plot type | Count rate plots | Images |
|---|---|---|
| Comparison with Poisson distribution Blue bars denote a histogram of data divided into 1 sec bins. Red curve is a Poisson curve with rate = median count rate of data. |
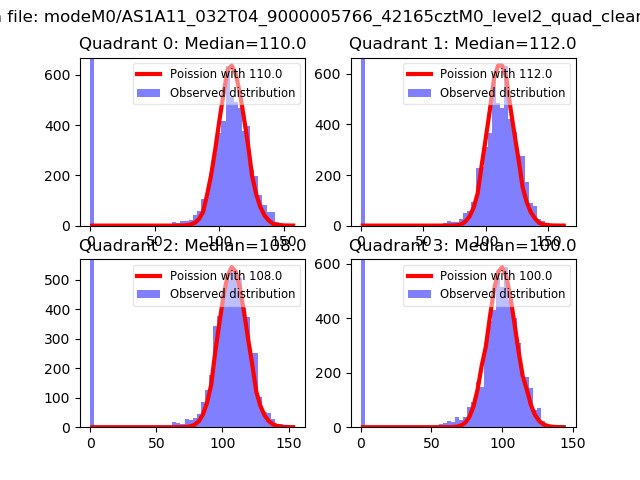 |
 |
| Quadrant-wise count rates Data is divided into 100 sec bins |
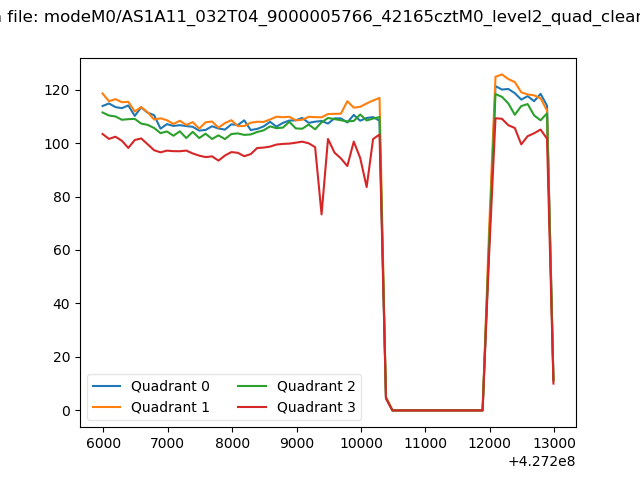 |
|
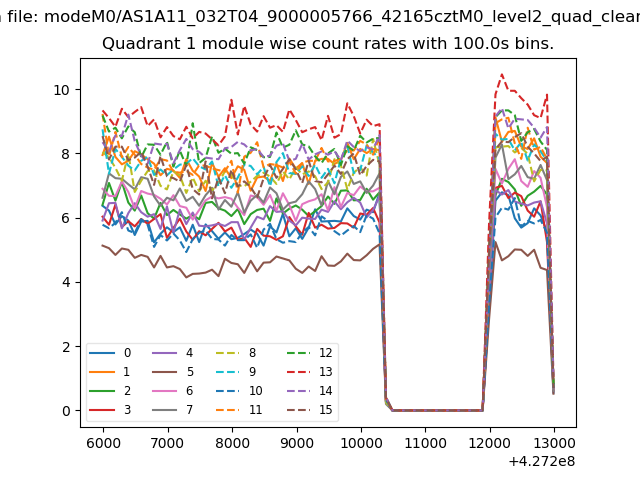
| Module-wise count rates for Quadrant A Data is divided into 100 sec bins |
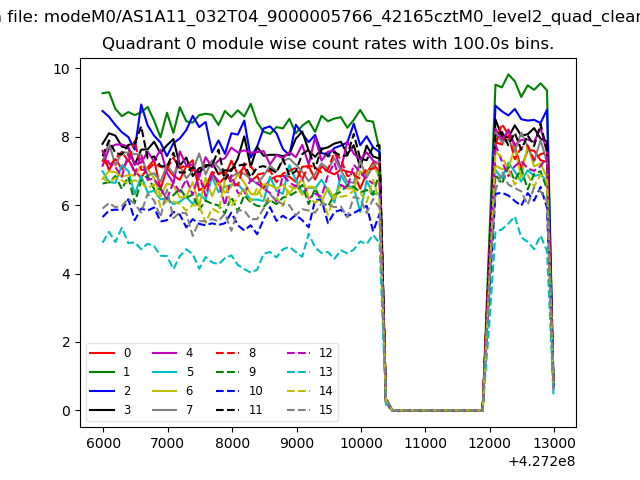 |
 |
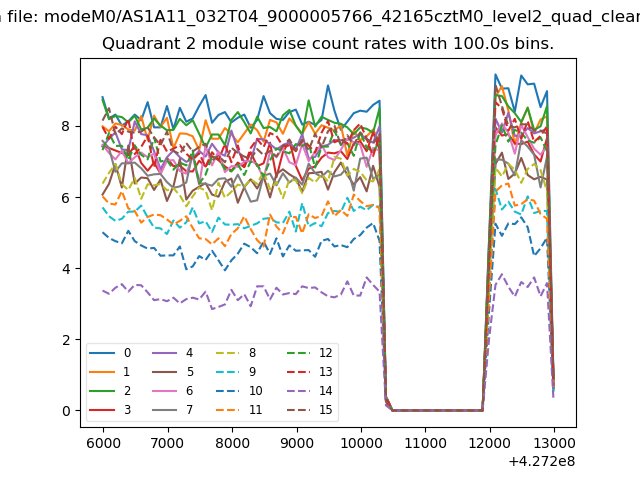
| Module-wise count rates for Quadrant B Data is divided into 100 sec bins |
 |
 |
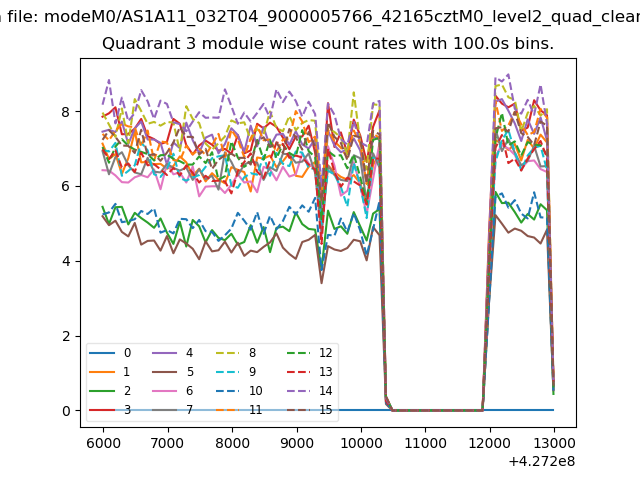
| Module-wise count rates for Quadrant C Data is divided into 100 sec bins |
 |
 |
| Module-wise count rates for Quadrant D Data is divided into 100 sec bins |
 |
 |
| Parameter | Plot |
|---|---|
| CZT HV Monitor | 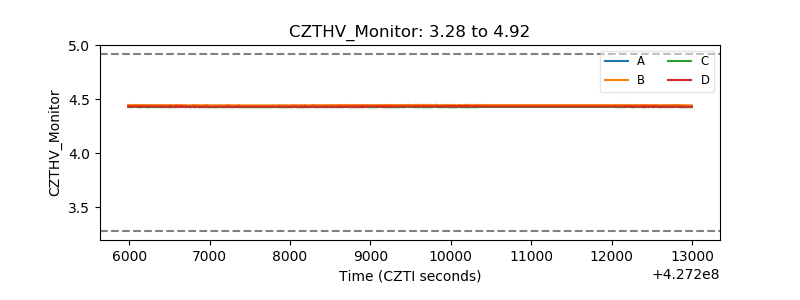 |
| D_VDD | 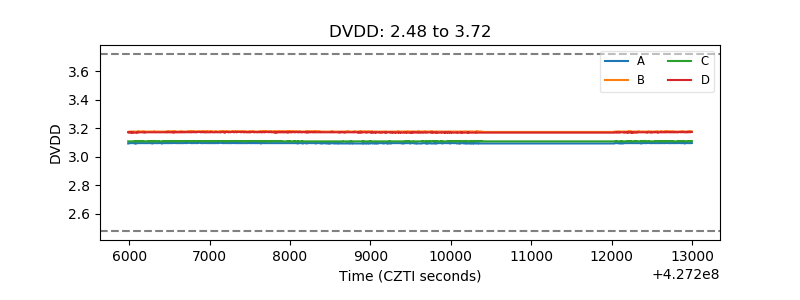 |
| Temperature 1 | 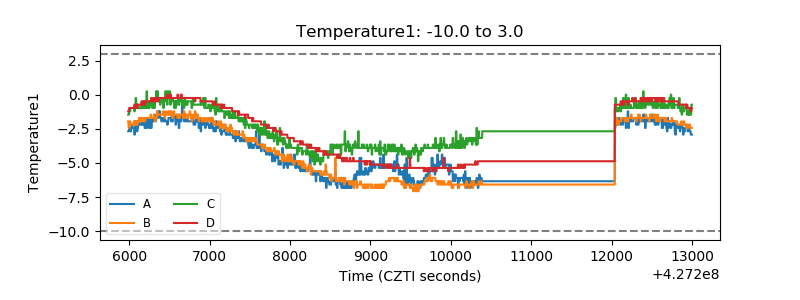 |
| Veto HV Monitor | 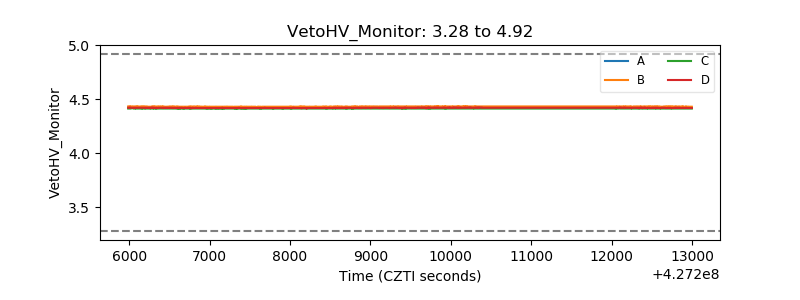 |
| Veto LLD | 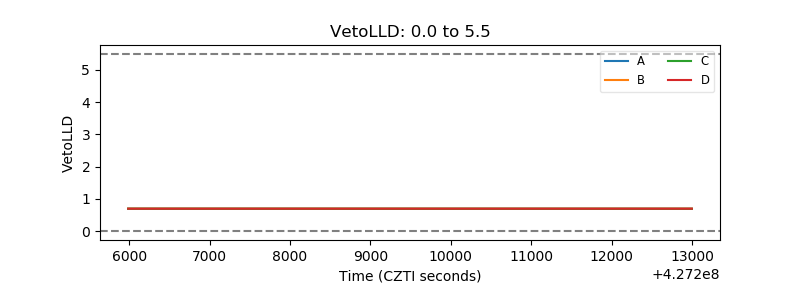 |
| Alpha Counter | 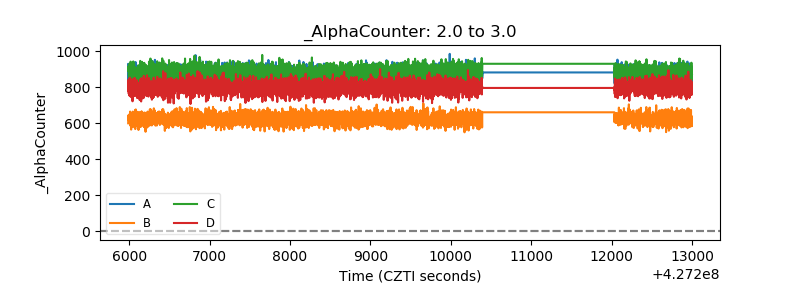 |
| _CPM_Rate | 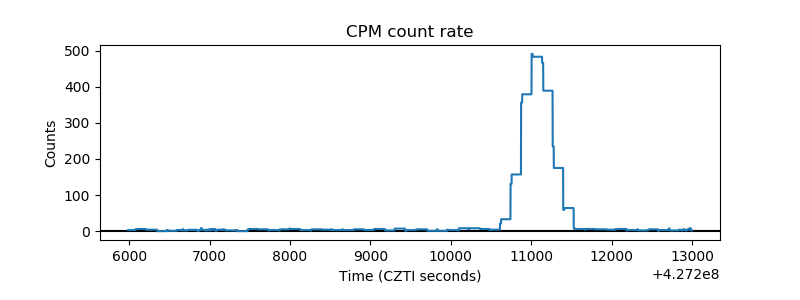 |
| CZT Counter | 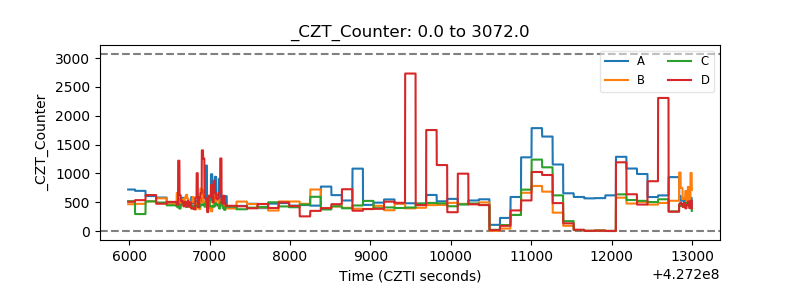 |
| +2.5 Volts monitor | 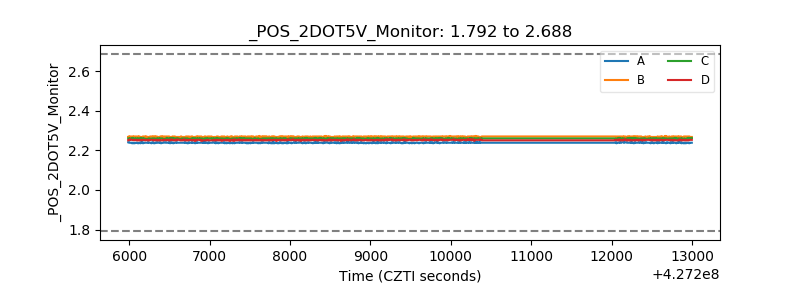 |
| +5 Volts monitor | 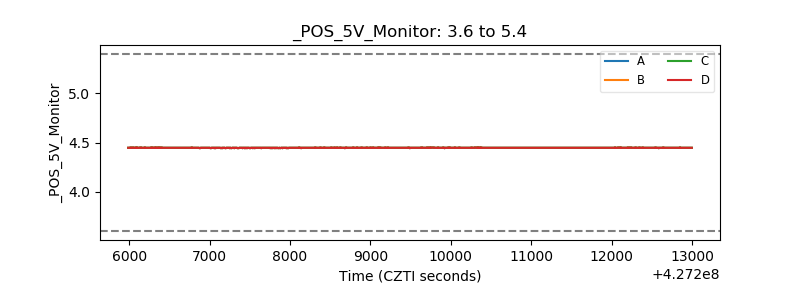 |
| _ROLL_ROT | 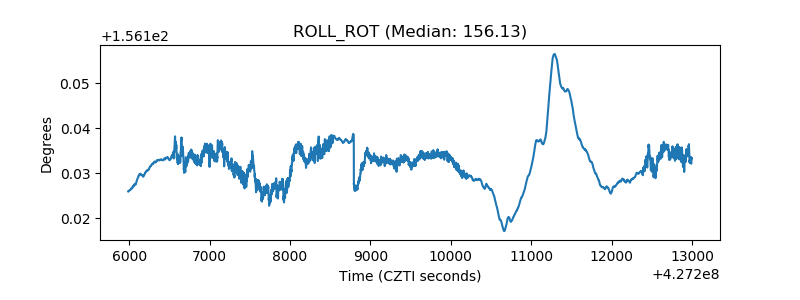 |
| _Roll_DEC |  |
| _Roll_RA | 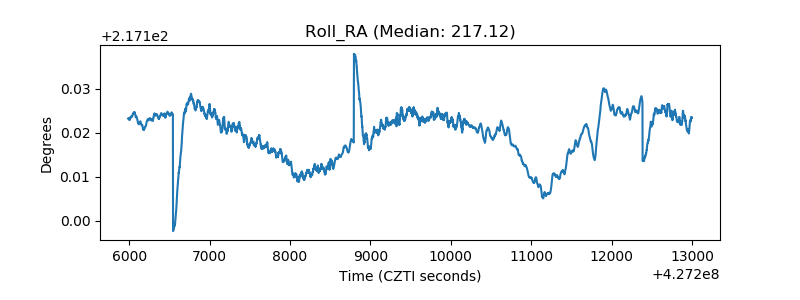 |
| Veto Counter | 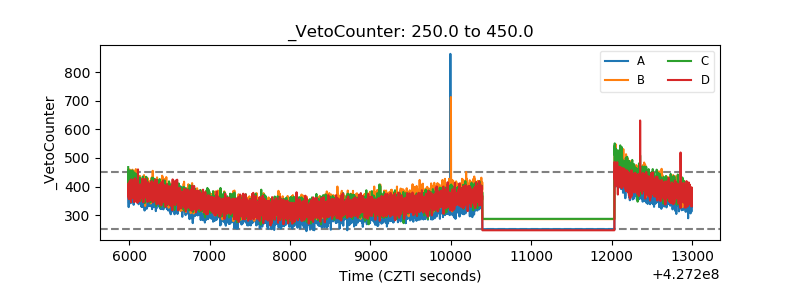 |