| Param | Original file | Final file |
|---|---|---|
| Filename | modeM0/AS1A11_032T04_9000005766_42167cztM0_level2.fits | modeM0/AS1A11_032T04_9000005766_42167cztM0_level2_quad_clean.evt |
| Size (bytes) | 343,644,480 | 91,166,400 |
| Size | 327.7 MB | 86.9 MB |
| Events in quadrant A | 3,592,317 | 602,174 |
| Events in quadrant B | 2,683,998 | 629,809 |
| Events in quadrant C | 2,533,752 | 601,914 |
| Events in quadrant D | 3,486,044 | 544,872 |
| Mode M0 | |||
|---|---|---|---|
| Quadrant | BADHDUFLAG | Total packets | Discarded packets |
| A | 0 | 14177 | 2 |
| B | 0 | 11604 | 2 |
| C | 0 | 11034 | 2 |
| D | 0 | 14188 | 2 |
| Mode M9 | |||
|---|---|---|---|
| Quadrant | BADHDUFLAG | Total packets | Discarded packets |
| A | 0 | 24 | 0 |
| B | 0 | 25 | 0 |
| C | 0 | 25 | 0 |
| D | 0 | 25 | 0 |
| Mode SS | |||
|---|---|---|---|
| Quadrant | BADHDUFLAG | Total packets | Discarded packets |
| A | 0 | 112 | 0 |
| B | 0 | 112 | 0 |
| C | 0 | 112 | 0 |
| D | 0 | 112 | 0 |
| Quadrant | Total seconds | Saturated seconds | Saturation percentage |
|---|---|---|---|
| A | 5451 | 174 | 3.192075% |
| B | 5451 | 18 | 0.330215% |
| C | 5451 | 2 | 0.036691% |
| D | 5451 | 207 | 3.797468% |
Noise dominated data is calculated using 1-second bins in cleaned event files. If a bin has >2000 counts, and if more than 50% of those come from <1% of pixels, then it is considered to be noise-dominated and hence unusable.
| Quadrant | # 1 sec bins | Bins with >0 counts | Bins with >2000 counts | High rate bins dominated by noise | Noise dominated (total time) | Noise dominated (detector-on time) | Marked lightcurve |
|---|---|---|---|---|---|---|---|
| A | 7214 | 5452 | 147 | 147 | 2.04% | 2.70% | 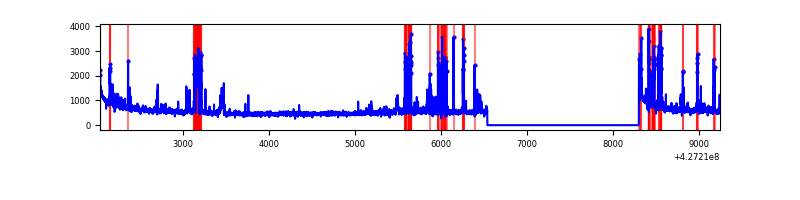 |
| B | 7214 | 5452 | 7 | 7 | 0.10% | 0.13% | 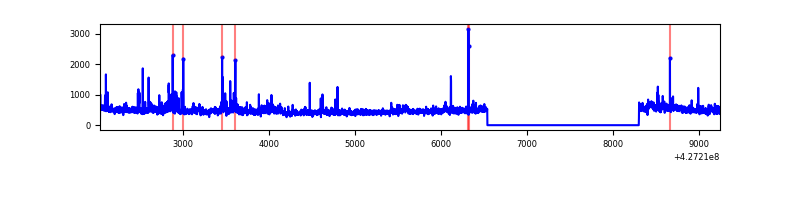 |
| C | 7214 | 5452 | 1 | 1 | 0.01% | 0.02% | 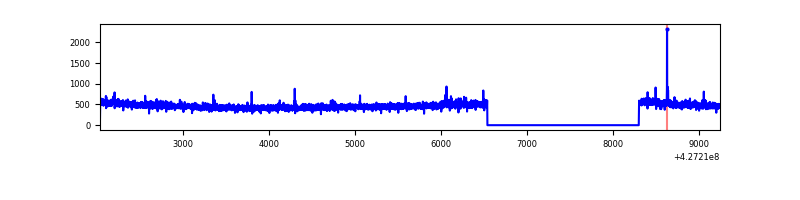 |
| D | 7214 | 5452 | 192 | 192 | 2.66% | 3.52% | 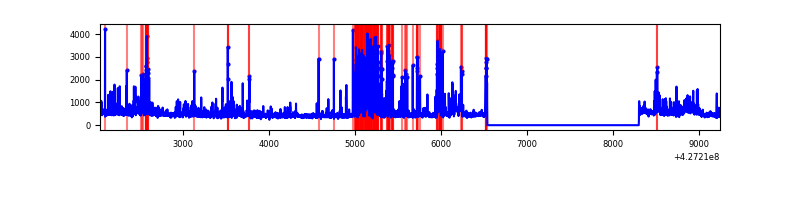 |
Top three noisy pixels from each quadrant. If the there are fewer than three noisy pixels in the level2.evt file, extra rows are filled as -1
| Pixel properties | Quadrant properties | ||||||
|---|---|---|---|---|---|---|---|
| Quadrant | DetID | PixID | Counts | Sigma | Mean | Median | Sigma |
| A | 15 | 222 | 658623 | 5424.47 | 593 | 582 | 121.3 |
| A | 10 | 83 | 587354 | 4836.98 | 593 | 582 | 121.3 |
| A | 13 | 6 | 25923 | 208.9 | 593 | 582 | 121.3 |
| B | 0 | 229 | 163771 | 1405.5 | 596 | 580 | 116.1 |
| B | 0 | 156 | 138771 | 1190.18 | 596 | 580 | 116.1 |
| B | 15 | 35 | 27270 | 229.87 | 596 | 580 | 116.1 |
| C | 15 | 214 | 226866 | 1636.84 | 587 | 588 | 138.2 |
| C | 15 | 159 | 15847 | 110.38 | 587 | 588 | 138.2 |
| C | 13 | 61 | 3919 | 24.1 | 587 | 588 | 138.2 |
| D | 12 | 6 | 621960 | 4349.39 | 581 | 563 | 142.9 |
| D | 1 | 52 | 269841 | 1884.78 | 581 | 563 | 142.9 |
| D | 1 | 47 | 185100 | 1291.64 | 581 | 563 | 142.9 |
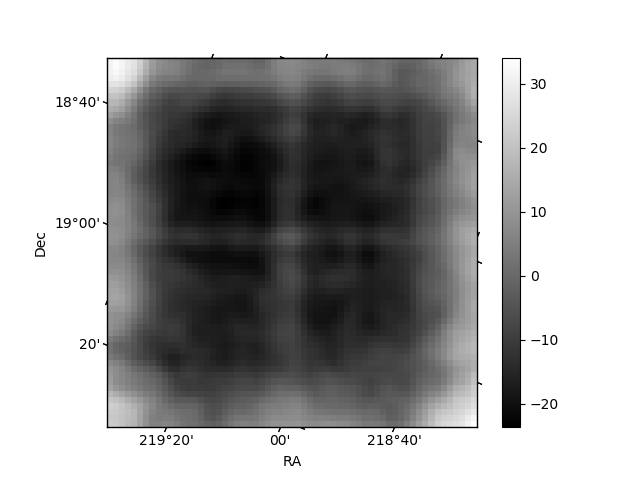
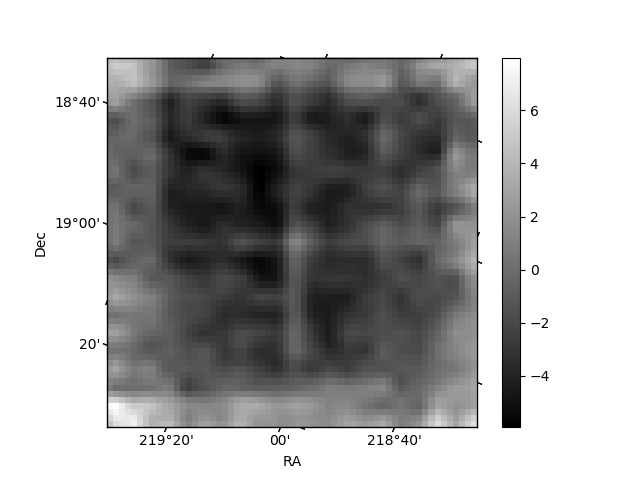
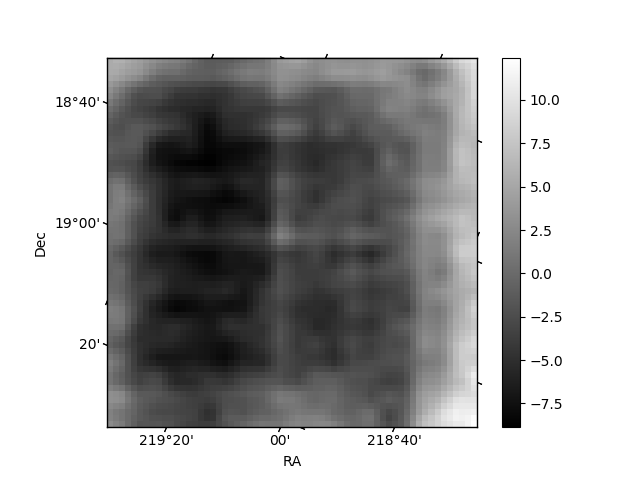
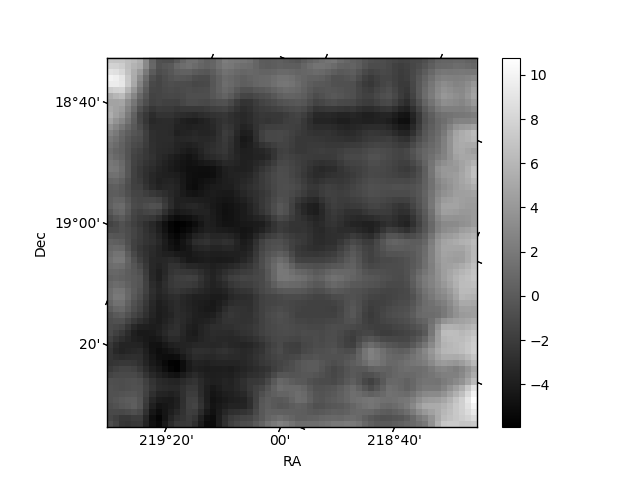
Histogram calculated using DETX and DETY for each event in the final _common_clean file
| Quadrant A | 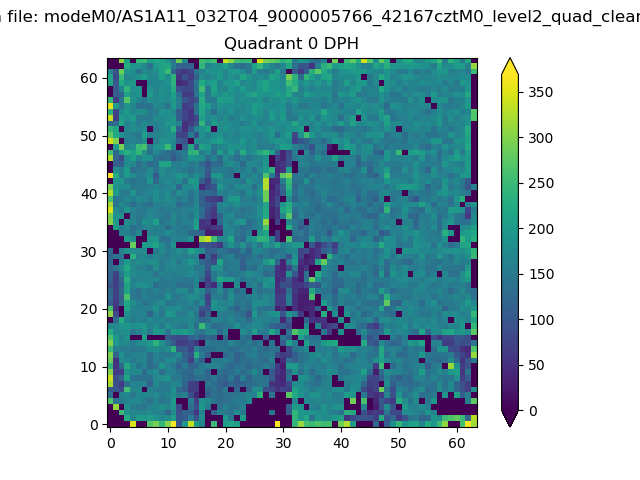 |
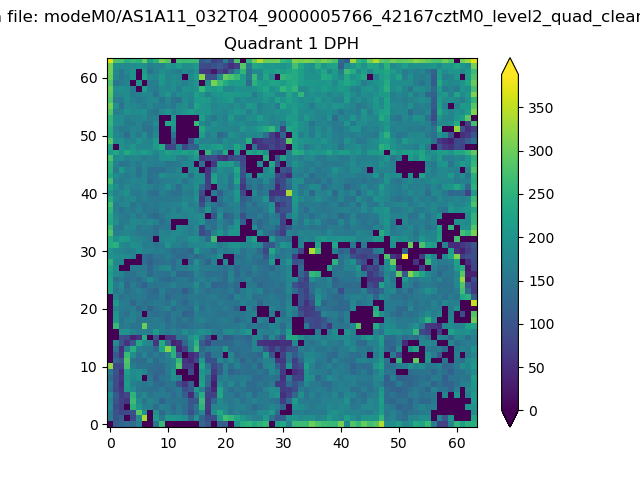 |
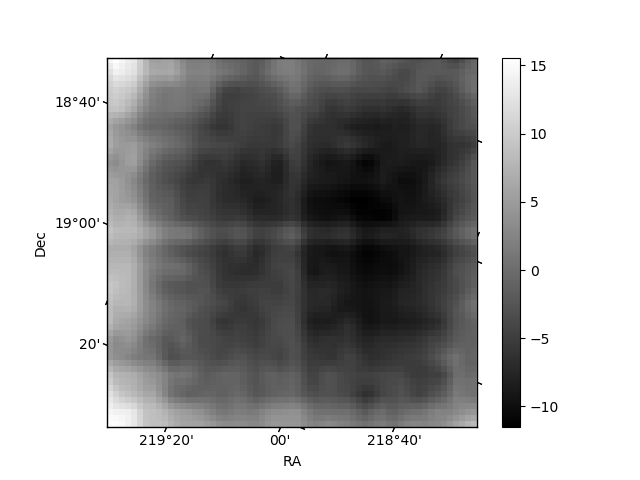
Quadrant B |
|---|---|---|---|
| Quadrant D | 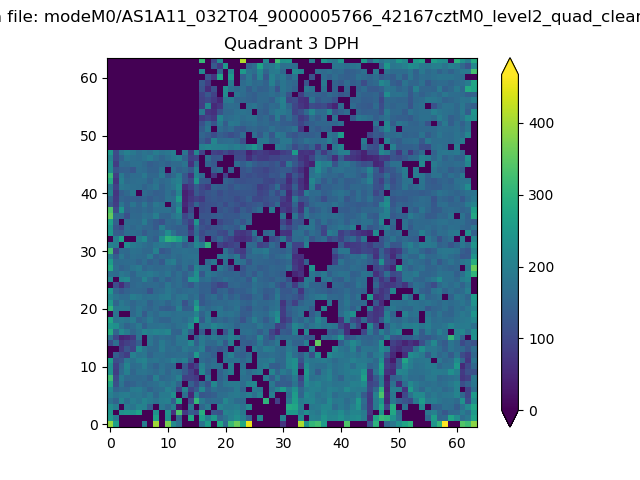 |
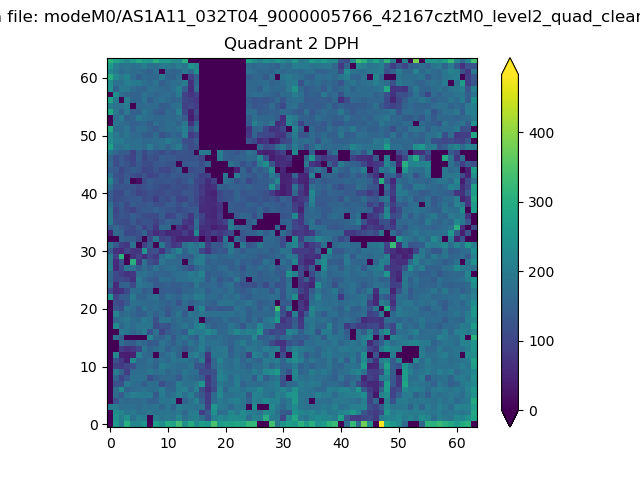 |
Quadrant C |
| Plot type | Count rate plots | Images |
|---|---|---|
| Comparison with Poisson distribution Blue bars denote a histogram of data divided into 1 sec bins. Red curve is a Poisson curve with rate = median count rate of data. |
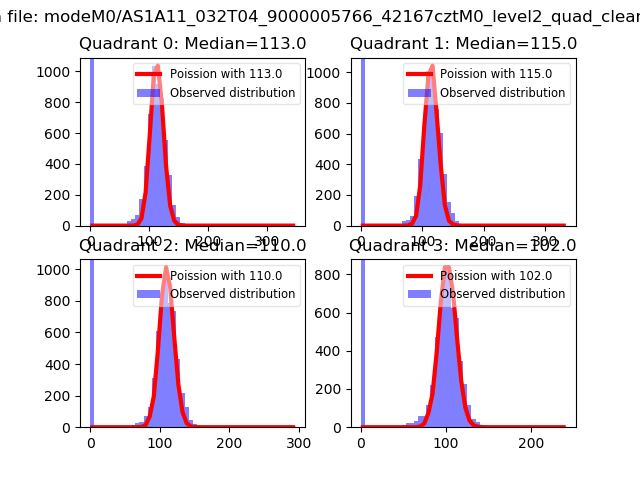 |
 |
| Quadrant-wise count rates Data is divided into 100 sec bins |
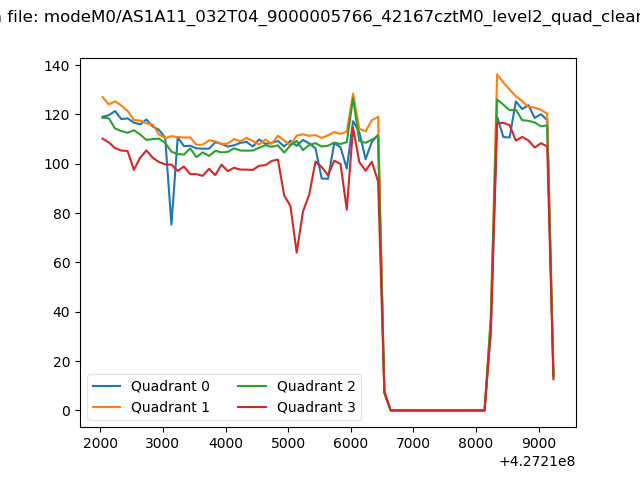 |
|
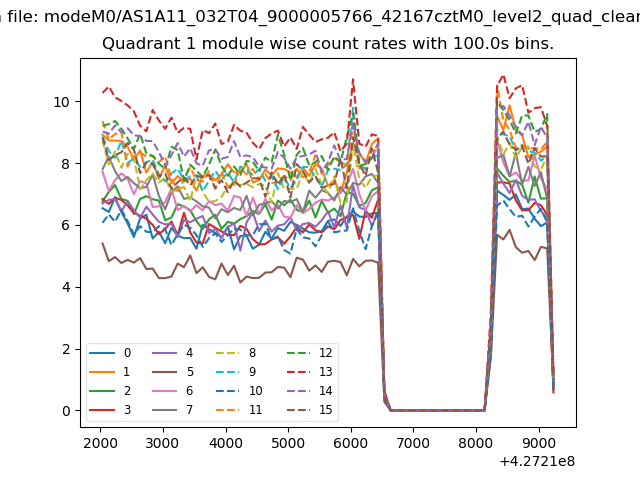
| Module-wise count rates for Quadrant A Data is divided into 100 sec bins |
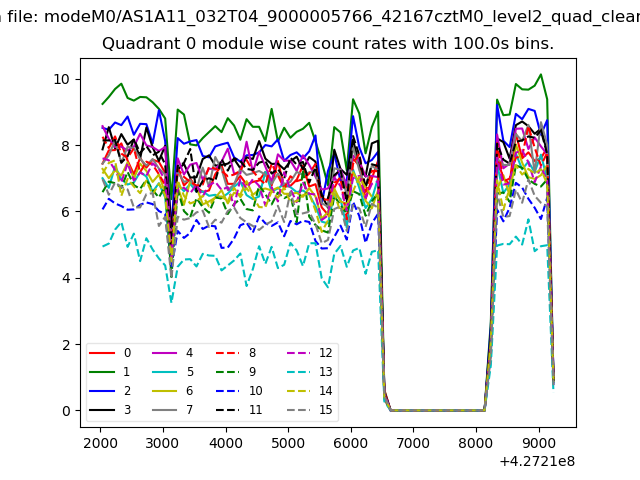 |
 |
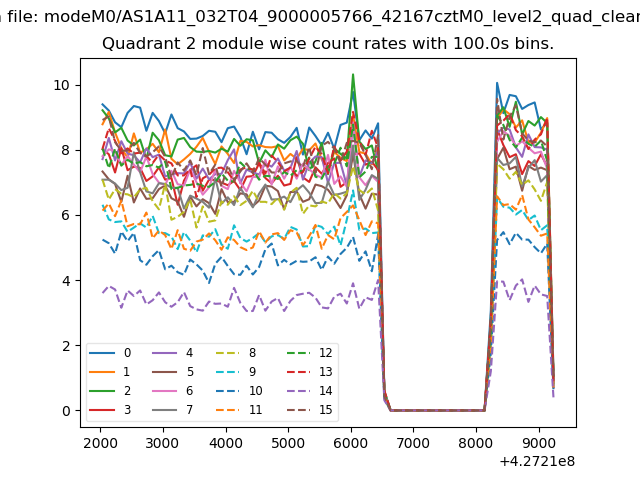
| Module-wise count rates for Quadrant B Data is divided into 100 sec bins |
 |
 |
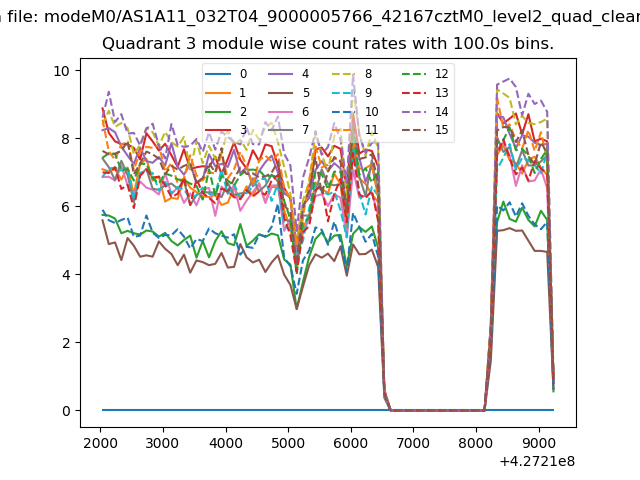
| Module-wise count rates for Quadrant C Data is divided into 100 sec bins |
 |
 |
| Module-wise count rates for Quadrant D Data is divided into 100 sec bins |
 |
 |
| Parameter | Plot |
|---|---|
| CZT HV Monitor | 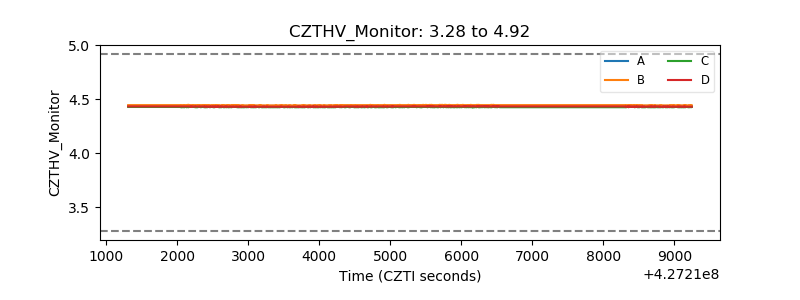 |
| D_VDD | 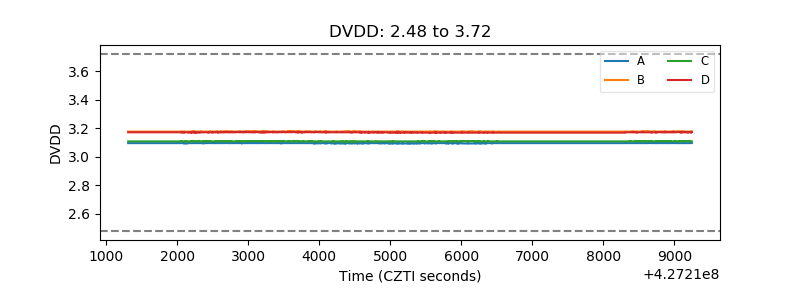 |
| Temperature 1 | 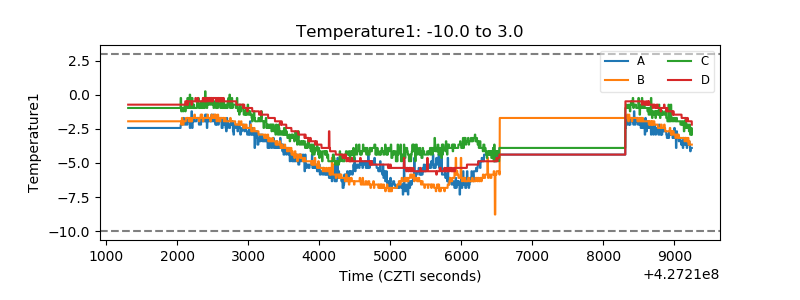 |
| Veto HV Monitor | 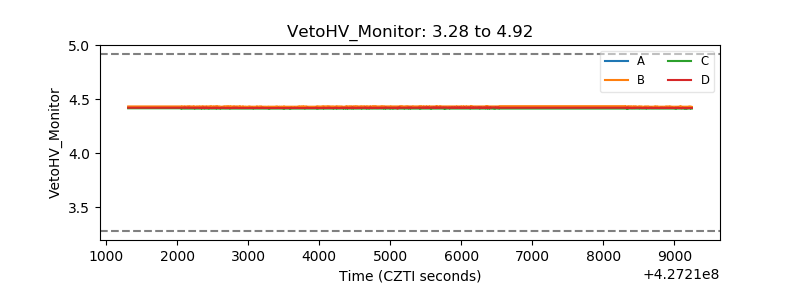 |
| Veto LLD | 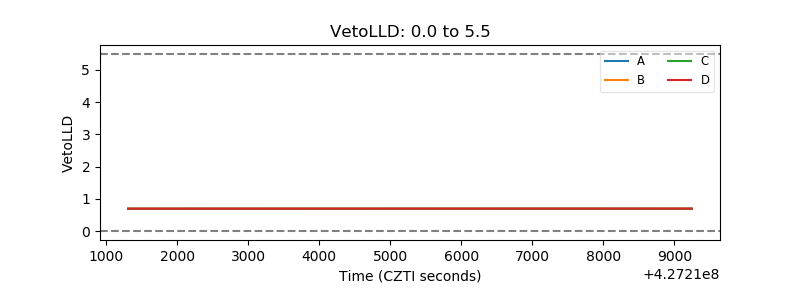 |
| Alpha Counter | 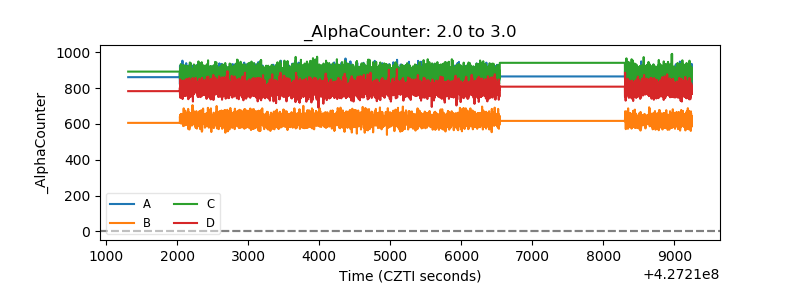 |
| _CPM_Rate |  |
| CZT Counter | 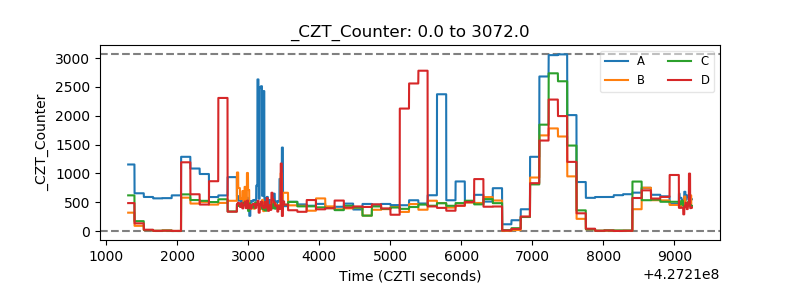 |
| +2.5 Volts monitor | 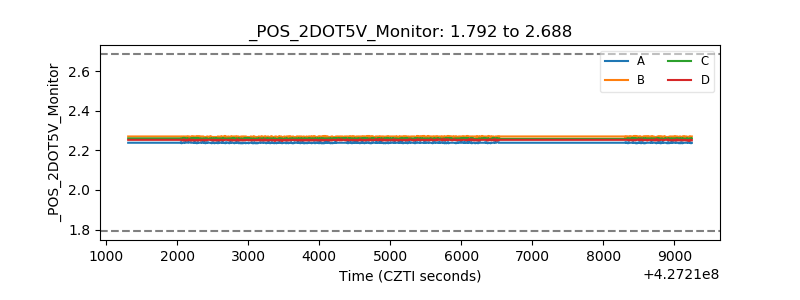 |
| +5 Volts monitor | 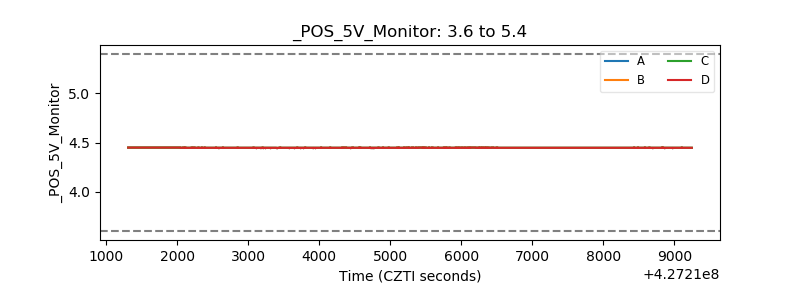 |
| _ROLL_ROT | 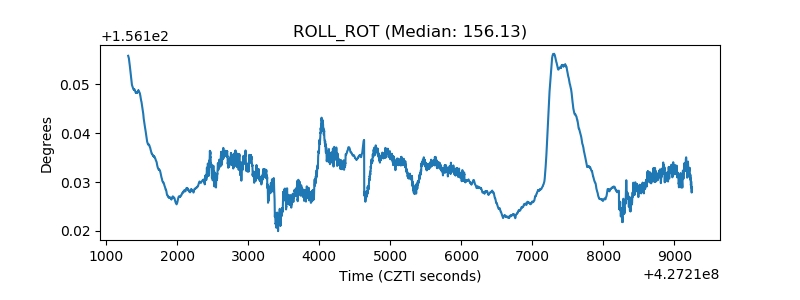 |
| _Roll_DEC | 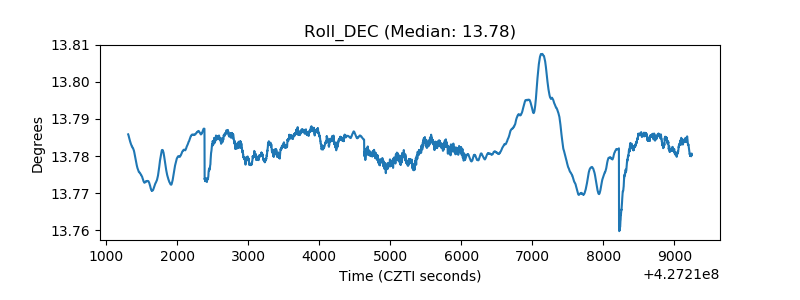 |
| _Roll_RA | 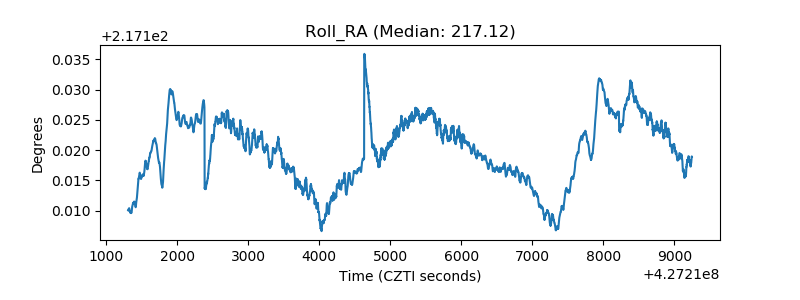 |
| Veto Counter | 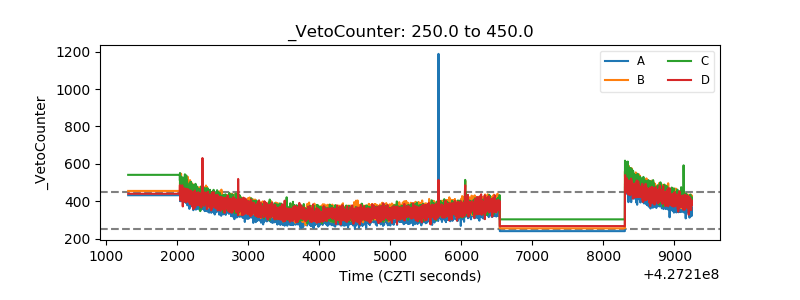 |