| Param | Original file | Final file |
|---|---|---|
| Filename | modeM0/AS1A11_032T04_9000005766_42168cztM0_level2.fits | modeM0/AS1A11_032T04_9000005766_42168cztM0_level2_quad_clean.evt |
| Size (bytes) | 326,295,360 | 89,930,880 |
| Size | 311.2 MB | 85.8 MB |
| Events in quadrant A | 3,630,010 | 592,238 |
| Events in quadrant B | 2,513,152 | 624,268 |
| Events in quadrant C | 2,464,031 | 595,039 |
| Events in quadrant D | 3,064,288 | 545,402 |
| Mode M0 | |||
|---|---|---|---|
| Quadrant | BADHDUFLAG | Total packets | Discarded packets |
| A | 0 | 14089 | 2 |
| B | 0 | 10966 | 2 |
| C | 0 | 10587 | 2 |
| D | 0 | 12811 | 2 |
| Mode M9 | |||
|---|---|---|---|
| Quadrant | BADHDUFLAG | Total packets | Discarded packets |
| A | 0 | 25 | 0 |
| B | 0 | 26 | 0 |
| C | 0 | 26 | 0 |
| D | 0 | 26 | 0 |
| Mode SS | |||
|---|---|---|---|
| Quadrant | BADHDUFLAG | Total packets | Discarded packets |
| A | 0 | 108 | 0 |
| B | 0 | 108 | 0 |
| C | 0 | 108 | 0 |
| D | 0 | 108 | 0 |
| Quadrant | Total seconds | Saturated seconds | Saturation percentage |
|---|---|---|---|
| A | 5220 | 191 | 3.659004% |
| B | 5220 | 10 | 0.191571% |
| C | 5220 | 3 | 0.057471% |
| D | 5220 | 137 | 2.624521% |
Noise dominated data is calculated using 1-second bins in cleaned event files. If a bin has >2000 counts, and if more than 50% of those come from <1% of pixels, then it is considered to be noise-dominated and hence unusable.
| Quadrant | # 1 sec bins | Bins with >0 counts | Bins with >2000 counts | High rate bins dominated by noise | Noise dominated (total time) | Noise dominated (detector-on time) | Marked lightcurve |
|---|---|---|---|---|---|---|---|
| A | 7131 | 5221 | 153 | 153 | 2.15% | 2.93% | 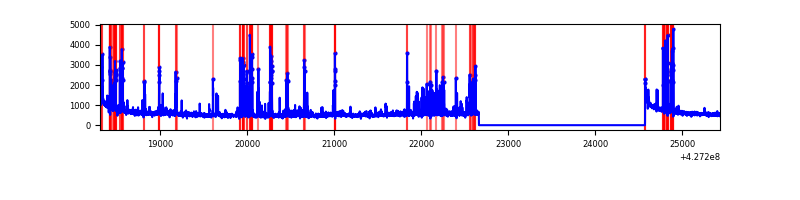 |
| B | 7131 | 5221 | 5 | 5 | 0.07% | 0.10% | 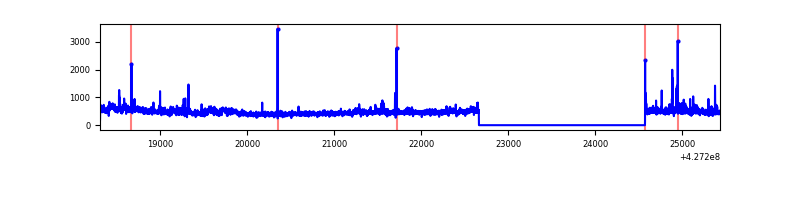 |
| C | 7131 | 5221 | 1 | 1 | 0.01% | 0.02% | 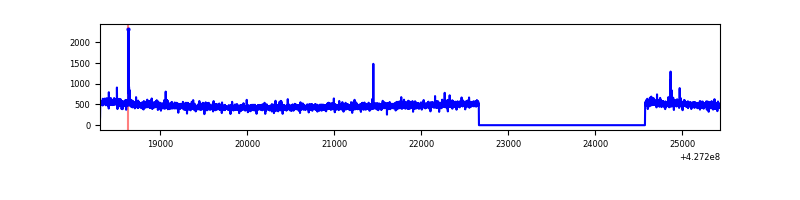 |
| D | 7131 | 5221 | 123 | 123 | 1.72% | 2.36% | 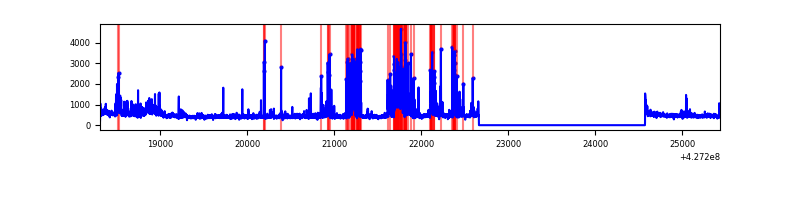 |
Top three noisy pixels from each quadrant. If the there are fewer than three noisy pixels in the level2.evt file, extra rows are filled as -1
| Pixel properties | Quadrant properties | ||||||
|---|---|---|---|---|---|---|---|
| Quadrant | DetID | PixID | Counts | Sigma | Mean | Median | Sigma |
| A | 15 | 222 | 785687 | 6645.77 | 573 | 563 | 118.1 |
| A | 10 | 83 | 554542 | 4689.22 | 573 | 563 | 118.1 |
| A | 12 | 189 | 47108 | 393.99 | 573 | 563 | 118.1 |
| B | 0 | 229 | 104385 | 922.48 | 580 | 564 | 112.5 |
| B | 0 | 156 | 102770 | 908.13 | 580 | 564 | 112.5 |
| B | 15 | 35 | 17789 | 153.05 | 580 | 564 | 112.5 |
| C | 15 | 214 | 217453 | 1617.54 | 570 | 573 | 134.1 |
| C | 15 | 159 | 21402 | 155.34 | 570 | 573 | 134.1 |
| C | 13 | 61 | 3844 | 24.39 | 570 | 573 | 134.1 |
| D | 12 | 6 | 597050 | 4326.61 | 564 | 548 | 137.9 |
| D | 1 | 52 | 174102 | 1258.84 | 564 | 548 | 137.9 |
| D | 2 | 249 | 37967 | 271.41 | 564 | 548 | 137.9 |
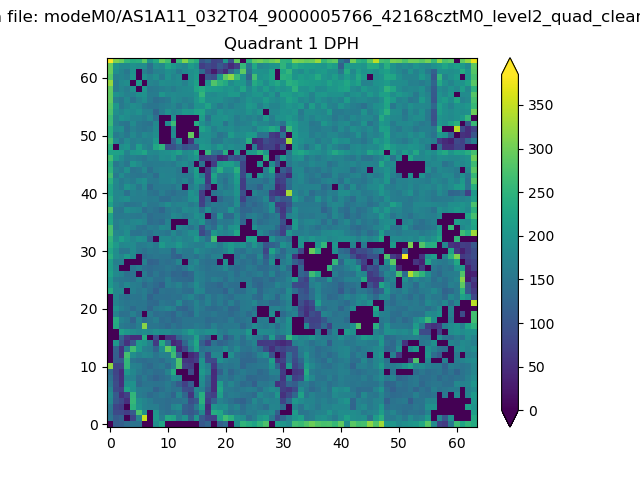
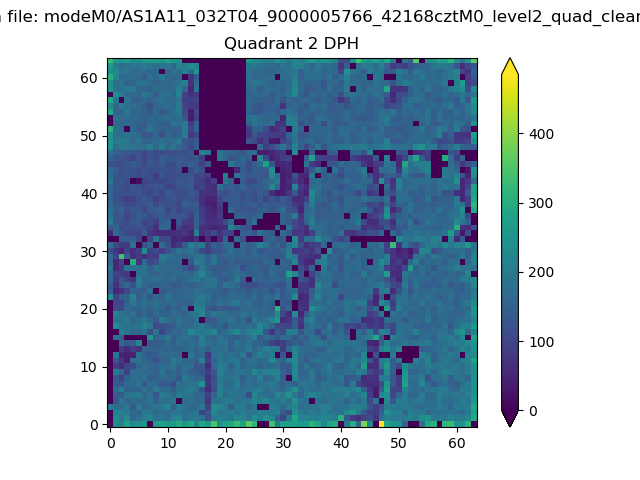
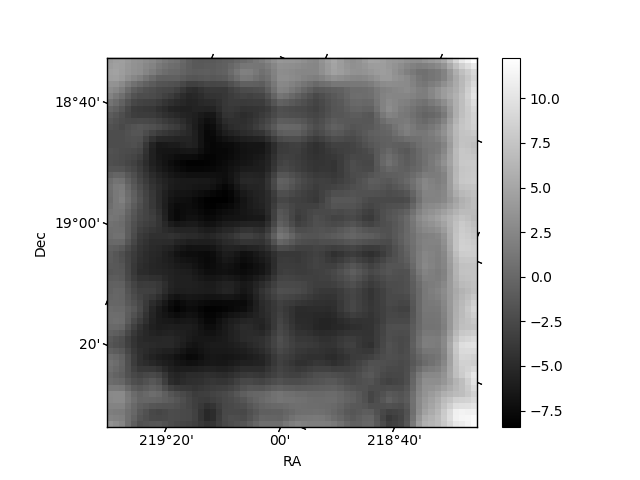
Histogram calculated using DETX and DETY for each event in the final _common_clean file
| Quadrant A |  |
 |
Quadrant B |
|---|---|---|---|
| Quadrant D | 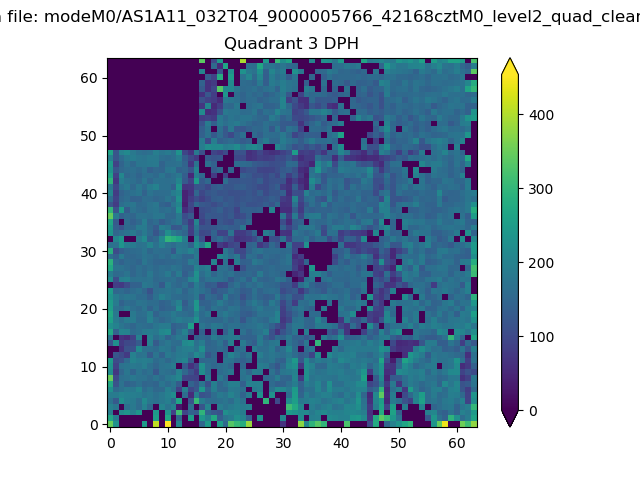 |
 |
Quadrant C |
| Plot type | Count rate plots | Images |
|---|---|---|
| Comparison with Poisson distribution Blue bars denote a histogram of data divided into 1 sec bins. Red curve is a Poisson curve with rate = median count rate of data. |
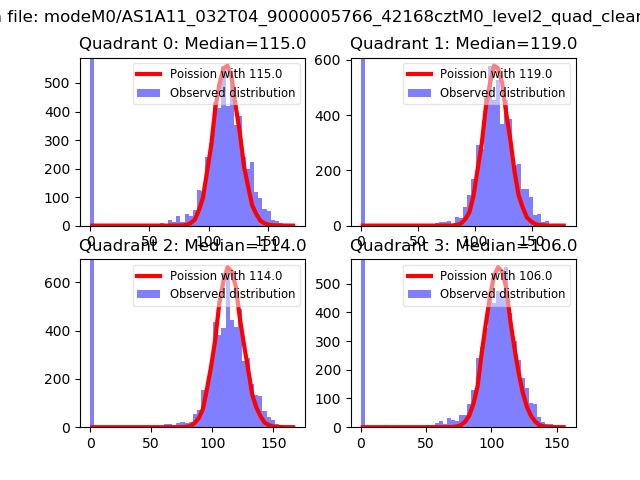 |
 |
| Quadrant-wise count rates Data is divided into 100 sec bins |
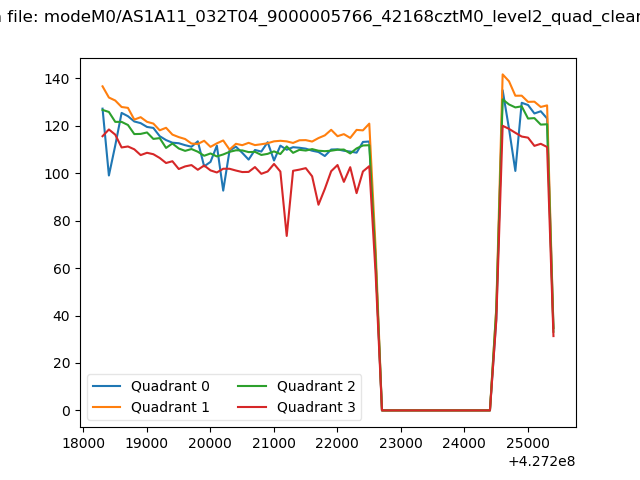 |
|
| Module-wise count rates for Quadrant A Data is divided into 100 sec bins |
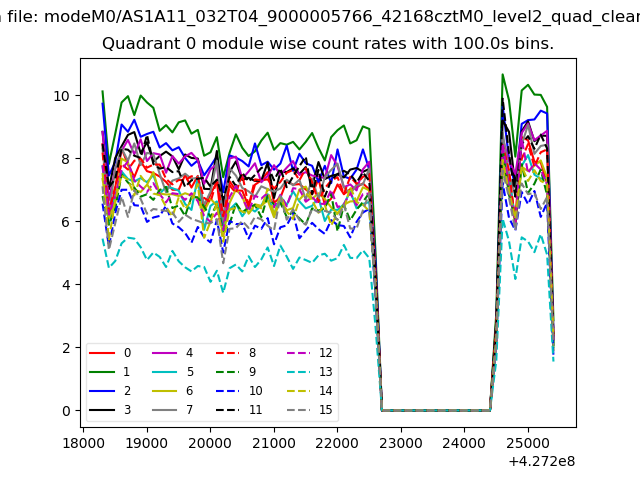 |
 |
| Module-wise count rates for Quadrant B Data is divided into 100 sec bins |
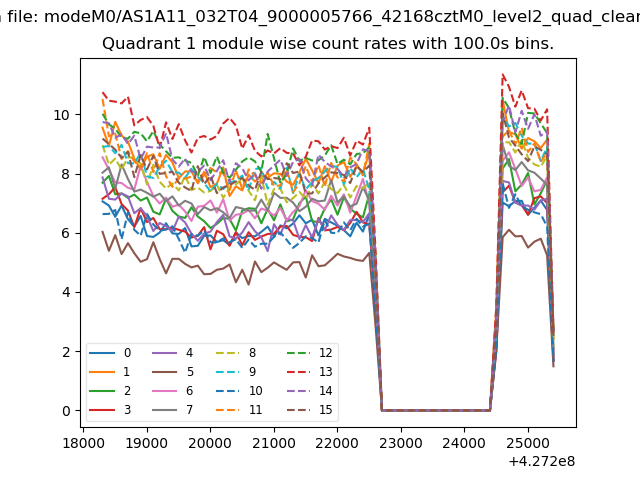 |
 |
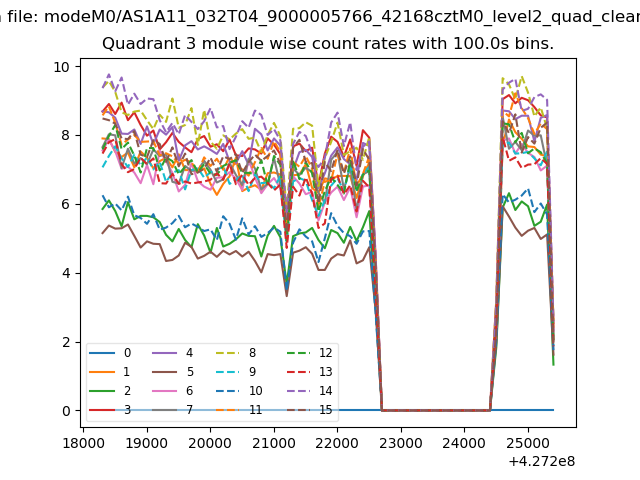
| Module-wise count rates for Quadrant C Data is divided into 100 sec bins |
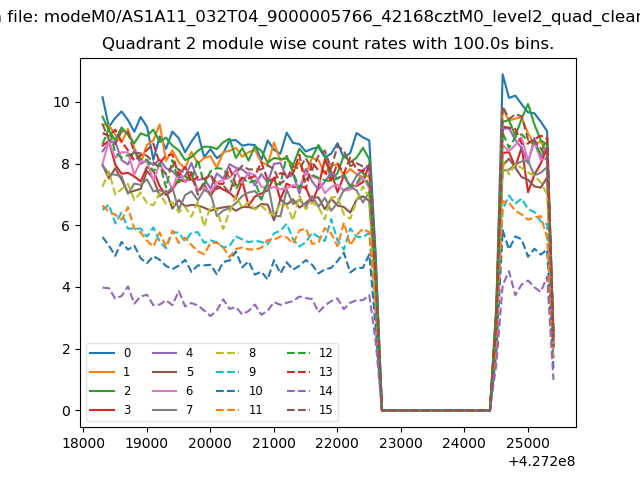 |
 |
| Module-wise count rates for Quadrant D Data is divided into 100 sec bins |
 |
 |
| Parameter | Plot |
|---|---|
| CZT HV Monitor | 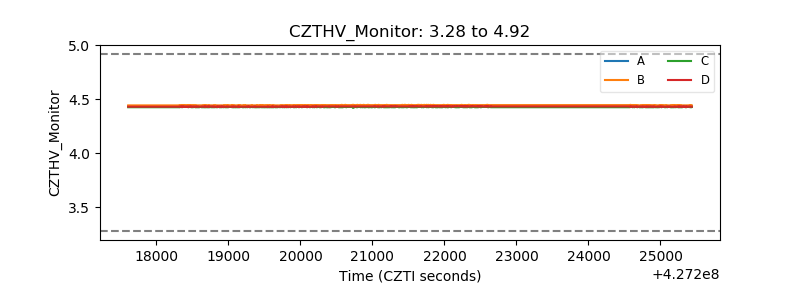 |
| D_VDD | 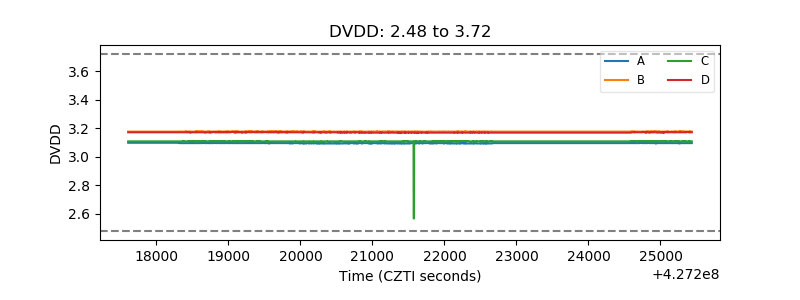 |
| Temperature 1 | 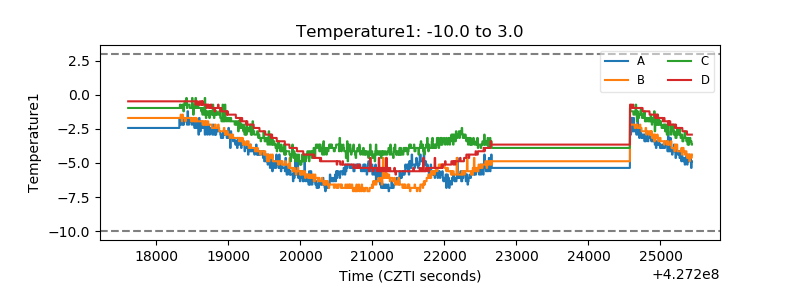 |
| Veto HV Monitor | 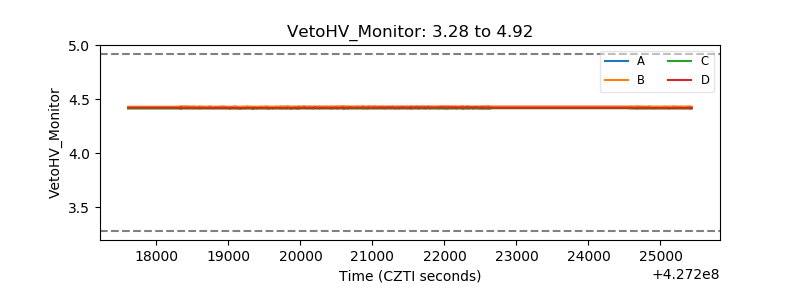 |
| Veto LLD | 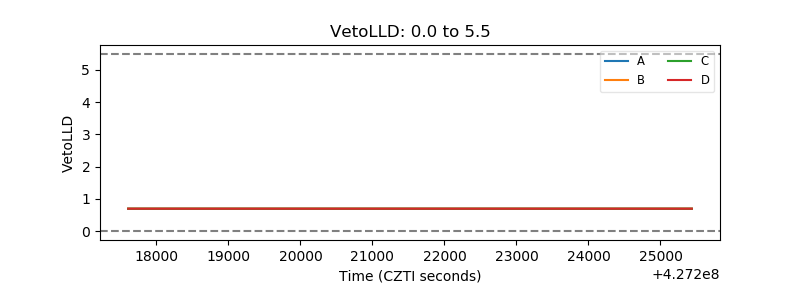 |
| Alpha Counter | 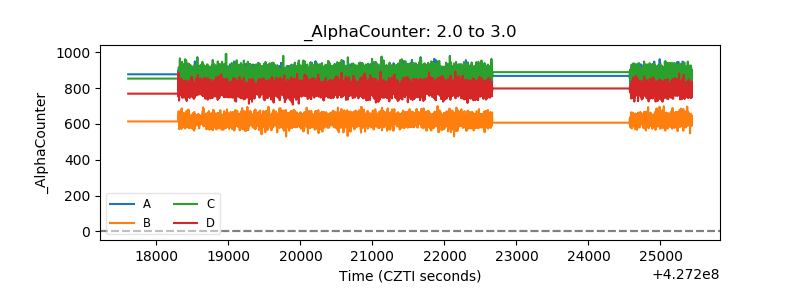 |
| _CPM_Rate | 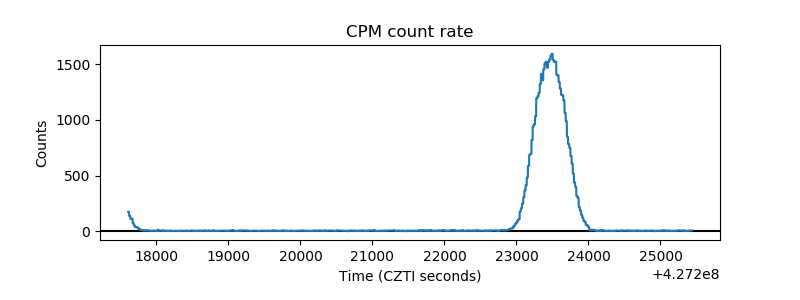 |
| CZT Counter | 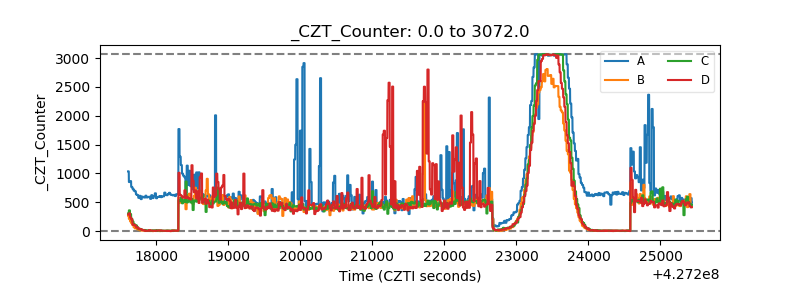 |
| +2.5 Volts monitor | 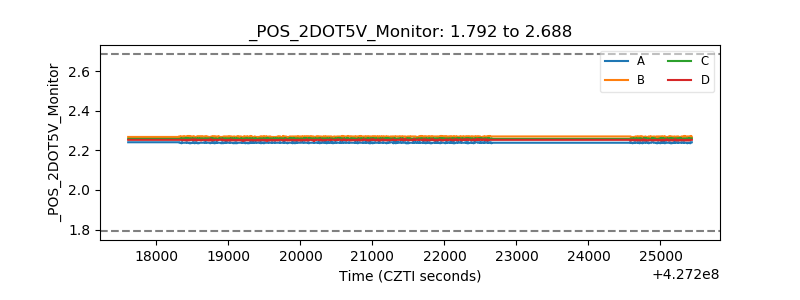 |
| +5 Volts monitor | 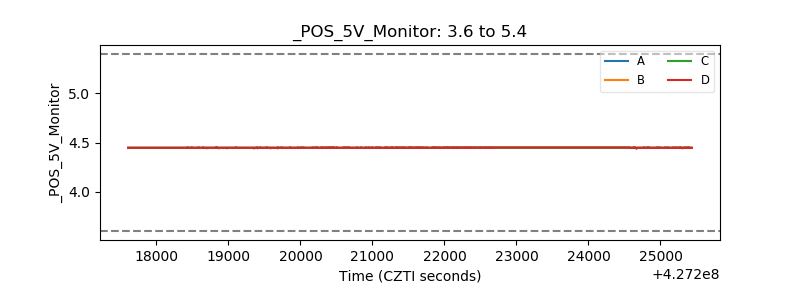 |
| _ROLL_ROT | 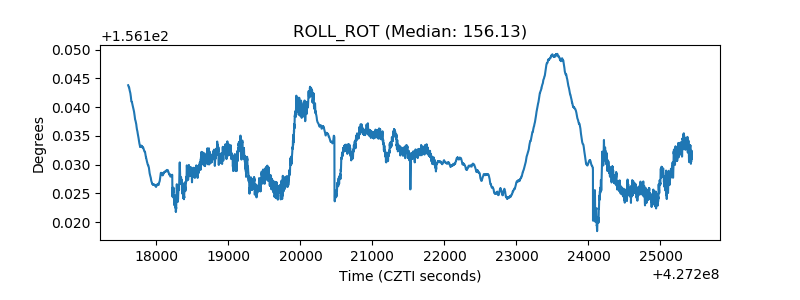 |
| _Roll_DEC | 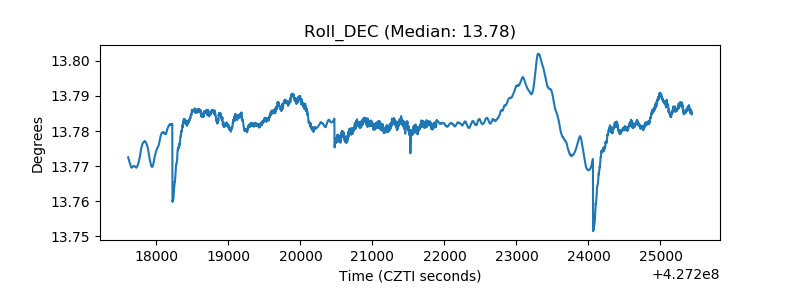 |
| _Roll_RA |  |
| Veto Counter | 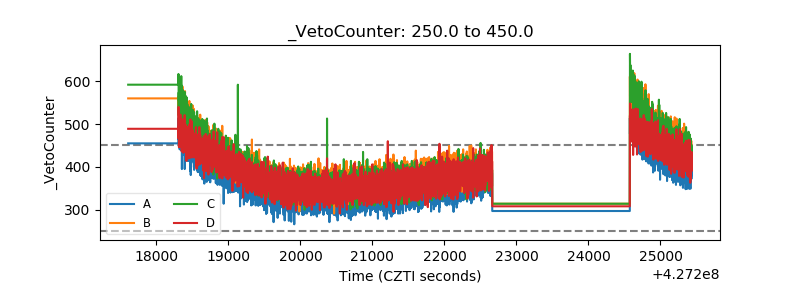 |