| Param | Original file | Final file |
|---|---|---|
| Filename | modeM0/AS1A11_032T04_9000005766_42169cztM0_level2.fits | modeM0/AS1A11_032T04_9000005766_42169cztM0_level2_quad_clean.evt |
| Size (bytes) | 284,342,400 | 87,773,760 |
| Size | 271.2 MB | 83.7 MB |
| Events in quadrant A | 2,924,935 | 587,497 |
| Events in quadrant B | 2,334,932 | 611,628 |
| Events in quadrant C | 2,374,436 | 579,293 |
| Events in quadrant D | 2,504,029 | 531,402 |
| Mode M0 | |||
|---|---|---|---|
| Quadrant | BADHDUFLAG | Total packets | Discarded packets |
| A | 0 | 11643 | 2 |
| B | 0 | 10218 | 2 |
| C | 0 | 10045 | 2 |
| D | 0 | 10953 | 2 |
| Mode M9 | |||
|---|---|---|---|
| Quadrant | BADHDUFLAG | Total packets | Discarded packets |
| A | 0 | 26 | 0 |
| B | 0 | 26 | 0 |
| C | 0 | 27 | 0 |
| D | 0 | 27 | 0 |
| Mode SS | |||
|---|---|---|---|
| Quadrant | BADHDUFLAG | Total packets | Discarded packets |
| A | 0 | 102 | 0 |
| B | 0 | 102 | 0 |
| C | 0 | 102 | 0 |
| D | 0 | 102 | 0 |
| Quadrant | Total seconds | Saturated seconds | Saturation percentage |
|---|---|---|---|
| A | 4962 | 56 | 1.128577% |
| B | 4962 | 10 | 0.201532% |
| C | 4962 | 2 | 0.040306% |
| D | 4962 | 42 | 0.846433% |
Noise dominated data is calculated using 1-second bins in cleaned event files. If a bin has >2000 counts, and if more than 50% of those come from <1% of pixels, then it is considered to be noise-dominated and hence unusable.
| Quadrant | # 1 sec bins | Bins with >0 counts | Bins with >2000 counts | High rate bins dominated by noise | Noise dominated (total time) | Noise dominated (detector-on time) | Marked lightcurve |
|---|---|---|---|---|---|---|---|
| A | 6995 | 4963 | 46 | 46 | 0.66% | 0.93% | 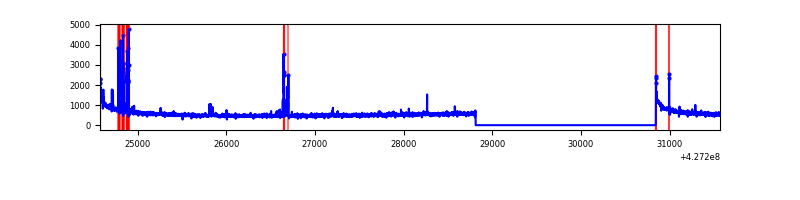 |
| B | 6995 | 4963 | 3 | 3 | 0.04% | 0.06% | 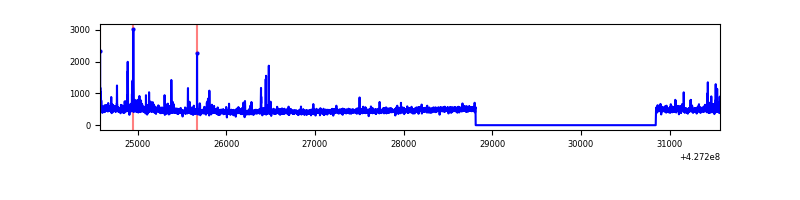 |
| C | 6995 | 4963 | 0 | 0 | 0.00% | 0.00% | 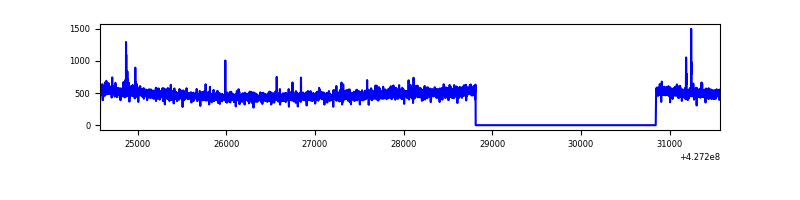 |
| D | 6994 | 4962 | 33 | 33 | 0.47% | 0.67% | 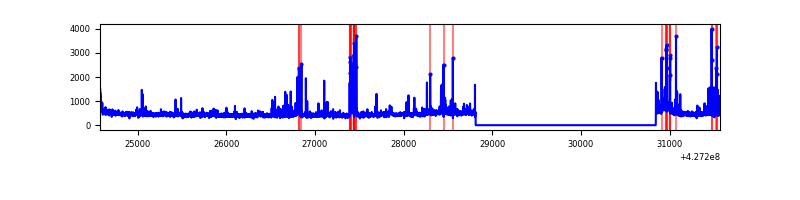 |
Top three noisy pixels from each quadrant. If the there are fewer than three noisy pixels in the level2.evt file, extra rows are filled as -1
| Pixel properties | Quadrant properties | ||||||
|---|---|---|---|---|---|---|---|
| Quadrant | DetID | PixID | Counts | Sigma | Mean | Median | Sigma |
| A | 10 | 83 | 530135 | 4527.66 | 557 | 546 | 117.0 |
| A | 15 | 222 | 179145 | 1526.91 | 557 | 546 | 117.0 |
| A | 12 | 189 | 30230 | 253.78 | 557 | 546 | 117.0 |
| B | 0 | 229 | 99185 | 910.49 | 562 | 547 | 108.3 |
| B | 15 | 35 | 25404 | 229.45 | 562 | 547 | 108.3 |
| B | 12 | 111 | 13451 | 119.11 | 562 | 547 | 108.3 |
| C | 15 | 214 | 207822 | 1606.14 | 550 | 554 | 129.0 |
| C | 15 | 159 | 17576 | 131.91 | 550 | 554 | 129.0 |
| C | 0 | 207 | 4132 | 27.73 | 550 | 554 | 129.0 |
| D | 1 | 52 | 175635 | 1325.99 | 543 | 527 | 132.1 |
| D | 12 | 6 | 120592 | 909.18 | 543 | 527 | 132.1 |
| D | 5 | 70 | 31658 | 235.74 | 543 | 527 | 132.1 |
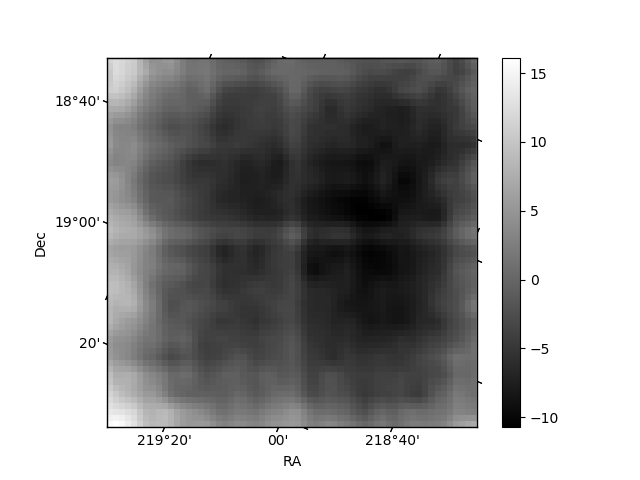
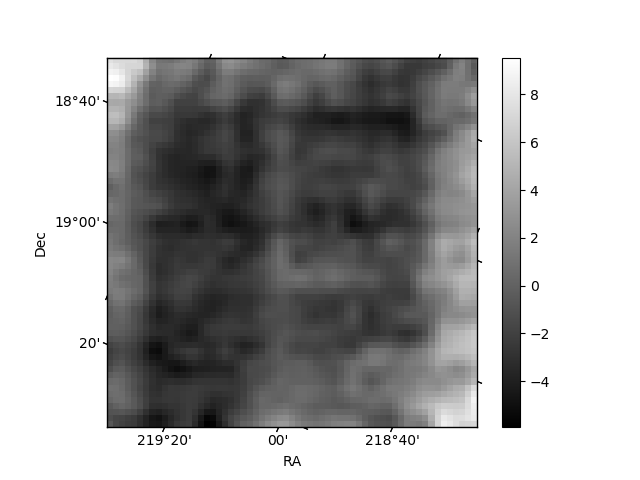
Histogram calculated using DETX and DETY for each event in the final _common_clean file
| Quadrant A | 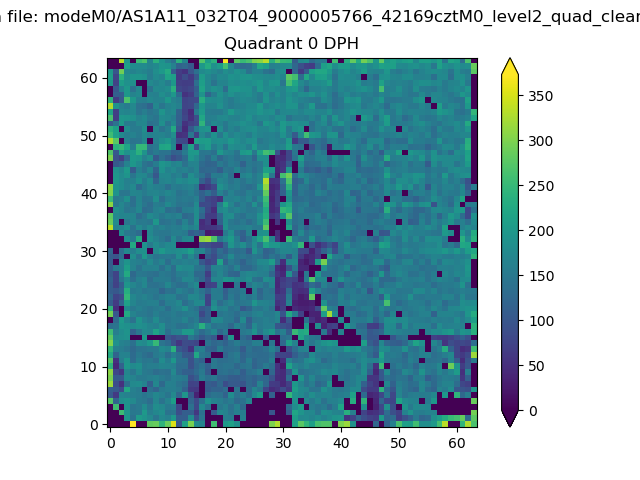 |
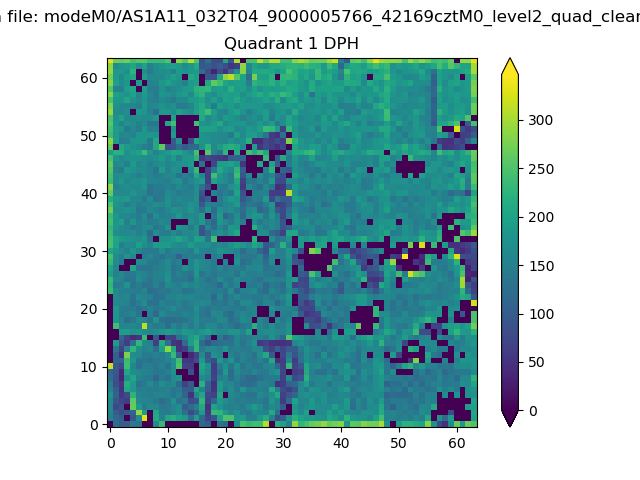 |
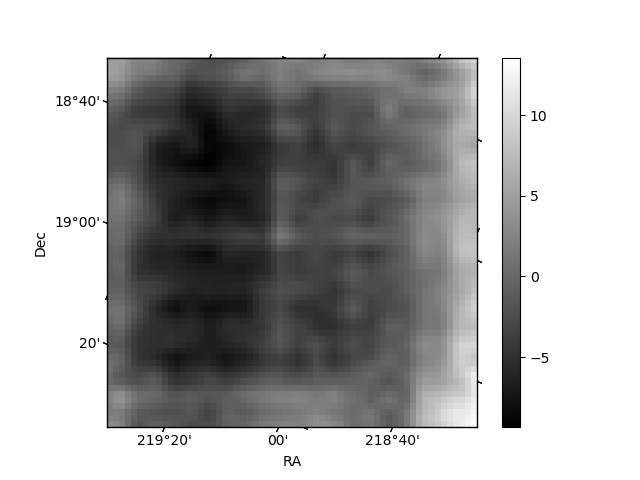
Quadrant B |
|---|---|---|---|
| Quadrant D | 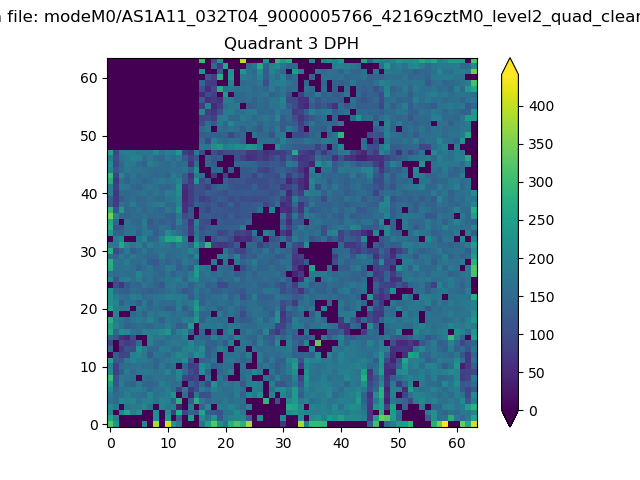 |
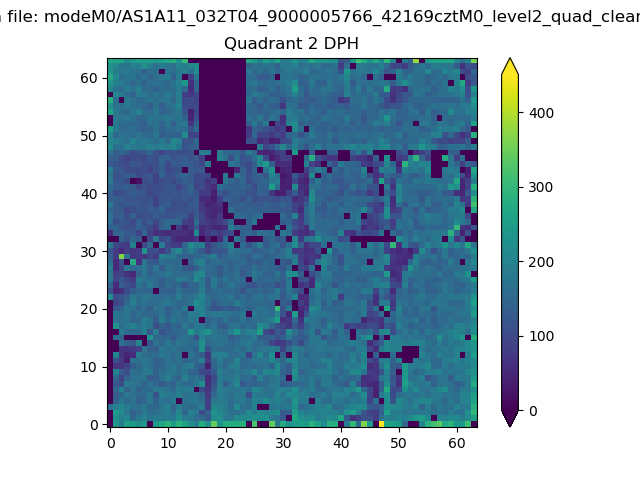 |
Quadrant C |
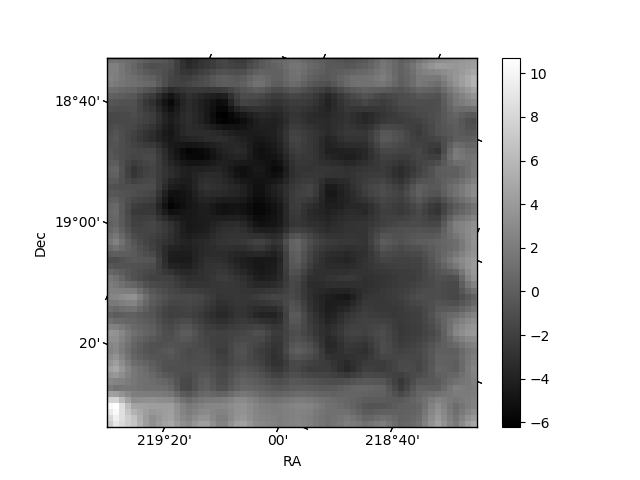
| Plot type | Count rate plots | Images |
|---|---|---|
| Comparison with Poisson distribution Blue bars denote a histogram of data divided into 1 sec bins. Red curve is a Poisson curve with rate = median count rate of data. |
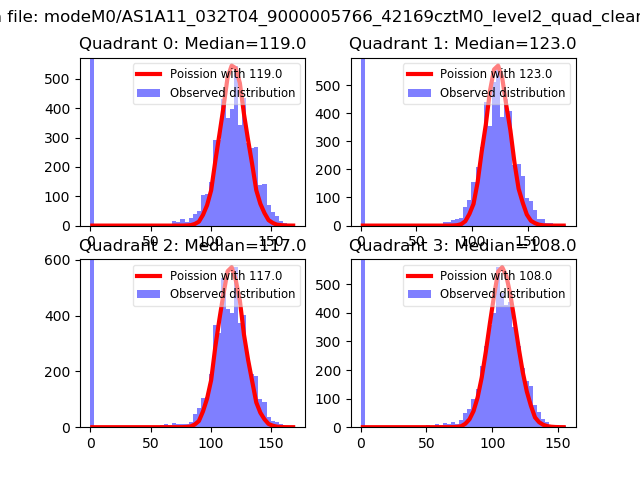 |
 |
| Quadrant-wise count rates Data is divided into 100 sec bins |
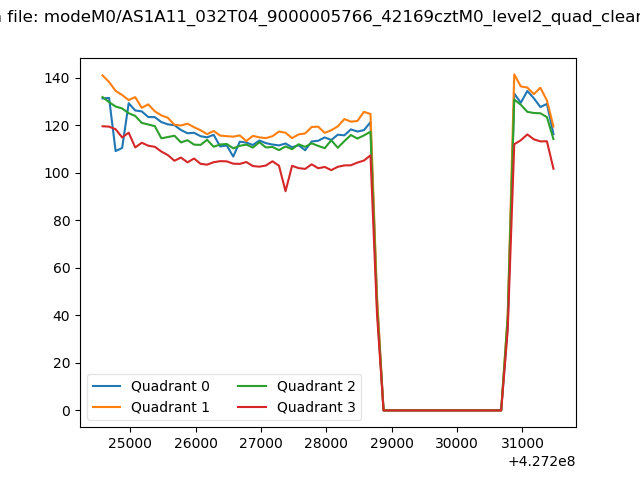 |
|
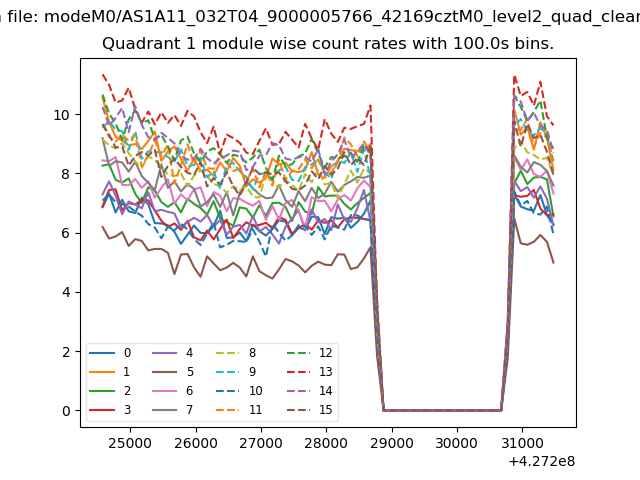
| Module-wise count rates for Quadrant A Data is divided into 100 sec bins |
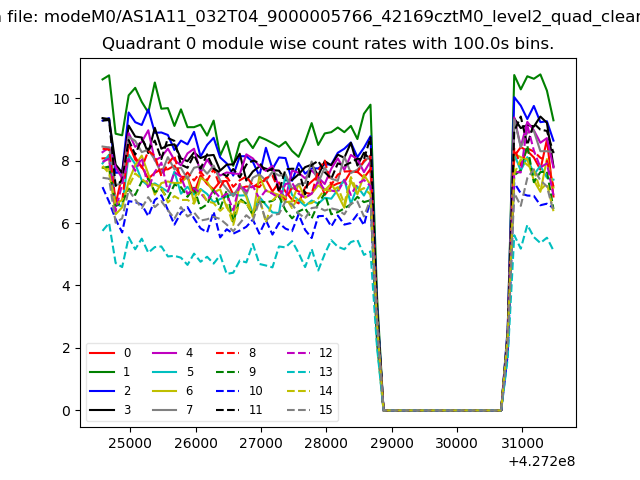 |
 |
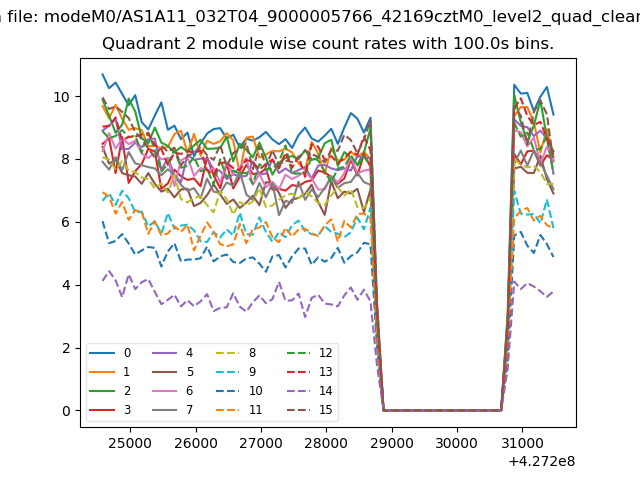
| Module-wise count rates for Quadrant B Data is divided into 100 sec bins |
 |
 |
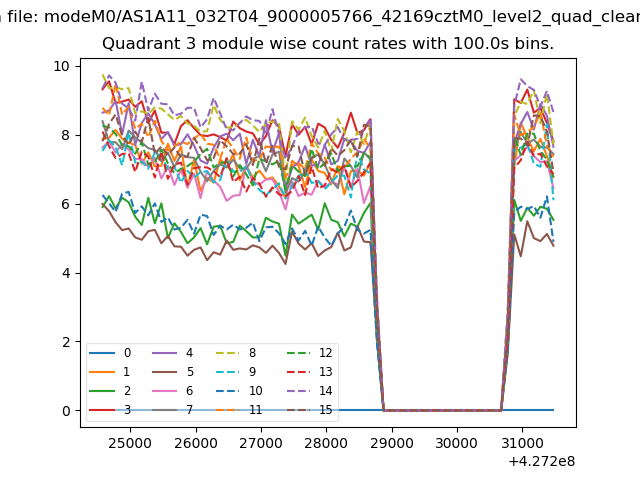
| Module-wise count rates for Quadrant C Data is divided into 100 sec bins |
 |
 |
| Module-wise count rates for Quadrant D Data is divided into 100 sec bins |
 |
 |
| Parameter | Plot |
|---|---|
| CZT HV Monitor | 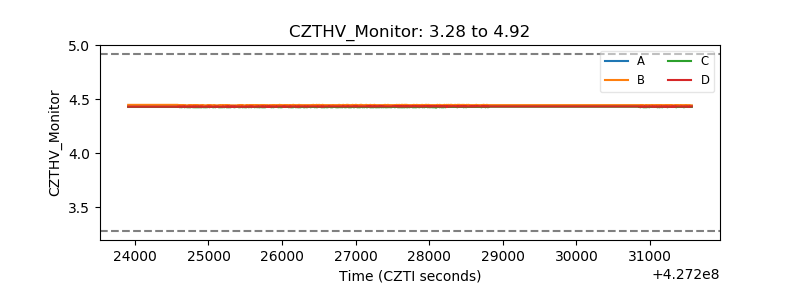 |
| D_VDD | 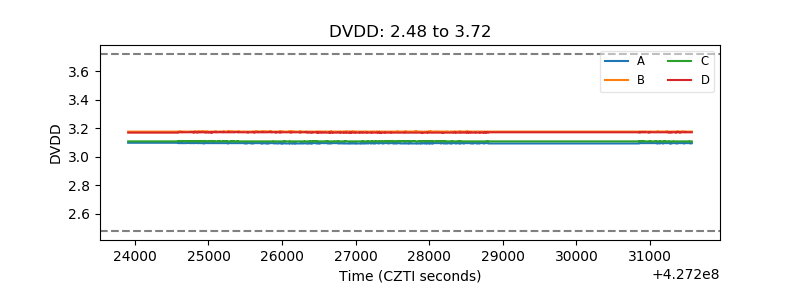 |
| Temperature 1 | 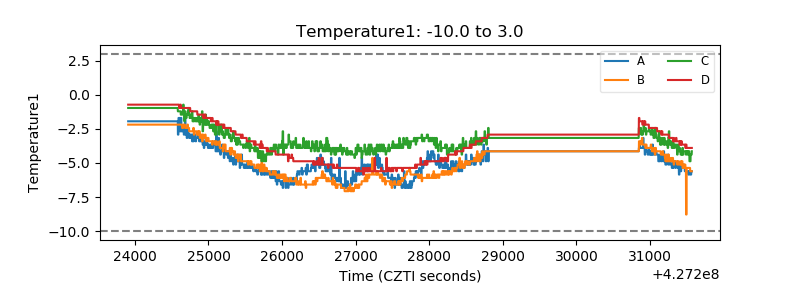 |
| Veto HV Monitor | 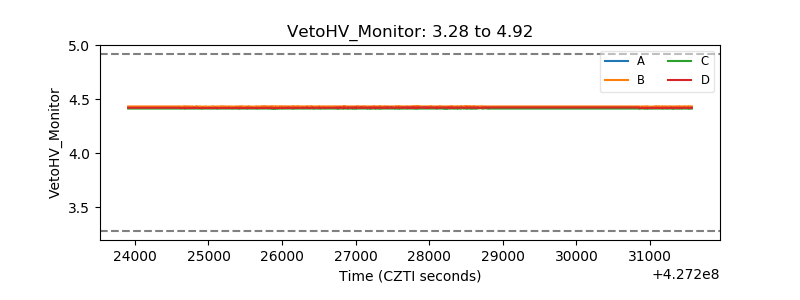 |
| Veto LLD | 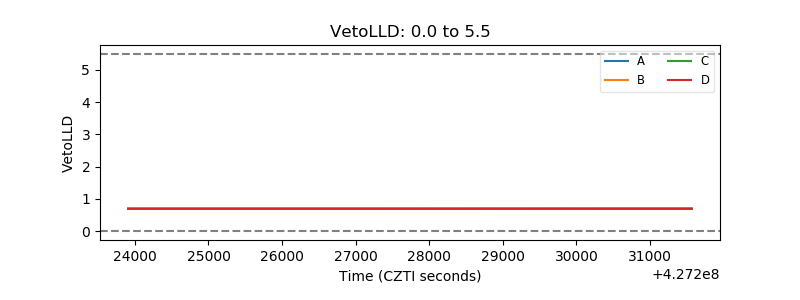 |
| Alpha Counter | 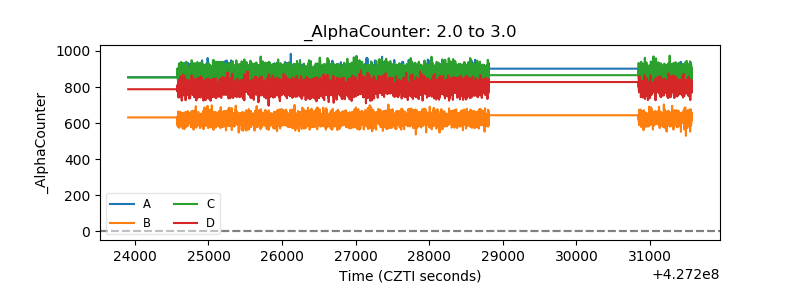 |
| _CPM_Rate | 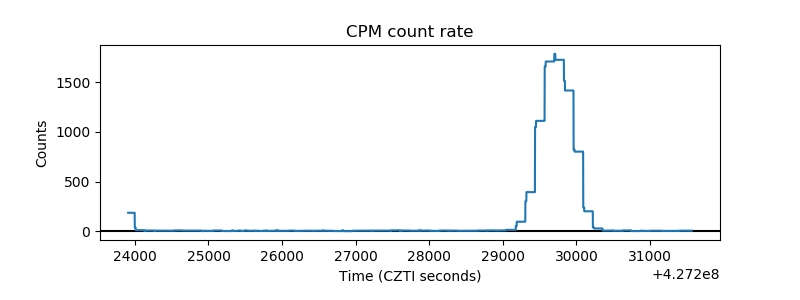 |
| CZT Counter | 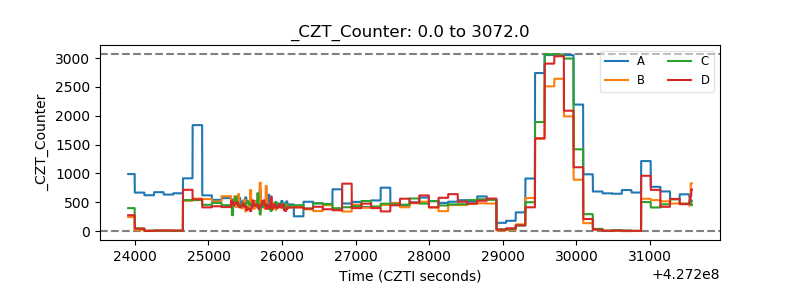 |
| +2.5 Volts monitor | 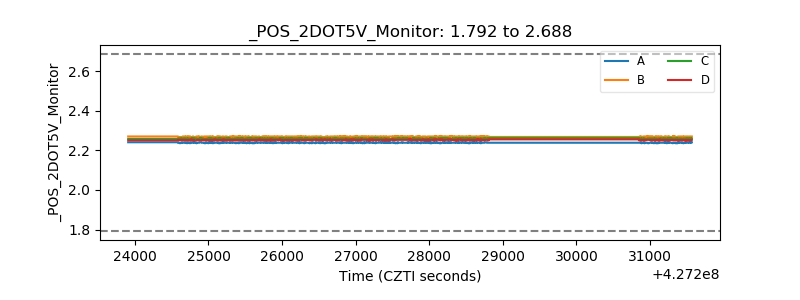 |
| +5 Volts monitor | 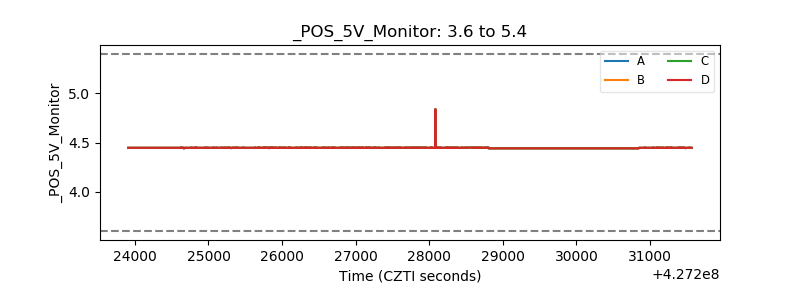 |
| _ROLL_ROT | 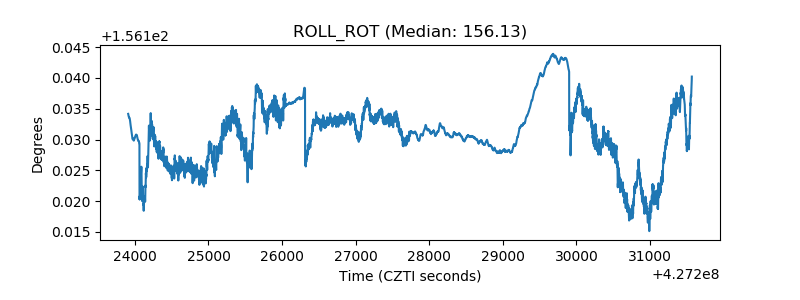 |
| _Roll_DEC | 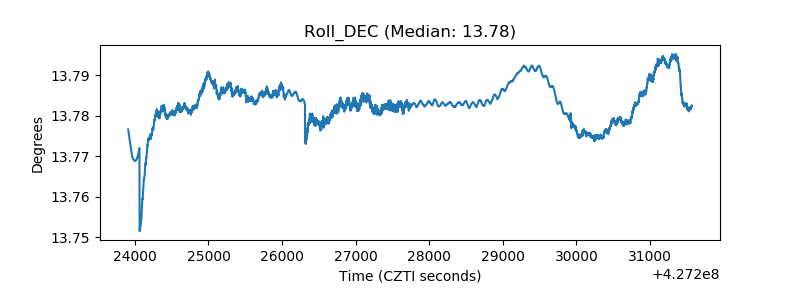 |
| _Roll_RA |  |
| Veto Counter | 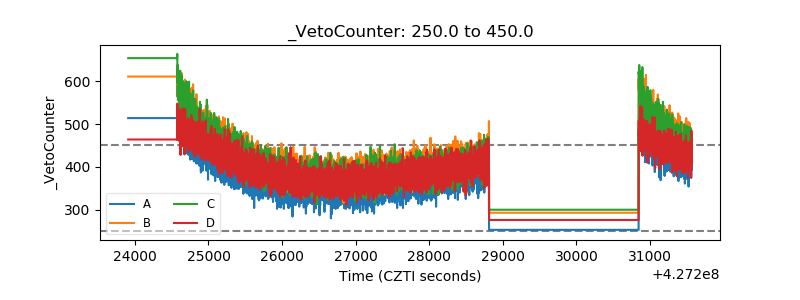 |