| Param | Original file | Final file |
|---|---|---|
| Filename | modeM0/AS1A11_032T04_9000005766_42170cztM0_level2.fits | modeM0/AS1A11_032T04_9000005766_42170cztM0_level2_quad_clean.evt |
| Size (bytes) | 285,105,600 | 85,443,840 |
| Size | 271.9 MB | 81.5 MB |
| Events in quadrant A | 2,813,864 | 575,570 |
| Events in quadrant B | 2,293,742 | 598,623 |
| Events in quadrant C | 2,305,359 | 564,246 |
| Events in quadrant D | 2,763,148 | 509,343 |
| Mode M0 | |||
|---|---|---|---|
| Quadrant | BADHDUFLAG | Total packets | Discarded packets |
| A | 0 | 11238 | 2 |
| B | 0 | 9987 | 2 |
| C | 0 | 9771 | 2 |
| D | 0 | 11639 | 2 |
| Mode M9 | |||
|---|---|---|---|
| Quadrant | BADHDUFLAG | Total packets | Discarded packets |
| A | 0 | 35 | 0 |
| B | 0 | 36 | 0 |
| C | 0 | 36 | 0 |
| D | 0 | 36 | 0 |
| Mode SS | |||
|---|---|---|---|
| Quadrant | BADHDUFLAG | Total packets | Discarded packets |
| A | 0 | 98 | 0 |
| B | 0 | 98 | 0 |
| C | 0 | 98 | 0 |
| D | 0 | 98 | 0 |
| Quadrant | Total seconds | Saturated seconds | Saturation percentage |
|---|---|---|---|
| A | 4840 | 38 | 0.785124% |
| B | 4840 | 10 | 0.206612% |
| C | 4840 | 4 | 0.082645% |
| D | 4840 | 116 | 2.396694% |
Noise dominated data is calculated using 1-second bins in cleaned event files. If a bin has >2000 counts, and if more than 50% of those come from <1% of pixels, then it is considered to be noise-dominated and hence unusable.
| Quadrant | # 1 sec bins | Bins with >0 counts | Bins with >2000 counts | High rate bins dominated by noise | Noise dominated (total time) | Noise dominated (detector-on time) | Marked lightcurve |
|---|---|---|---|---|---|---|---|
| A | 6932 | 4841 | 34 | 34 | 0.49% | 0.70% | 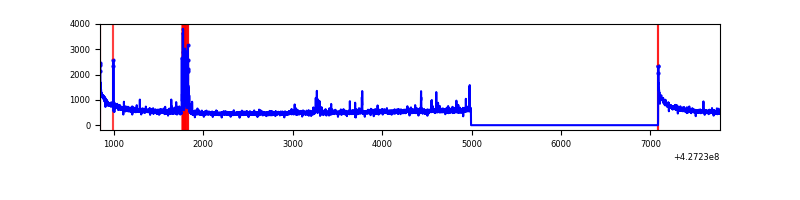 |
| B | 6932 | 4841 | 3 | 3 | 0.04% | 0.06% | 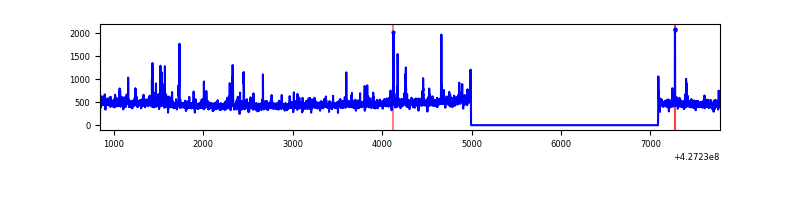 |
| C | 6932 | 4841 | 0 | 0 | 0.00% | 0.00% | 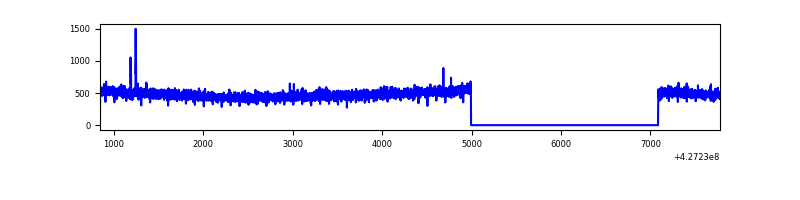 |
| D | 6932 | 4841 | 95 | 95 | 1.37% | 1.96% | 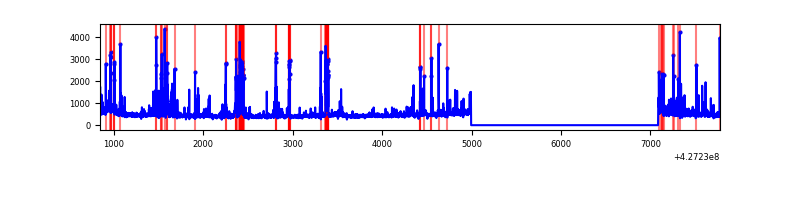 |
Top three noisy pixels from each quadrant. If the there are fewer than three noisy pixels in the level2.evt file, extra rows are filled as -1
| Pixel properties | Quadrant properties | ||||||
|---|---|---|---|---|---|---|---|
| Quadrant | DetID | PixID | Counts | Sigma | Mean | Median | Sigma |
| A | 10 | 83 | 504242 | 4461.21 | 548 | 536 | 112.9 |
| A | 13 | 248 | 102505 | 903.12 | 548 | 536 | 112.9 |
| A | 12 | 189 | 51575 | 452.04 | 548 | 536 | 112.9 |
| B | 0 | 229 | 115198 | 1085.99 | 549 | 536 | 105.6 |
| B | 12 | 111 | 13120 | 119.19 | 549 | 536 | 105.6 |
| B | 5 | 255 | 12800 | 116.16 | 549 | 536 | 105.6 |
| C | 15 | 214 | 204065 | 1621.06 | 536 | 539 | 125.6 |
| C | 15 | 159 | 8584 | 64.08 | 536 | 539 | 125.6 |
| C | 0 | 207 | 3930 | 27.01 | 536 | 539 | 125.6 |
| D | 1 | 52 | 312995 | 2443.72 | 526 | 513 | 127.9 |
| D | 12 | 6 | 215959 | 1684.86 | 526 | 513 | 127.9 |
| D | 13 | 249 | 44548 | 344.37 | 526 | 513 | 127.9 |
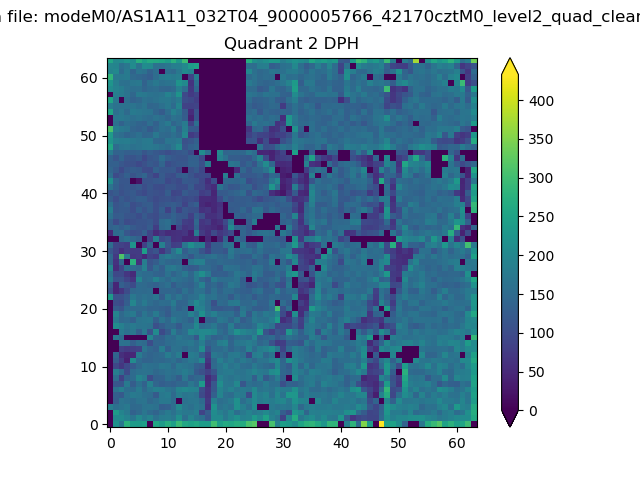
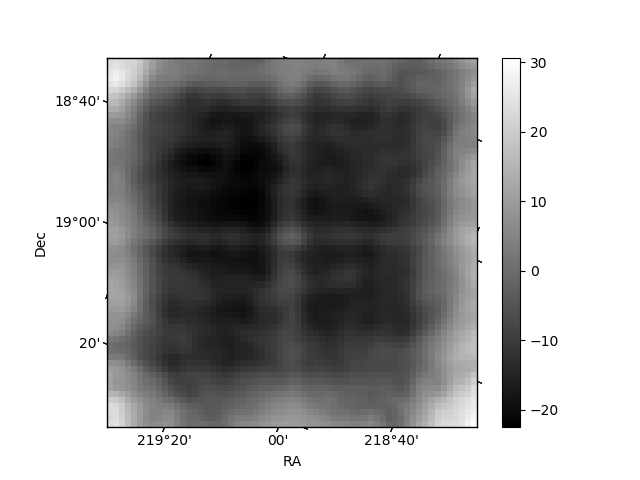
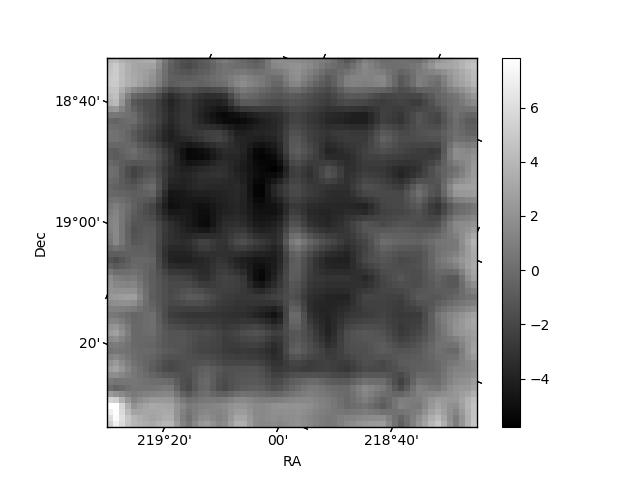
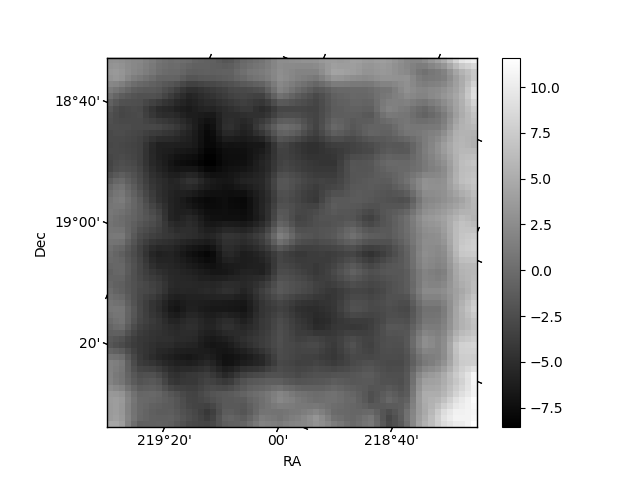
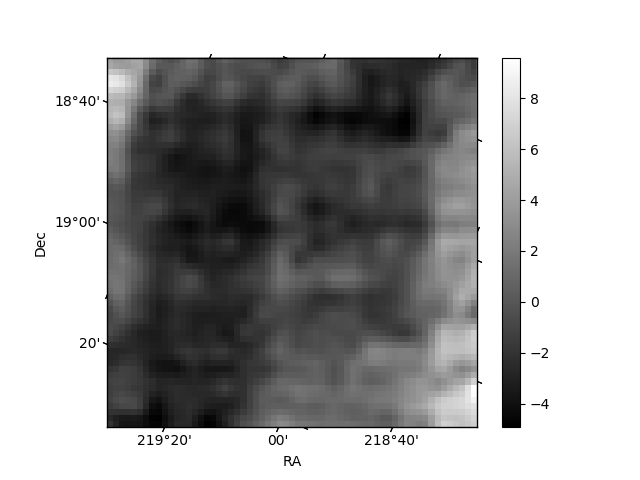
Histogram calculated using DETX and DETY for each event in the final _common_clean file
| Quadrant A | 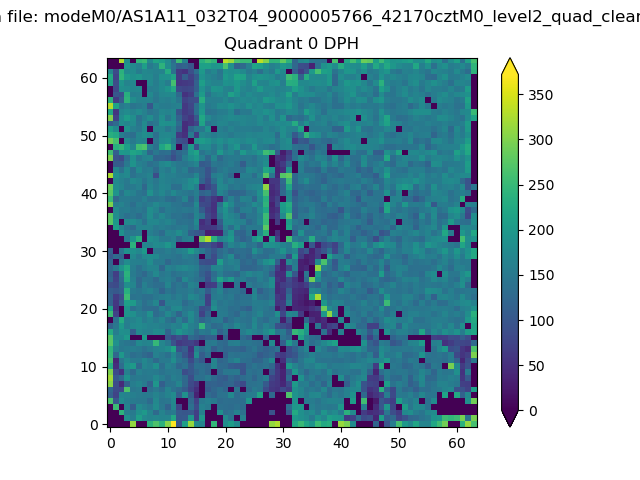 |
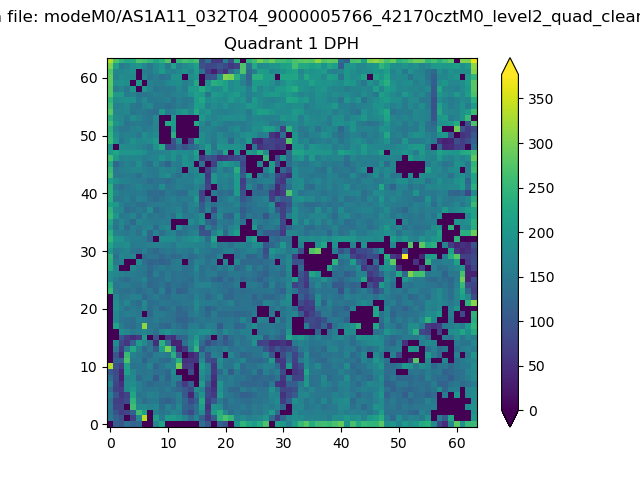 |
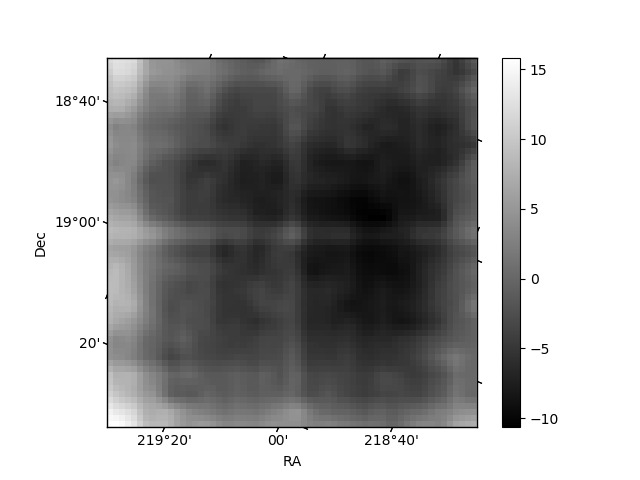
Quadrant B |
|---|---|---|---|
| Quadrant D | 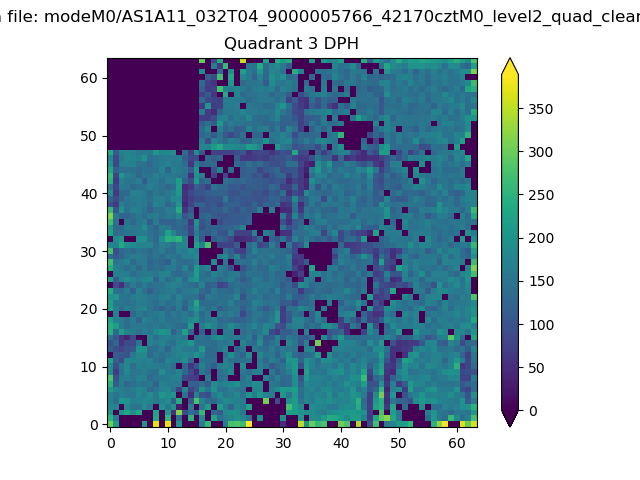 |
 |
Quadrant C |
| Plot type | Count rate plots | Images |
|---|---|---|
| Comparison with Poisson distribution Blue bars denote a histogram of data divided into 1 sec bins. Red curve is a Poisson curve with rate = median count rate of data. |
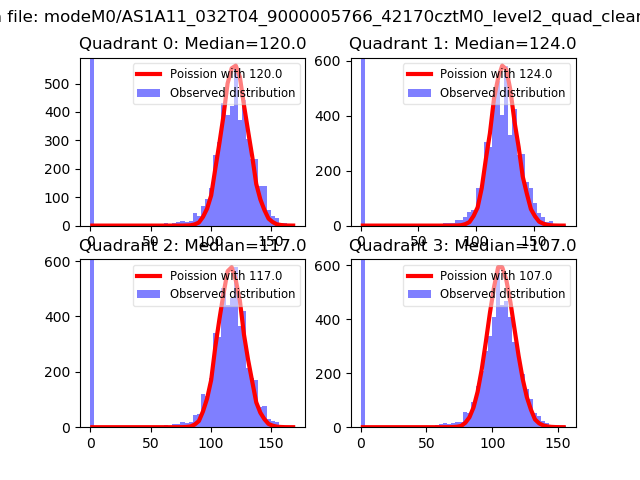 |
 |
| Quadrant-wise count rates Data is divided into 100 sec bins |
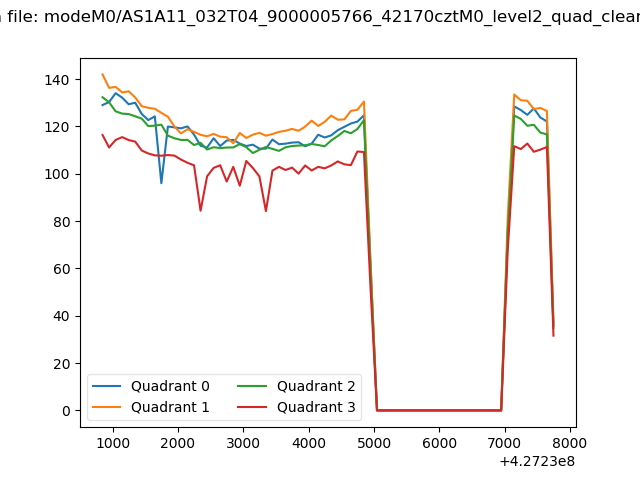 |
|
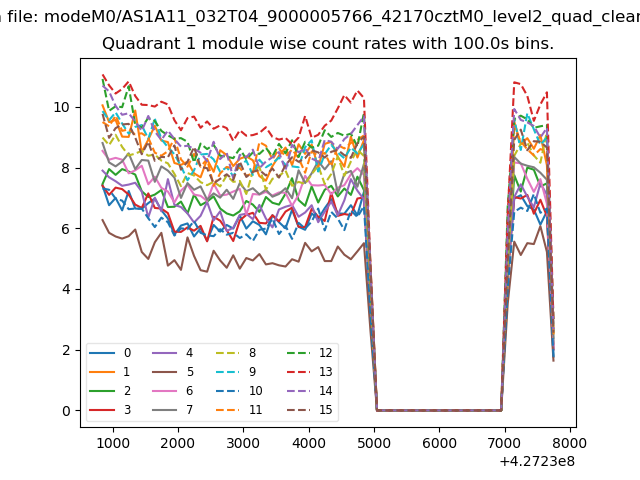
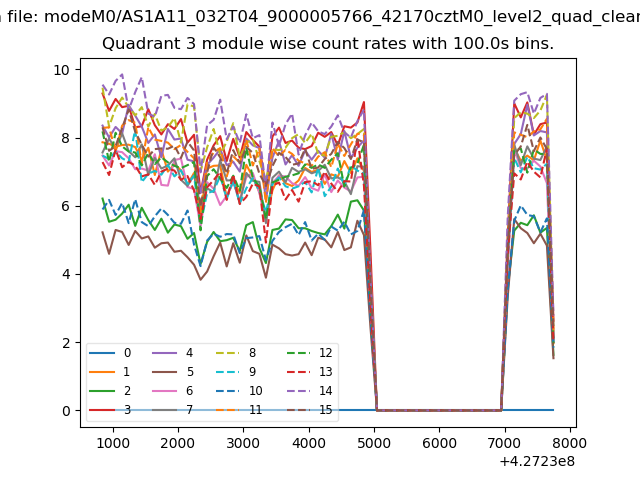
| Module-wise count rates for Quadrant A Data is divided into 100 sec bins |
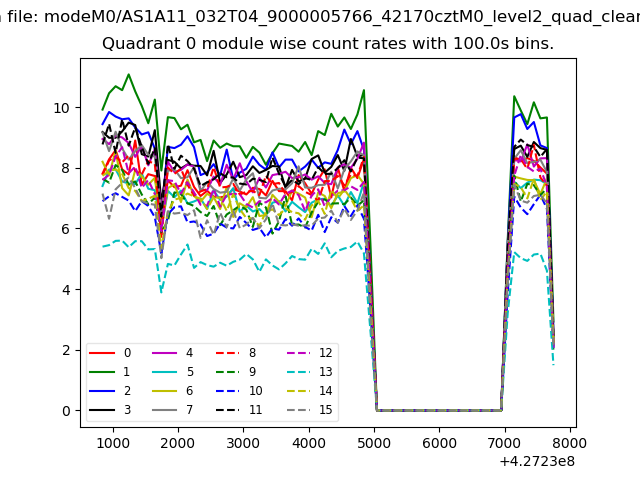 |
 |
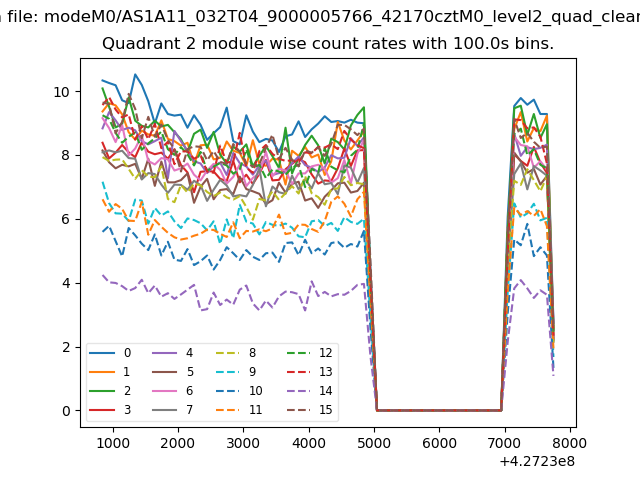
| Module-wise count rates for Quadrant B Data is divided into 100 sec bins |
 |
 |
| Module-wise count rates for Quadrant C Data is divided into 100 sec bins |
 |
 |
| Module-wise count rates for Quadrant D Data is divided into 100 sec bins |
 |
 |
| Parameter | Plot |
|---|---|
| CZT HV Monitor | 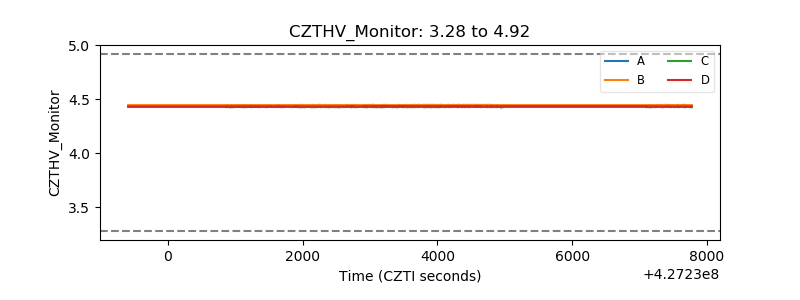 |
| D_VDD | 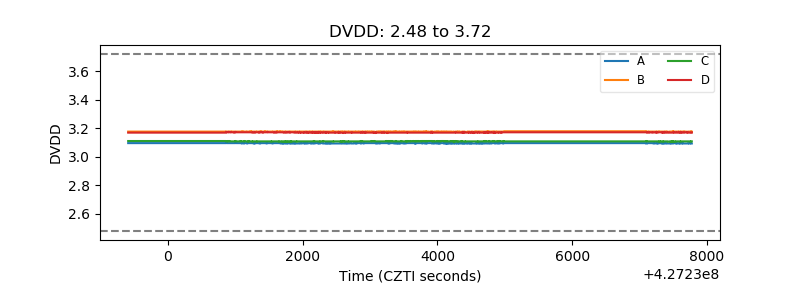 |
| Temperature 1 | 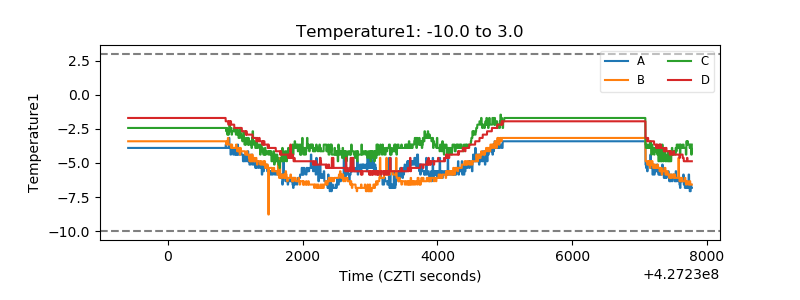 |
| Veto HV Monitor | 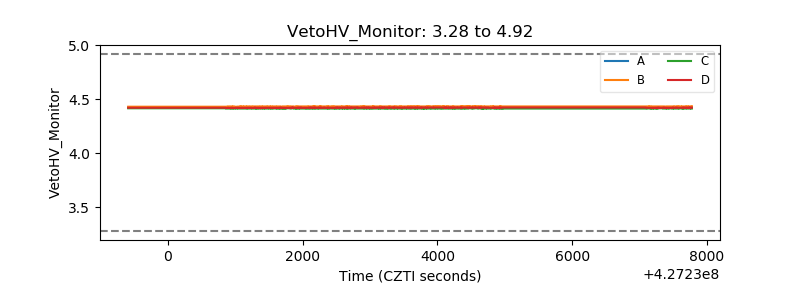 |
| Veto LLD | 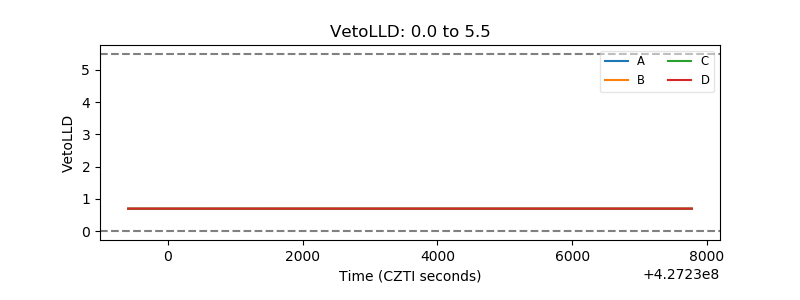 |
| Alpha Counter | 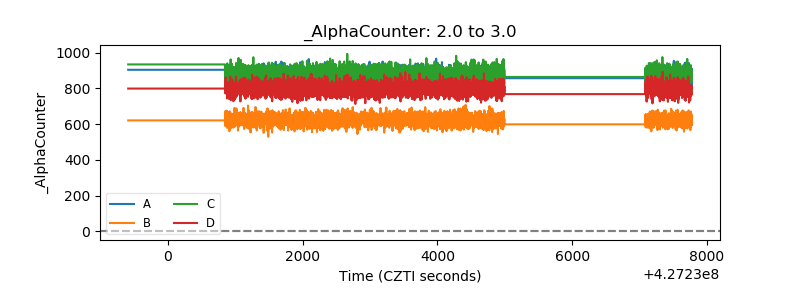 |
| _CPM_Rate | 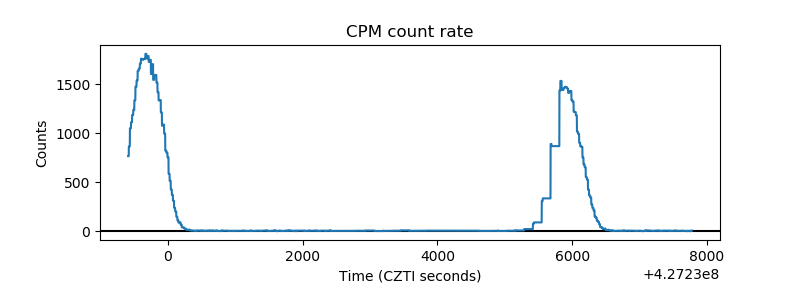 |
| CZT Counter | 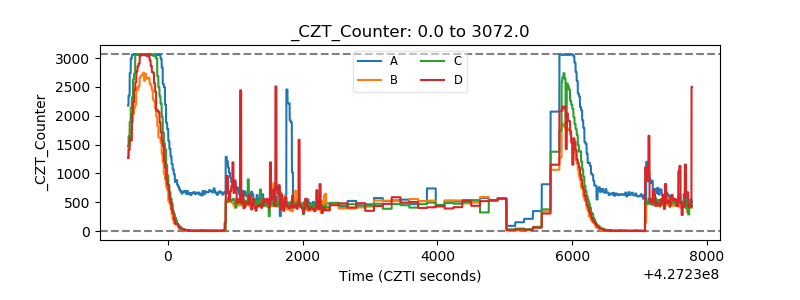 |
| +2.5 Volts monitor |  |
| +5 Volts monitor |  |
| _ROLL_ROT | 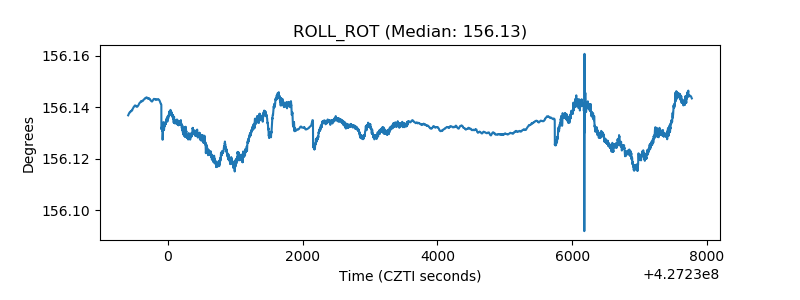 |
| _Roll_DEC | 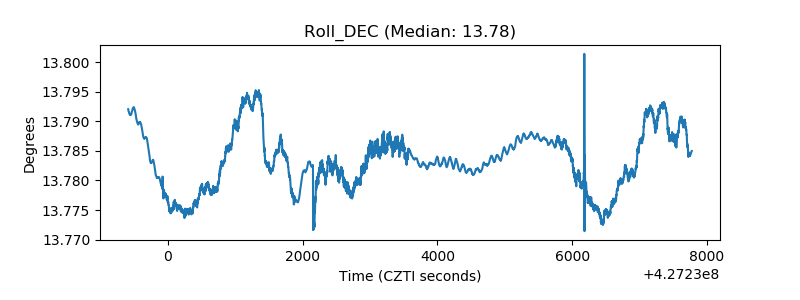 |
| _Roll_RA | 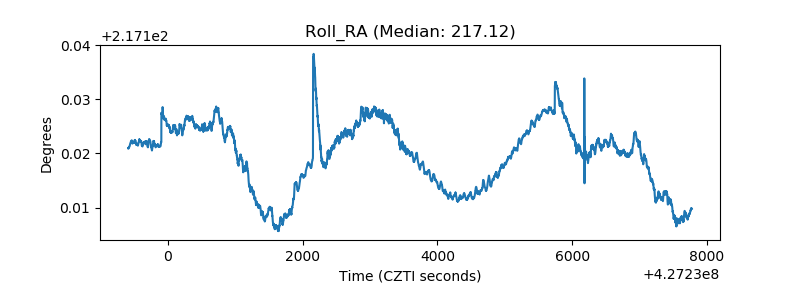 |
| Veto Counter | 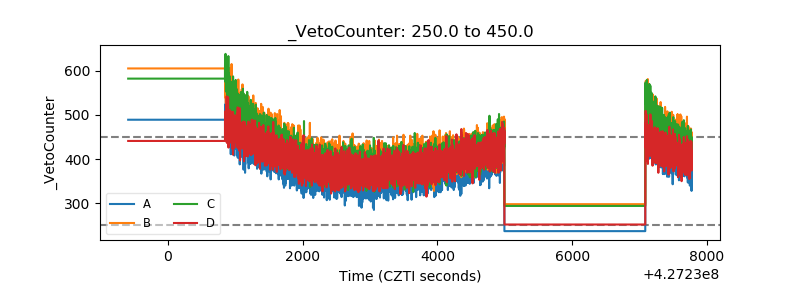 |