| Param | Original file | Final file |
|---|---|---|
| Filename | modeM0/AS1A11_032T04_9000005766_42171cztM0_level2.fits | modeM0/AS1A11_032T04_9000005766_42171cztM0_level2_quad_clean.evt |
| Size (bytes) | 290,246,400 | 84,821,760 |
| Size | 276.8 MB | 80.9 MB |
| Events in quadrant A | 2,964,714 | 560,405 |
| Events in quadrant B | 2,321,670 | 592,213 |
| Events in quadrant C | 2,317,269 | 561,209 |
| Events in quadrant D | 2,755,290 | 508,249 |
| Mode M0 | |||
|---|---|---|---|
| Quadrant | BADHDUFLAG | Total packets | Discarded packets |
| A | 0 | 11773 | 2 |
| B | 0 | 10191 | 2 |
| C | 0 | 9923 | 2 |
| D | 0 | 11673 | 2 |
| Mode M9 | |||
|---|---|---|---|
| Quadrant | BADHDUFLAG | Total packets | Discarded packets |
| A | 0 | 32 | 0 |
| B | 0 | 32 | 0 |
| C | 0 | 33 | 0 |
| D | 0 | 33 | 0 |
| Mode SS | |||
|---|---|---|---|
| Quadrant | BADHDUFLAG | Total packets | Discarded packets |
| A | 0 | 102 | 0 |
| B | 0 | 102 | 0 |
| C | 0 | 102 | 0 |
| D | 0 | 102 | 0 |
| Quadrant | Total seconds | Saturated seconds | Saturation percentage |
|---|---|---|---|
| A | 4936 | 110 | 2.228525% |
| B | 4936 | 10 | 0.202593% |
| C | 4936 | 4 | 0.081037% |
| D | 4936 | 71 | 1.438412% |
Noise dominated data is calculated using 1-second bins in cleaned event files. If a bin has >2000 counts, and if more than 50% of those come from <1% of pixels, then it is considered to be noise-dominated and hence unusable.
| Quadrant | # 1 sec bins | Bins with >0 counts | Bins with >2000 counts | High rate bins dominated by noise | Noise dominated (total time) | Noise dominated (detector-on time) | Marked lightcurve |
|---|---|---|---|---|---|---|---|
| A | 7060 | 4937 | 109 | 109 | 1.54% | 2.21% | 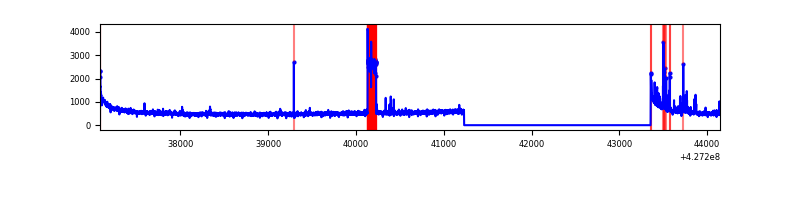 |
| B | 7060 | 4937 | 3 | 3 | 0.04% | 0.06% | 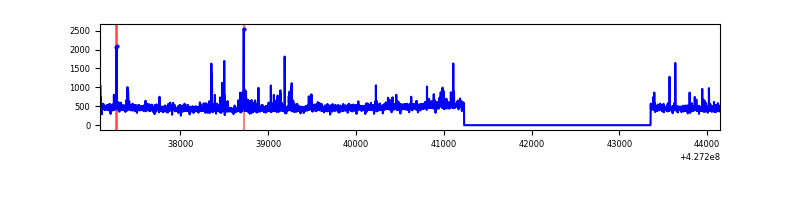 |
| C | 7060 | 4937 | 0 | 0 | 0.00% | 0.00% | 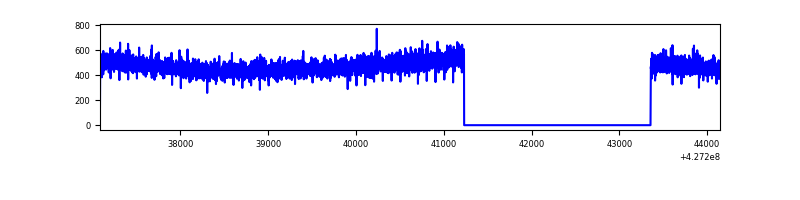 |
| D | 7060 | 4937 | 73 | 73 | 1.03% | 1.48% | 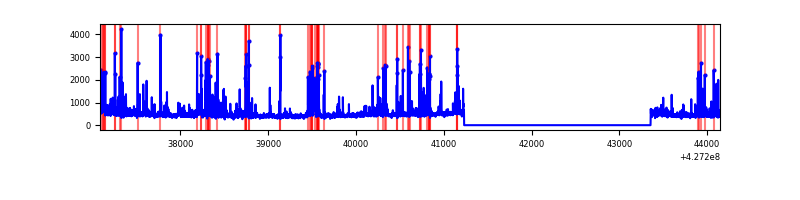 |
Top three noisy pixels from each quadrant. If the there are fewer than three noisy pixels in the level2.evt file, extra rows are filled as -1
| Pixel properties | Quadrant properties | ||||||
|---|---|---|---|---|---|---|---|
| Quadrant | DetID | PixID | Counts | Sigma | Mean | Median | Sigma |
| A | 10 | 83 | 497164 | 4430.0 | 542 | 532 | 112.1 |
| A | 15 | 222 | 351267 | 3128.58 | 542 | 532 | 112.1 |
| A | 12 | 189 | 8670 | 72.59 | 542 | 532 | 112.1 |
| B | 0 | 229 | 93696 | 864.66 | 552 | 537 | 107.7 |
| B | 5 | 255 | 55727 | 512.25 | 552 | 537 | 107.7 |
| B | 12 | 111 | 13376 | 119.17 | 552 | 537 | 107.7 |
| C | 15 | 214 | 208381 | 1649.86 | 539 | 545 | 126.0 |
| C | 15 | 159 | 4432 | 30.86 | 539 | 545 | 126.0 |
| C | 0 | 207 | 4210 | 29.09 | 539 | 545 | 126.0 |
| D | 1 | 52 | 239614 | 1825.56 | 531 | 516 | 131.0 |
| D | 12 | 6 | 227105 | 1730.06 | 531 | 516 | 131.0 |
| D | 13 | 249 | 63831 | 483.42 | 531 | 516 | 131.0 |
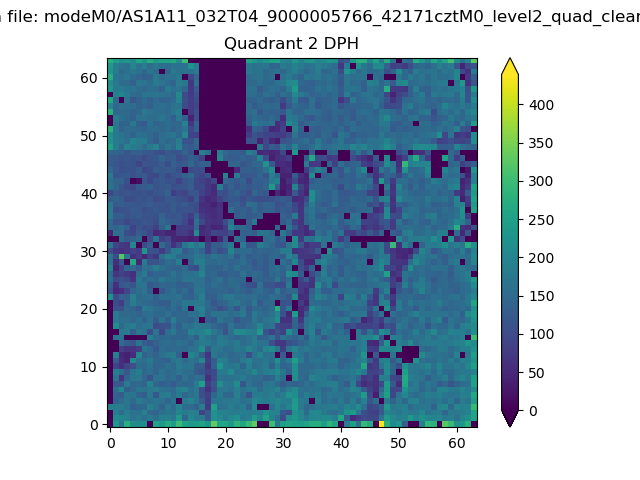
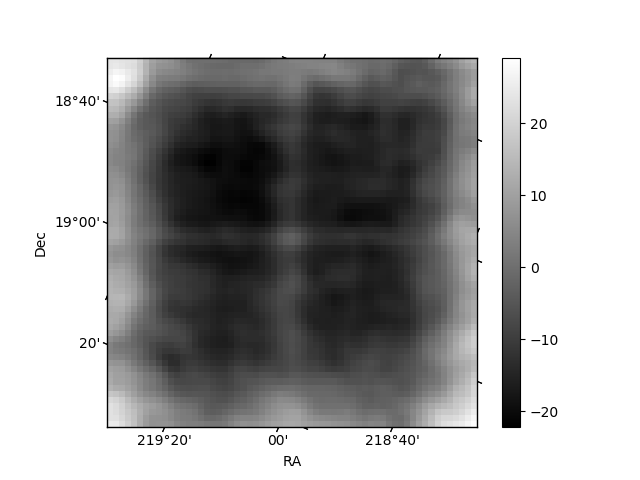
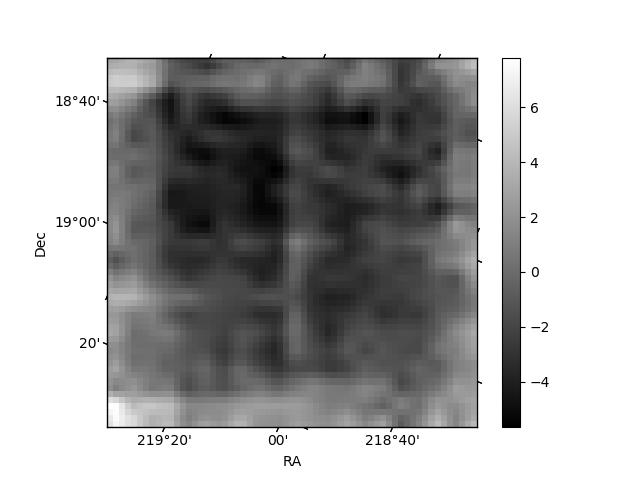
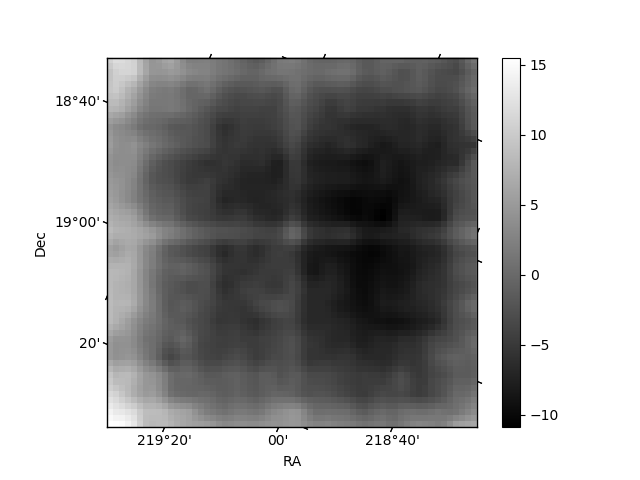
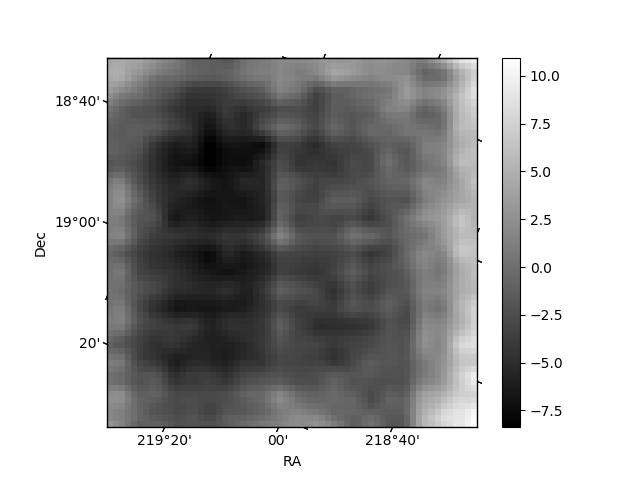
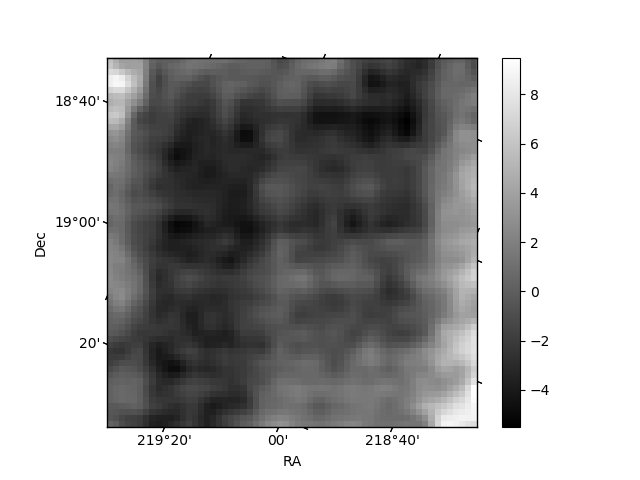
Histogram calculated using DETX and DETY for each event in the final _common_clean file
| Quadrant A | 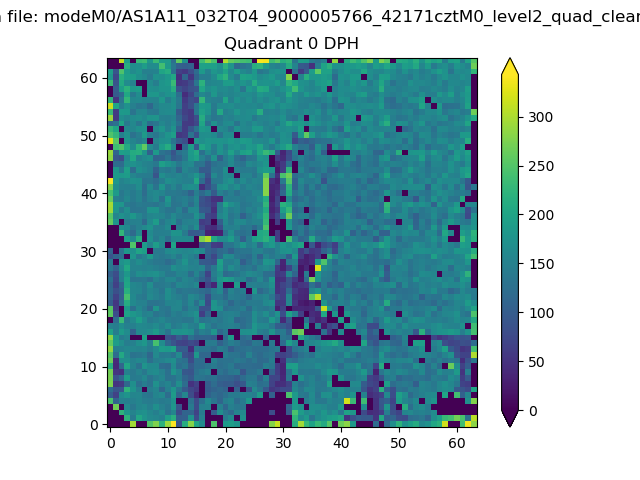 |
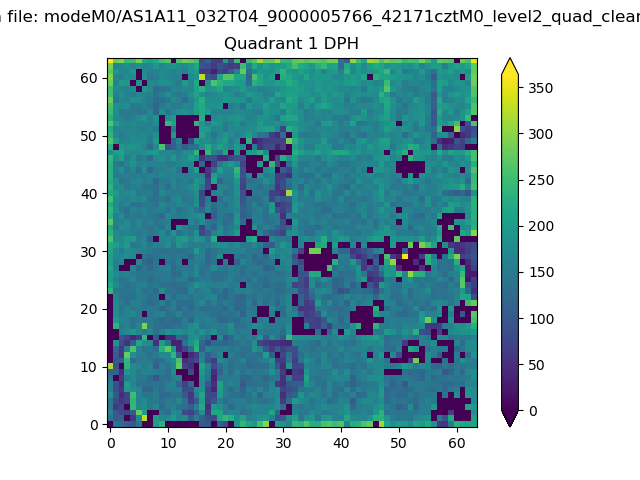 |
Quadrant B |
|---|---|---|---|
| Quadrant D | 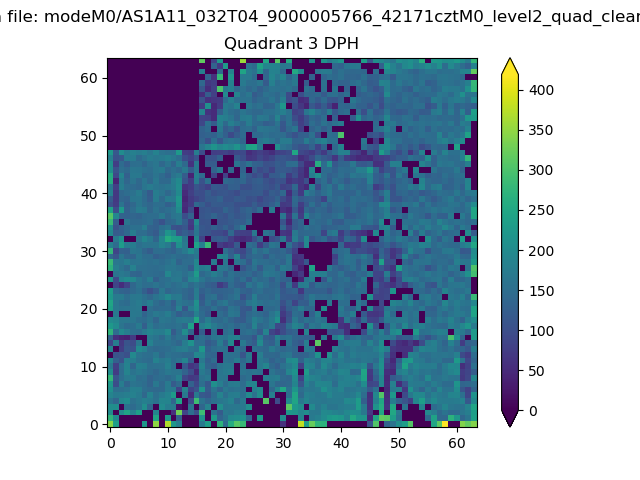 |
 |
Quadrant C |
| Plot type | Count rate plots | Images |
|---|---|---|
| Comparison with Poisson distribution Blue bars denote a histogram of data divided into 1 sec bins. Red curve is a Poisson curve with rate = median count rate of data. |
 |
 |
| Quadrant-wise count rates Data is divided into 100 sec bins |
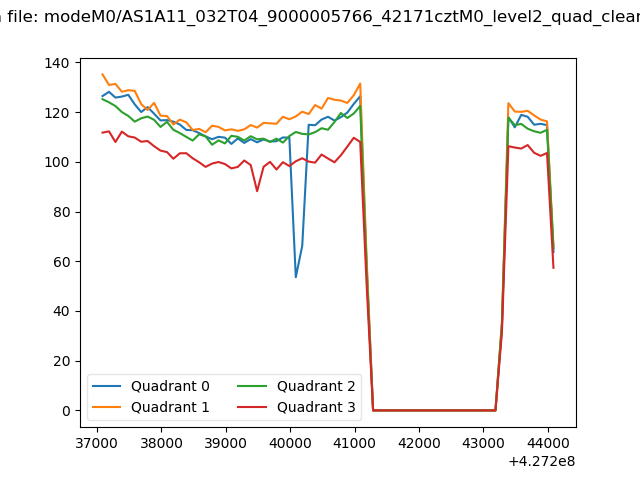 |
|
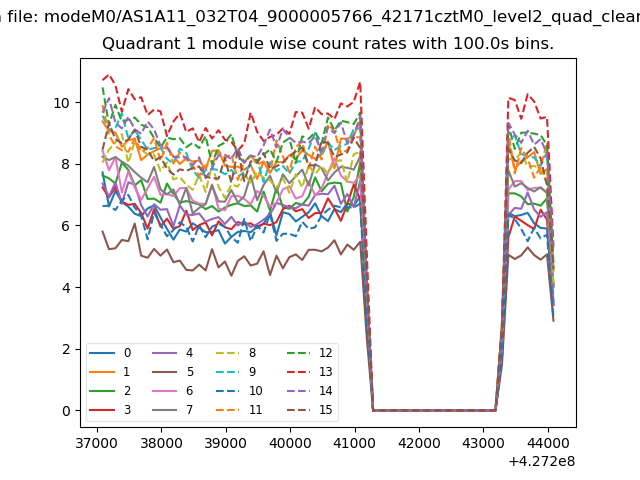
| Module-wise count rates for Quadrant A Data is divided into 100 sec bins |
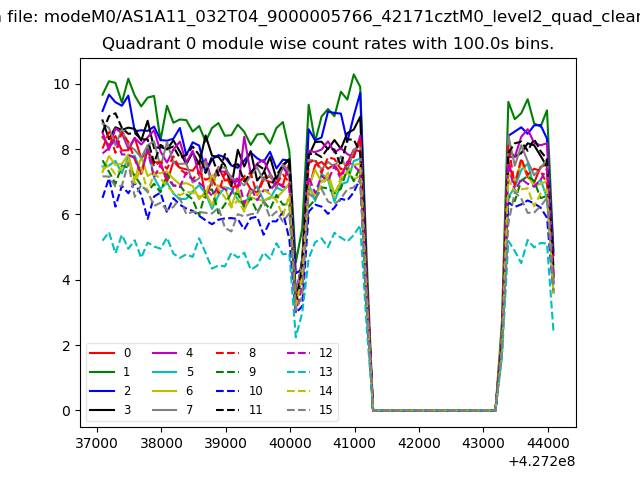 |
 |
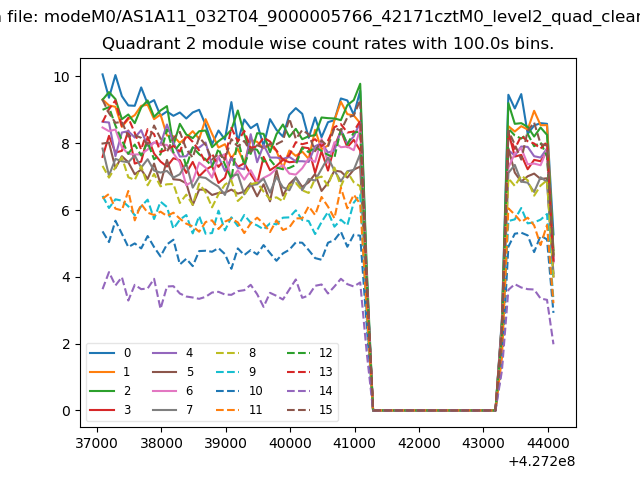
| Module-wise count rates for Quadrant B Data is divided into 100 sec bins |
 |
 |
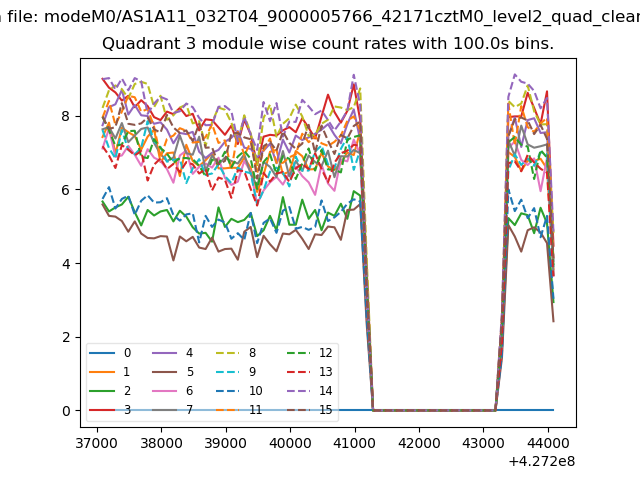
| Module-wise count rates for Quadrant C Data is divided into 100 sec bins |
 |
 |
| Module-wise count rates for Quadrant D Data is divided into 100 sec bins |
 |
 |
| Parameter | Plot |
|---|---|
| CZT HV Monitor | 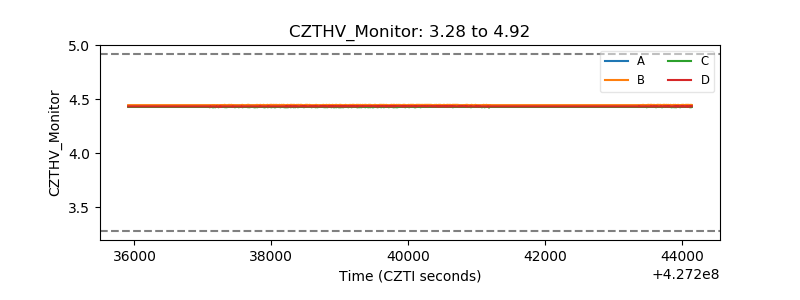 |
| D_VDD | 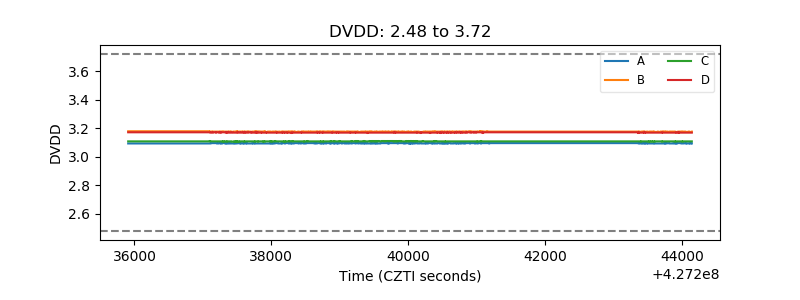 |
| Temperature 1 | 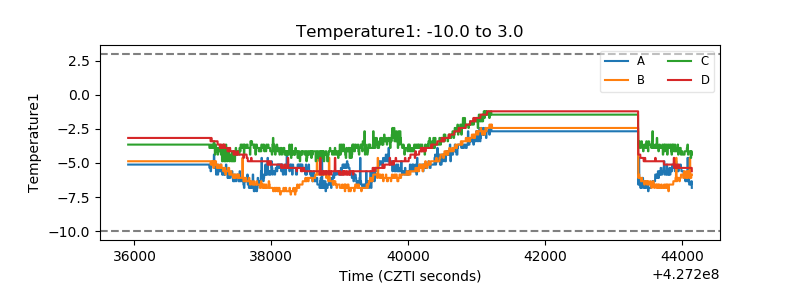 |
| Veto HV Monitor | 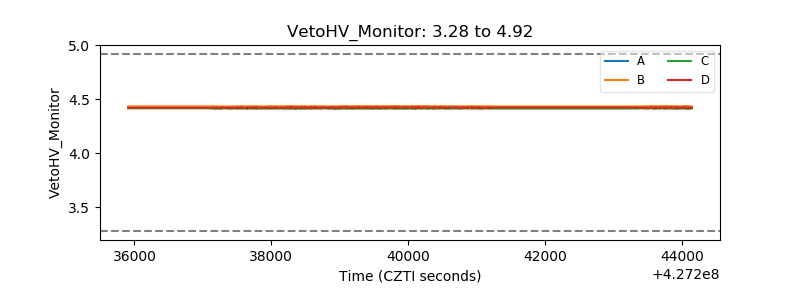 |
| Veto LLD | 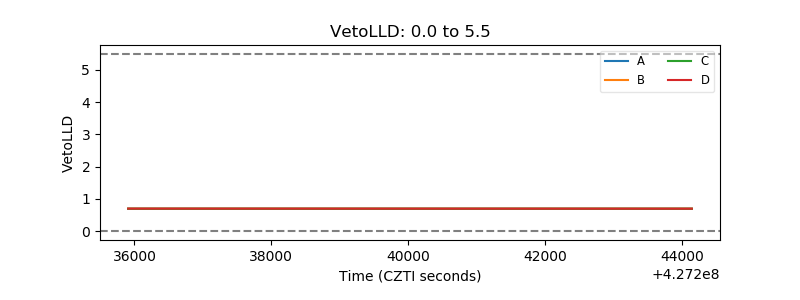 |
| Alpha Counter | 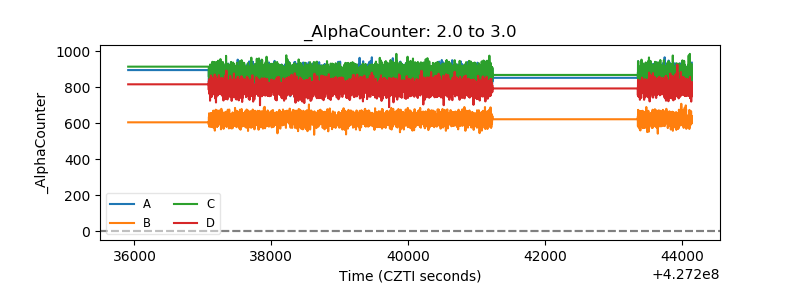 |
| _CPM_Rate | 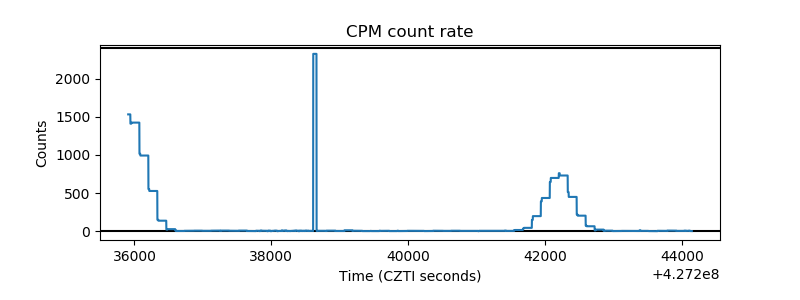 |
| CZT Counter |  |
| +2.5 Volts monitor | 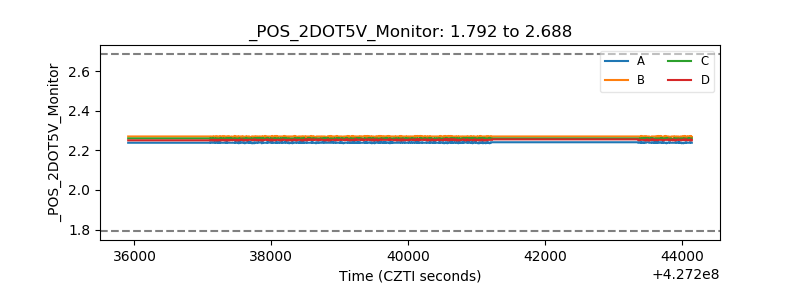 |
| +5 Volts monitor | 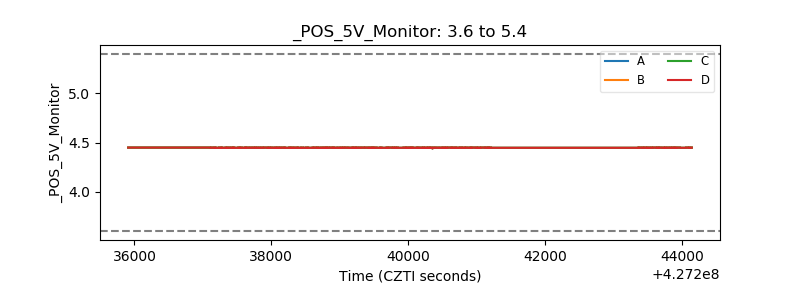 |
| _ROLL_ROT | 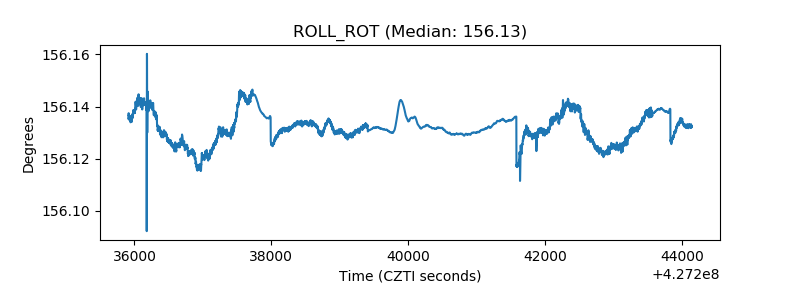 |
| _Roll_DEC | 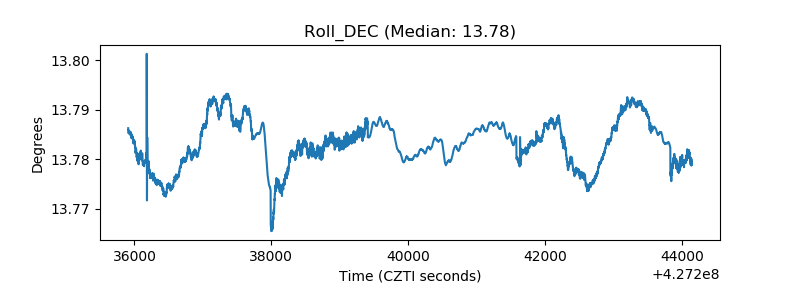 |
| _Roll_RA | 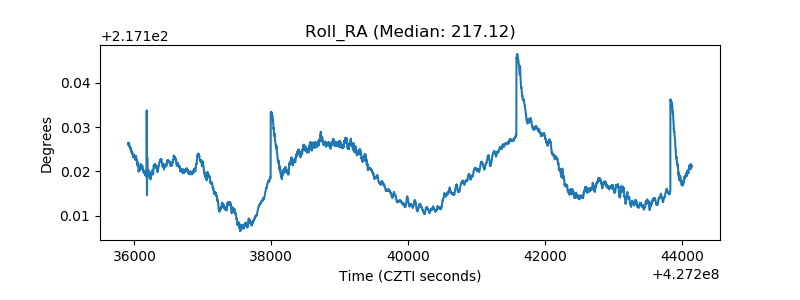 |
| Veto Counter | 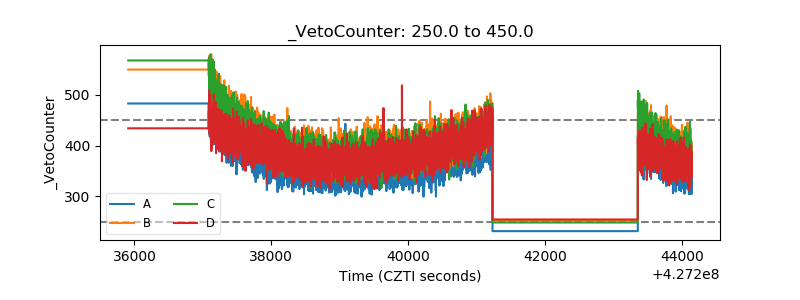 |