| Param | Original file | Final file |
|---|---|---|
| Filename | modeM0/AS1A11_032T04_9000005766_42173cztM0_level2.fits | modeM0/AS1A11_032T04_9000005766_42173cztM0_level2_quad_clean.evt |
| Size (bytes) | 317,540,160 | 86,227,200 |
| Size | 302.8 MB | 82.2 MB |
| Events in quadrant A | 3,640,301 | 561,264 |
| Events in quadrant B | 2,481,187 | 594,408 |
| Events in quadrant C | 2,431,962 | 565,975 |
| Events in quadrant D | 2,785,866 | 516,674 |
| Mode M0 | |||
|---|---|---|---|
| Quadrant | BADHDUFLAG | Total packets | Discarded packets |
| A | 0 | 14009 | 2 |
| B | 0 | 11133 | 2 |
| C | 0 | 10675 | 2 |
| D | 0 | 12278 | 2 |
| Mode M9 | |||
|---|---|---|---|
| Quadrant | BADHDUFLAG | Total packets | Discarded packets |
| A | 0 | 39 | 0 |
| B | 0 | 39 | 0 |
| C | 0 | 39 | 0 |
| D | 0 | 39 | 0 |
| Mode SS | |||
|---|---|---|---|
| Quadrant | BADHDUFLAG | Total packets | Discarded packets |
| A | 0 | 110 | 0 |
| B | 0 | 110 | 0 |
| C | 0 | 110 | 0 |
| D | 0 | 110 | 0 |
| Quadrant | Total seconds | Saturated seconds | Saturation percentage |
|---|---|---|---|
| A | 5323 | 174 | 3.268833% |
| B | 5324 | 23 | 0.432006% |
| C | 5324 | 2 | 0.037566% |
| D | 5324 | 77 | 1.446281% |
Noise dominated data is calculated using 1-second bins in cleaned event files. If a bin has >2000 counts, and if more than 50% of those come from <1% of pixels, then it is considered to be noise-dominated and hence unusable.
| Quadrant | # 1 sec bins | Bins with >0 counts | Bins with >2000 counts | High rate bins dominated by noise | Noise dominated (total time) | Noise dominated (detector-on time) | Marked lightcurve |
|---|---|---|---|---|---|---|---|
| A | 9240 | 5325 | 159 | 159 | 1.72% | 2.99% | 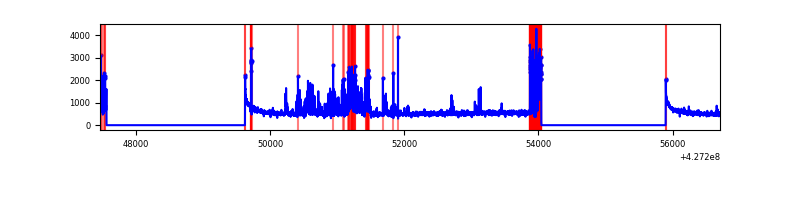 |
| B | 9241 | 5326 | 13 | 13 | 0.14% | 0.24% | 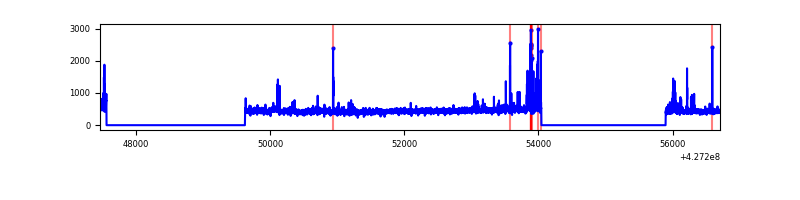 |
| C | 9241 | 5326 | 0 | 0 | 0.00% | 0.00% | 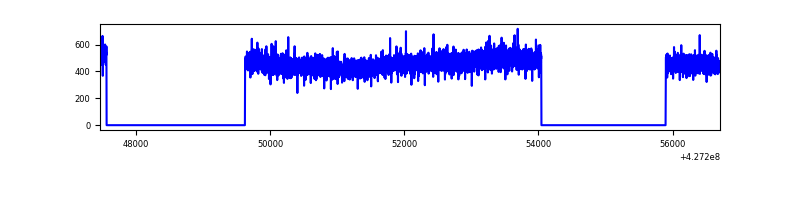 |
| D | 9241 | 5326 | 84 | 84 | 0.91% | 1.58% | 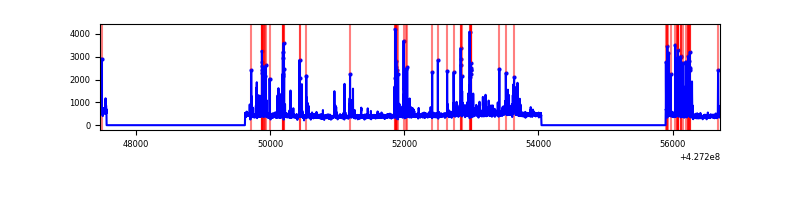 |
Top three noisy pixels from each quadrant. If the there are fewer than three noisy pixels in the level2.evt file, extra rows are filled as -1
| Pixel properties | Quadrant properties | ||||||
|---|---|---|---|---|---|---|---|
| Quadrant | DetID | PixID | Counts | Sigma | Mean | Median | Sigma |
| A | 15 | 222 | 851497 | 7182.53 | 575 | 563 | 118.5 |
| A | 10 | 83 | 536415 | 4523.0 | 575 | 563 | 118.5 |
| A | 12 | 189 | 14747 | 119.72 | 575 | 563 | 118.5 |
| B | 0 | 229 | 48532 | 421.45 | 578 | 561 | 113.8 |
| B | 3 | 112 | 47800 | 415.02 | 578 | 561 | 113.8 |
| B | 5 | 255 | 47641 | 413.62 | 578 | 561 | 113.8 |
| C | 15 | 214 | 224101 | 1678.39 | 566 | 570 | 133.2 |
| C | 13 | 61 | 3782 | 24.12 | 566 | 570 | 133.2 |
| C | 7 | 220 | 1908 | 10.05 | 566 | 570 | 133.2 |
| D | 12 | 6 | 267783 | 1926.94 | 560 | 544 | 138.7 |
| D | 13 | 249 | 166316 | 1195.31 | 560 | 544 | 138.7 |
| D | 10 | 199 | 78976 | 565.54 | 560 | 544 | 138.7 |
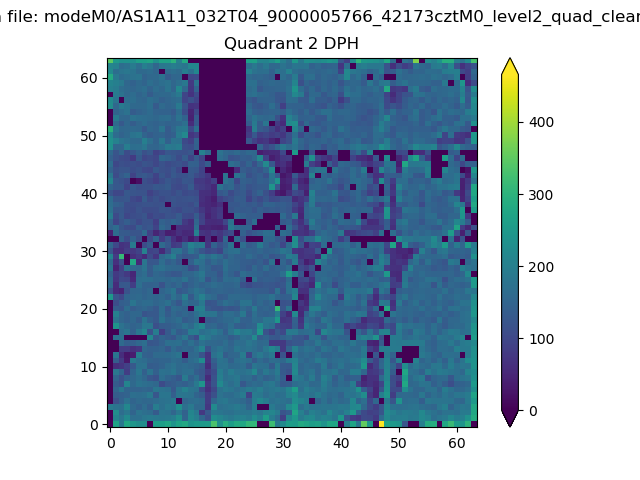
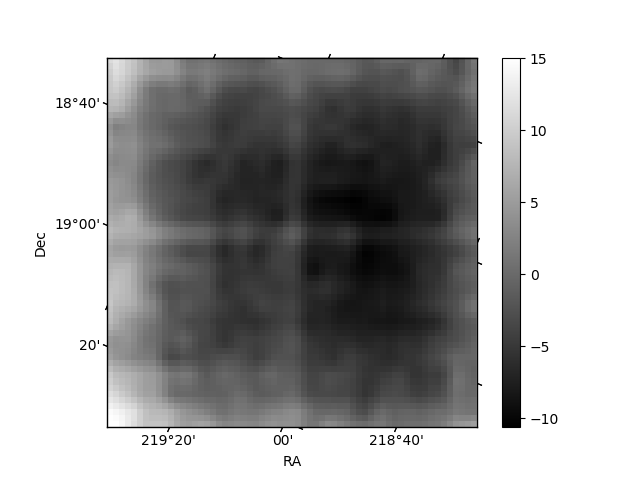
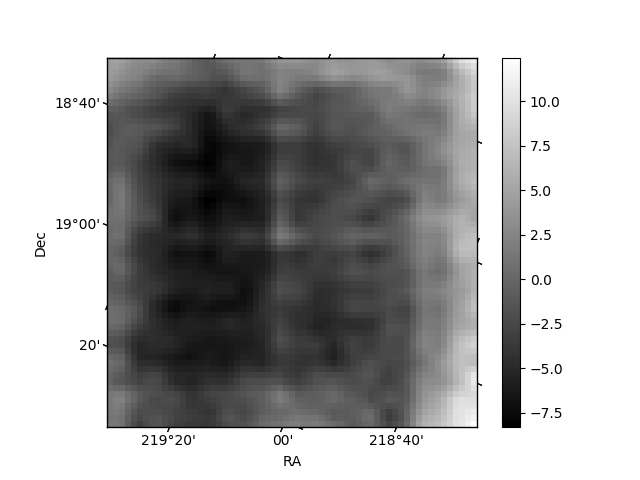
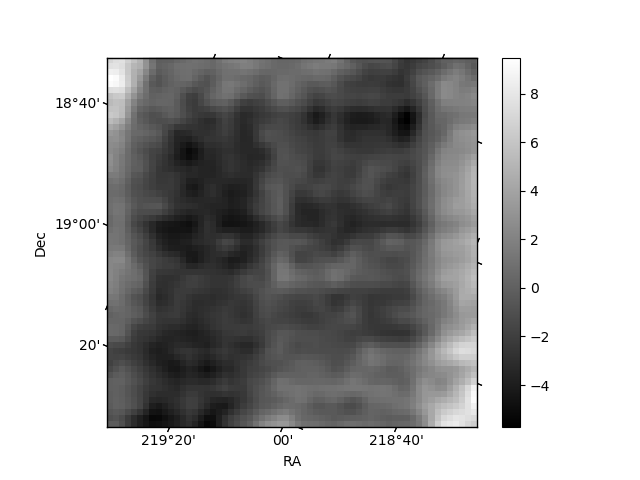
Histogram calculated using DETX and DETY for each event in the final _common_clean file
| Quadrant A | 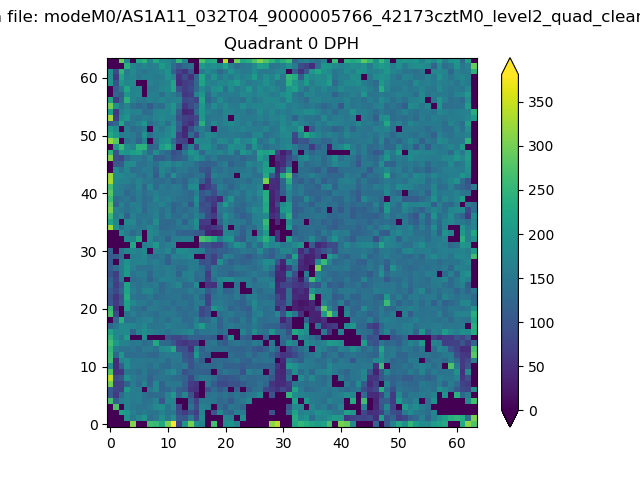 |
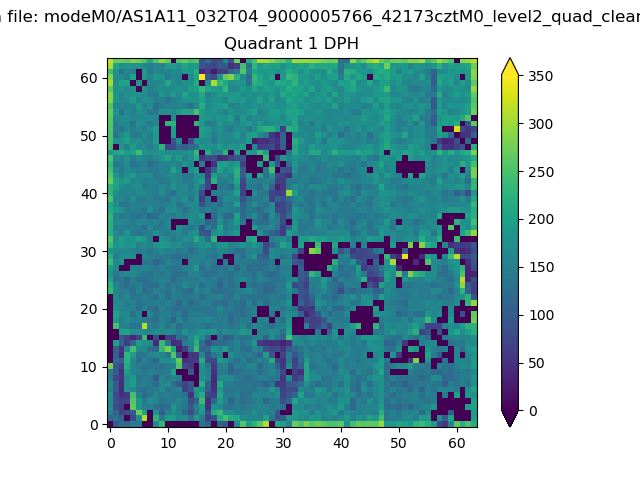 |
Quadrant B |
|---|---|---|---|
| Quadrant D | 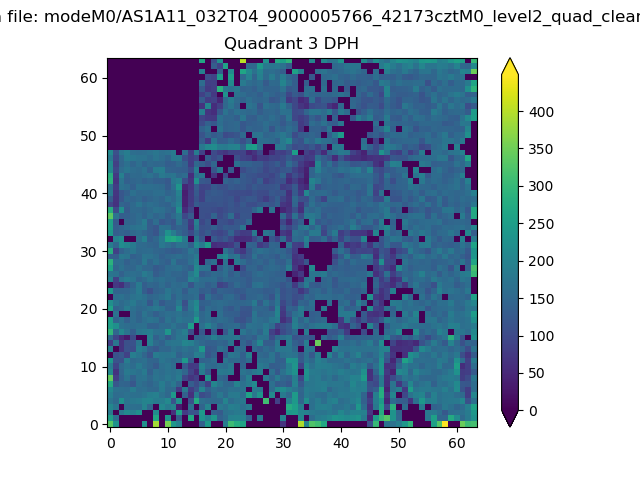 |
 |
Quadrant C |
| Plot type | Count rate plots | Images |
|---|---|---|
| Comparison with Poisson distribution Blue bars denote a histogram of data divided into 1 sec bins. Red curve is a Poisson curve with rate = median count rate of data. |
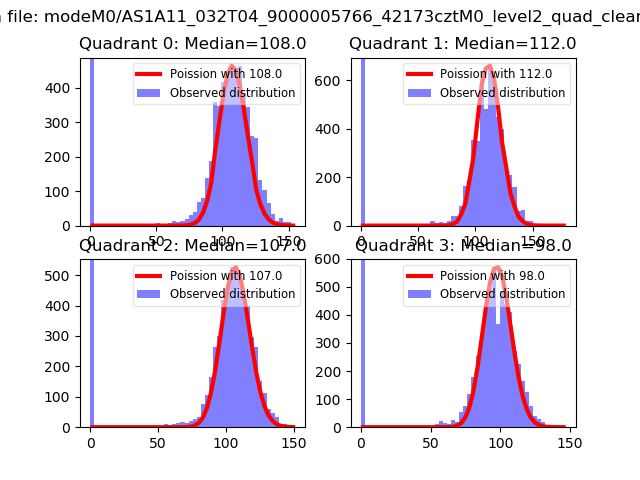 |
 |
| Quadrant-wise count rates Data is divided into 100 sec bins |
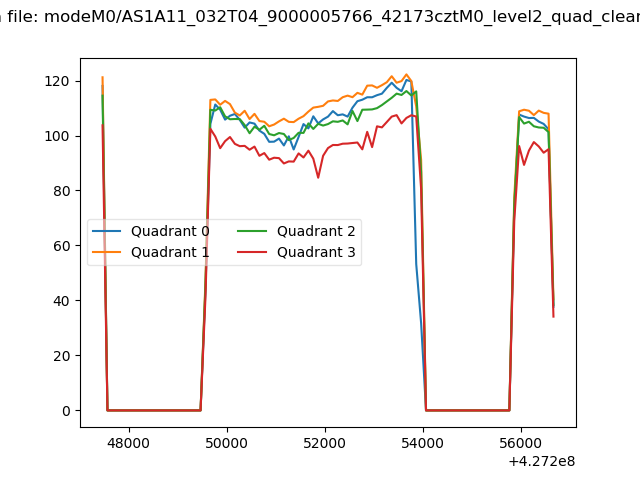 |
|
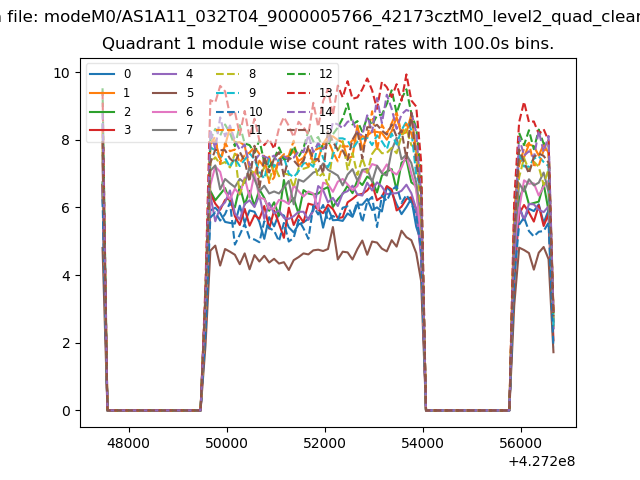
| Module-wise count rates for Quadrant A Data is divided into 100 sec bins |
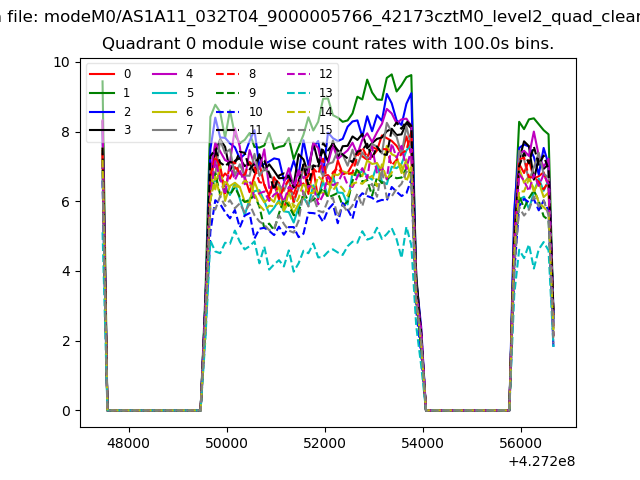 |
 |
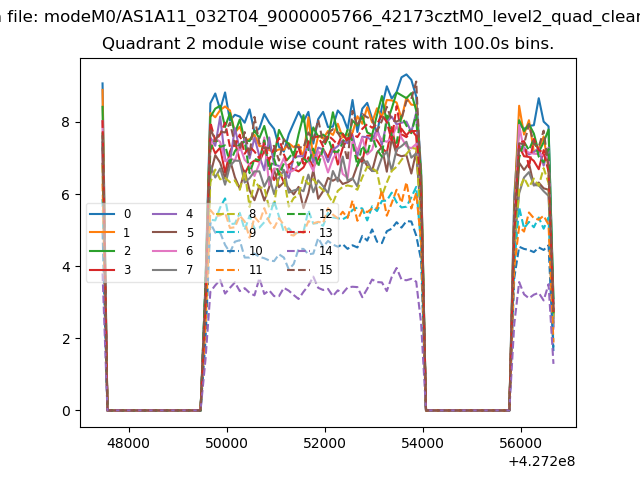
| Module-wise count rates for Quadrant B Data is divided into 100 sec bins |
 |
 |
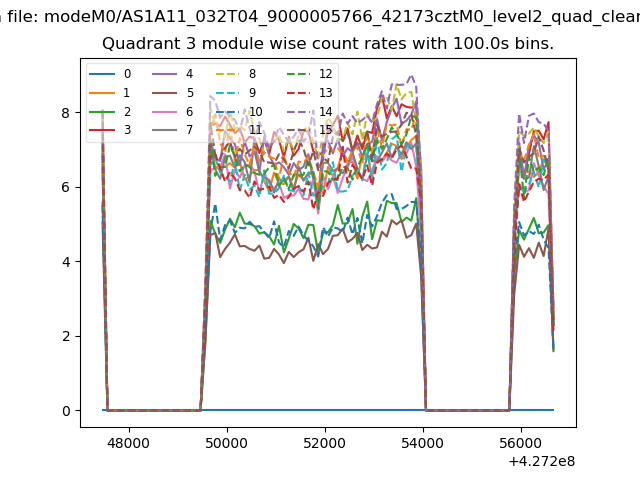
| Module-wise count rates for Quadrant C Data is divided into 100 sec bins |
 |
 |
| Module-wise count rates for Quadrant D Data is divided into 100 sec bins |
 |
 |
| Parameter | Plot |
|---|---|
| CZT HV Monitor | 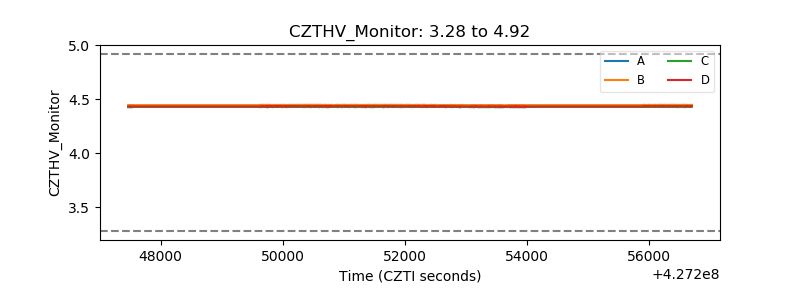 |
| D_VDD | 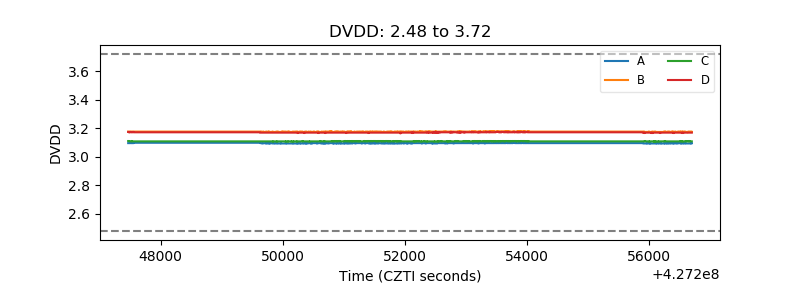 |
| Temperature 1 | 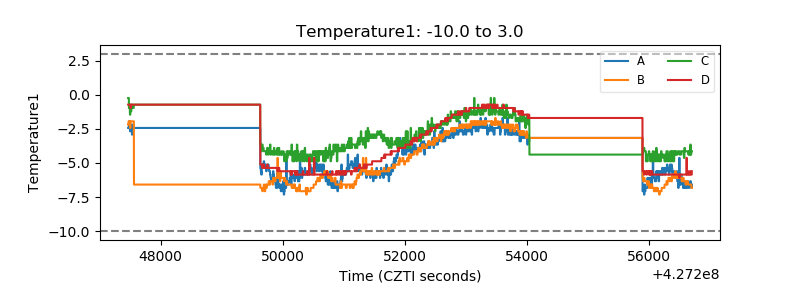 |
| Veto HV Monitor | 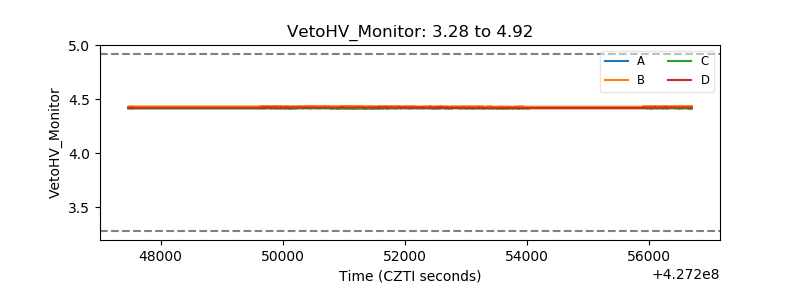 |
| Veto LLD | 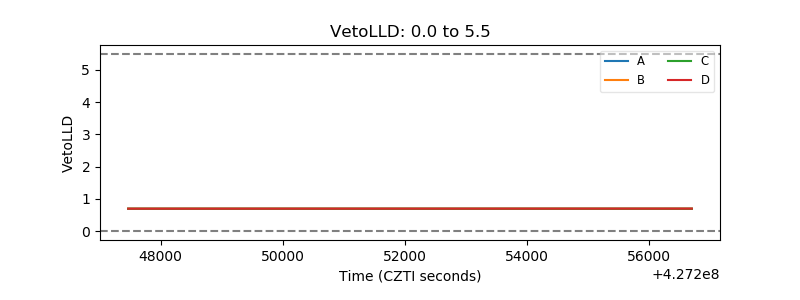 |
| Alpha Counter | 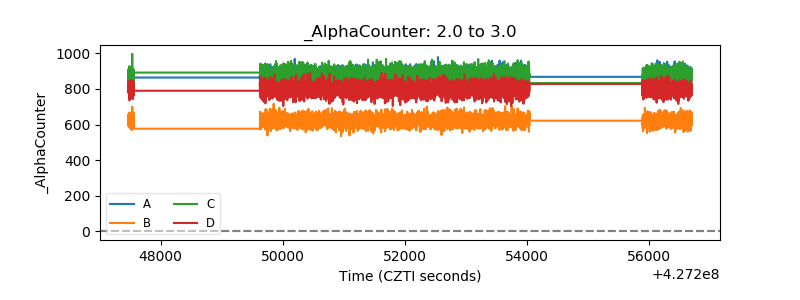 |
| _CPM_Rate |  |
| CZT Counter | 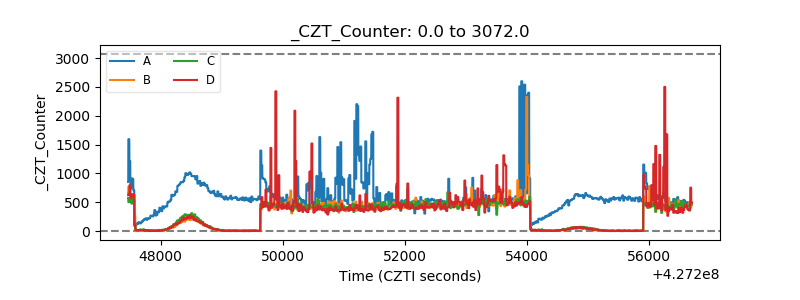 |
| +2.5 Volts monitor | 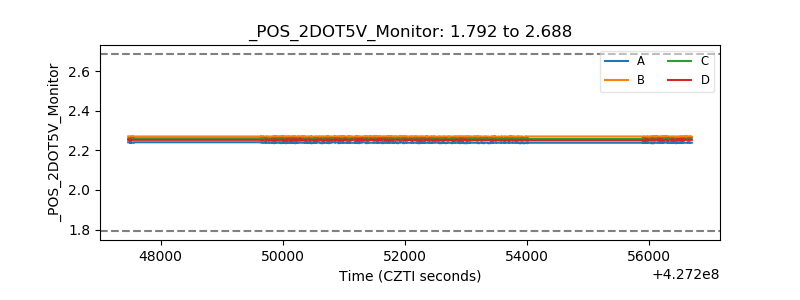 |
| +5 Volts monitor | 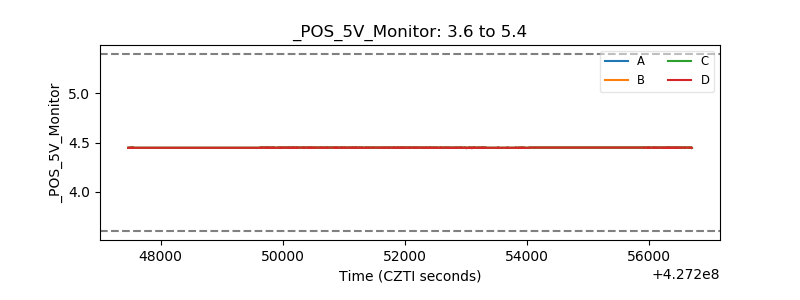 |
| _ROLL_ROT | 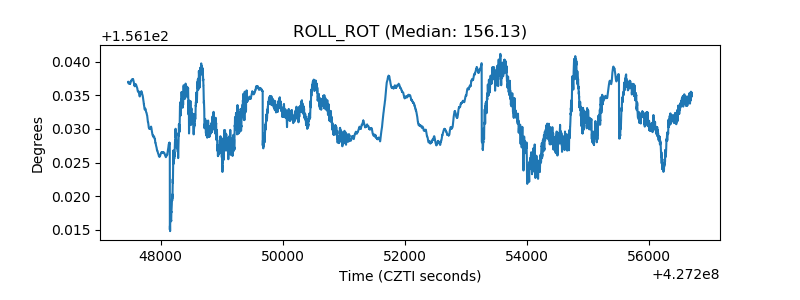 |
| _Roll_DEC | 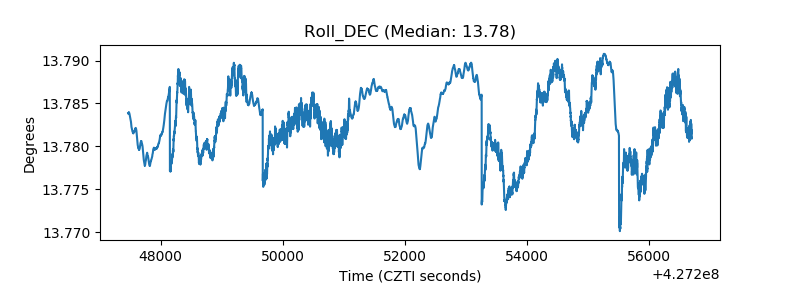 |
| _Roll_RA | 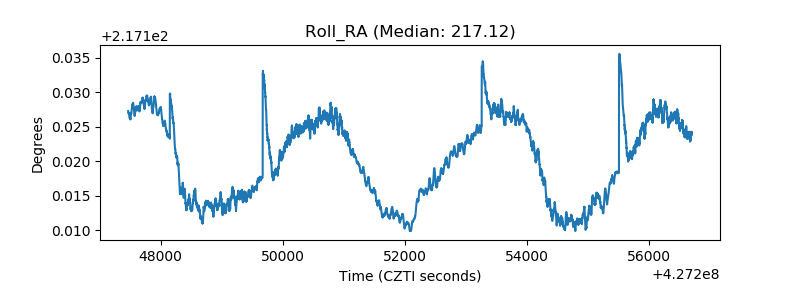 |
| Veto Counter | 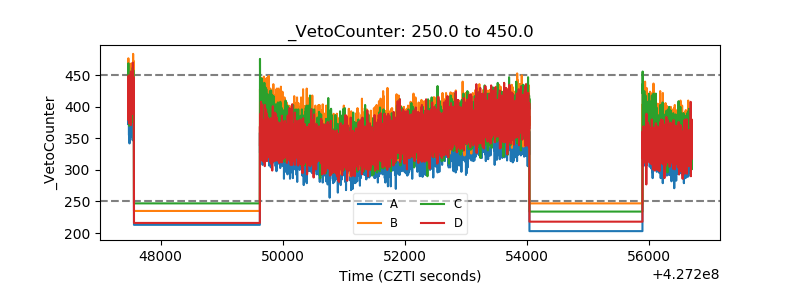 |