| Param | Original file | Final file |
|---|---|---|
| Filename | modeM0/AS1A11_032T04_9000005766_42174cztM0_level2.fits | modeM0/AS1A11_032T04_9000005766_42174cztM0_level2_quad_clean.evt |
| Size (bytes) | 339,505,920 | 86,662,080 |
| Size | 323.8 MB | 82.6 MB |
| Events in quadrant A | 4,150,280 | 541,564 |
| Events in quadrant B | 2,599,058 | 601,005 |
| Events in quadrant C | 2,495,865 | 574,757 |
| Events in quadrant D | 2,896,245 | 524,085 |
| Mode M0 | |||
|---|---|---|---|
| Quadrant | BADHDUFLAG | Total packets | Discarded packets |
| A | 0 | 15657 | 2 |
| B | 0 | 11584 | 2 |
| C | 0 | 10957 | 2 |
| D | 0 | 12661 | 2 |
| Mode M9 | |||
|---|---|---|---|
| Quadrant | BADHDUFLAG | Total packets | Discarded packets |
| A | 0 | 27 | 0 |
| B | 0 | 27 | 0 |
| C | 0 | 28 | 0 |
| D | 0 | 28 | 0 |
| Mode SS | |||
|---|---|---|---|
| Quadrant | BADHDUFLAG | Total packets | Discarded packets |
| A | 0 | 112 | 0 |
| B | 0 | 112 | 0 |
| C | 0 | 112 | 0 |
| D | 0 | 112 | 0 |
| Quadrant | Total seconds | Saturated seconds | Saturation percentage |
|---|---|---|---|
| A | 5465 | 478 | 8.746569% |
| B | 5465 | 36 | 0.658737% |
| C | 5465 | 3 | 0.054895% |
| D | 5465 | 88 | 1.610247% |
Noise dominated data is calculated using 1-second bins in cleaned event files. If a bin has >2000 counts, and if more than 50% of those come from <1% of pixels, then it is considered to be noise-dominated and hence unusable.
| Quadrant | # 1 sec bins | Bins with >0 counts | Bins with >2000 counts | High rate bins dominated by noise | Noise dominated (total time) | Noise dominated (detector-on time) | Marked lightcurve |
|---|---|---|---|---|---|---|---|
| A | 6958 | 5466 | 407 | 407 | 5.85% | 7.45% | 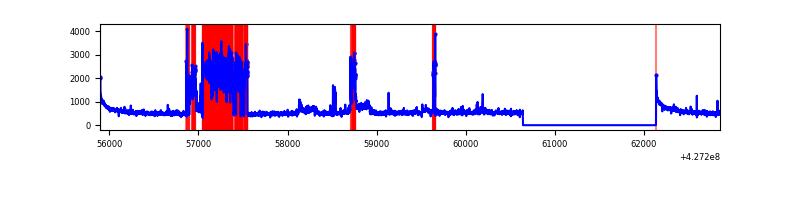 |
| B | 6958 | 5466 | 17 | 17 | 0.24% | 0.31% | 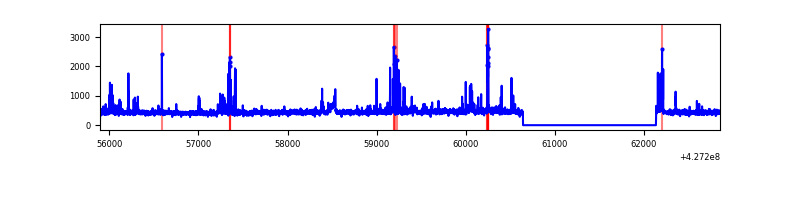 |
| C | 6958 | 5466 | 0 | 0 | 0.00% | 0.00% | 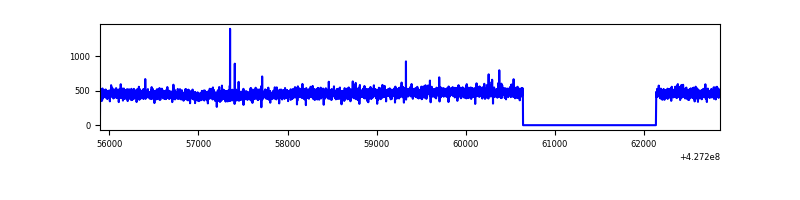 |
| D | 6958 | 5466 | 85 | 85 | 1.22% | 1.56% | 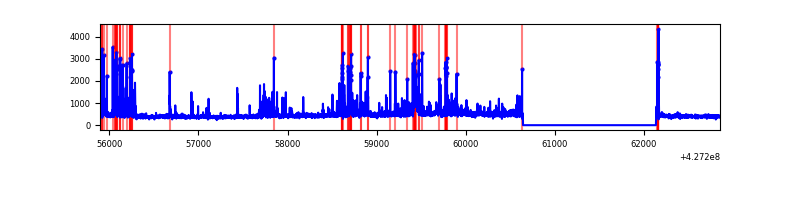 |
Top three noisy pixels from each quadrant. If the there are fewer than three noisy pixels in the level2.evt file, extra rows are filled as -1
| Pixel properties | Quadrant properties | ||||||
|---|---|---|---|---|---|---|---|
| Quadrant | DetID | PixID | Counts | Sigma | Mean | Median | Sigma |
| A | 15 | 223 | 1333670 | 11127.47 | 576 | 564 | 119.8 |
| A | 10 | 83 | 533403 | 4447.62 | 576 | 564 | 119.8 |
| A | 12 | 189 | 43238 | 356.2 | 576 | 564 | 119.8 |
| B | 0 | 229 | 85912 | 740.5 | 590 | 574 | 115.2 |
| B | 15 | 35 | 72450 | 623.68 | 590 | 574 | 115.2 |
| B | 5 | 255 | 56068 | 481.53 | 590 | 574 | 115.2 |
| C | 15 | 214 | 230005 | 1673.79 | 579 | 582 | 137.1 |
| C | 12 | 249 | 5063 | 32.69 | 579 | 582 | 137.1 |
| C | 0 | 239 | 4201 | 26.4 | 579 | 582 | 137.1 |
| D | 13 | 249 | 212609 | 1505.74 | 573 | 558 | 140.8 |
| D | 10 | 199 | 171364 | 1212.87 | 573 | 558 | 140.8 |
| D | 12 | 6 | 138850 | 981.99 | 573 | 558 | 140.8 |
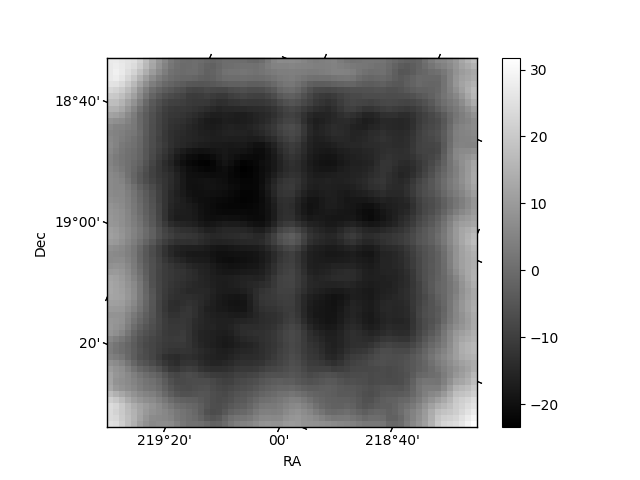
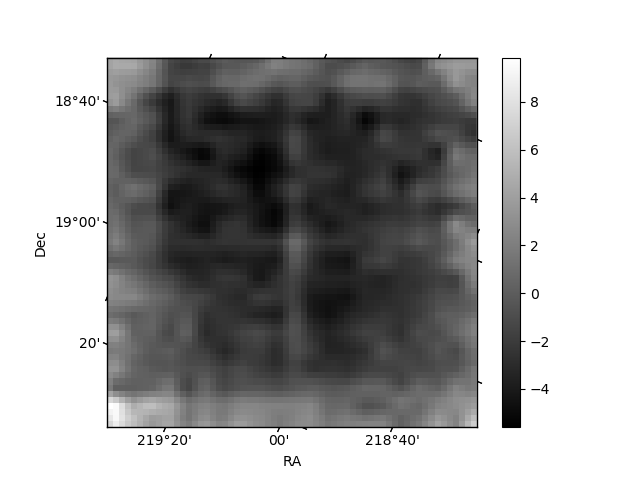
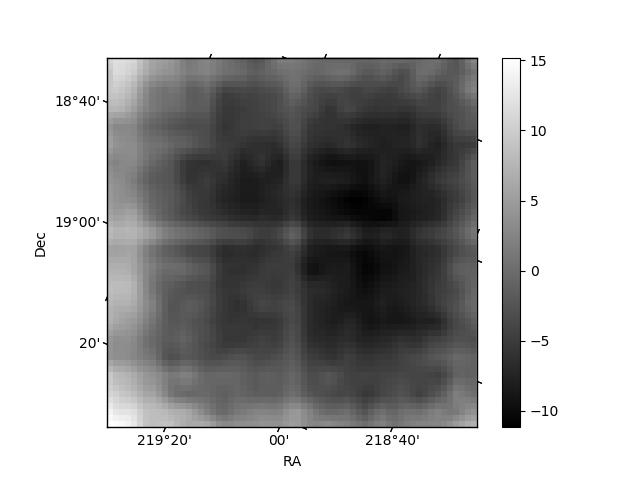
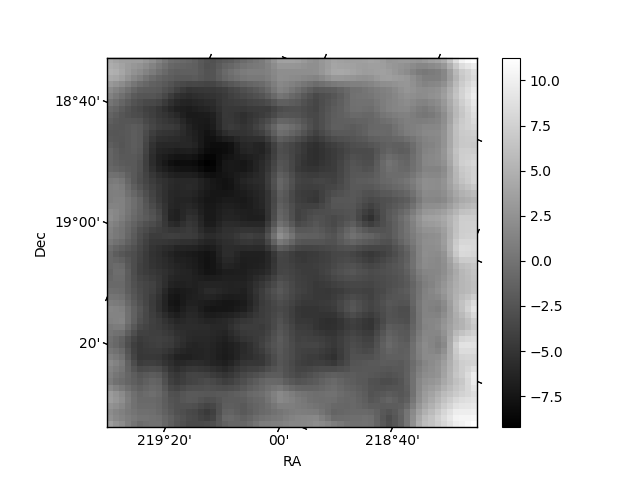
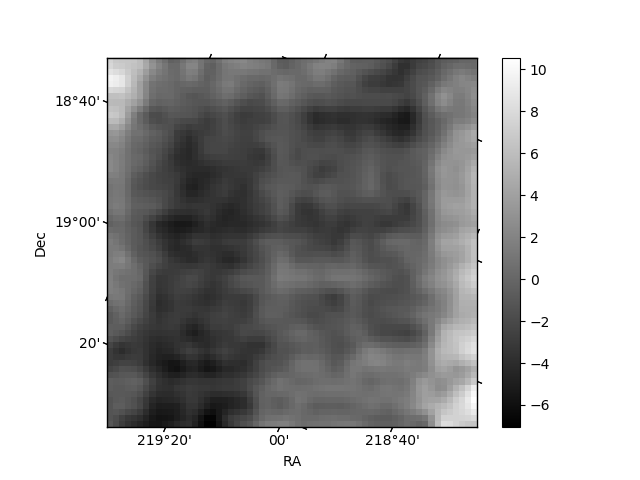
Histogram calculated using DETX and DETY for each event in the final _common_clean file
| Quadrant A | 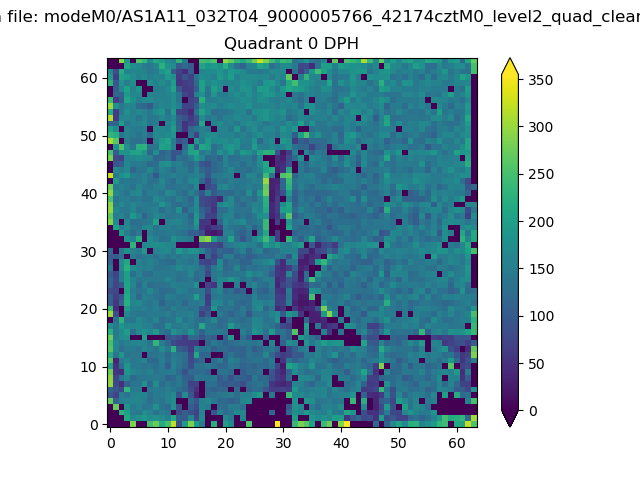 |
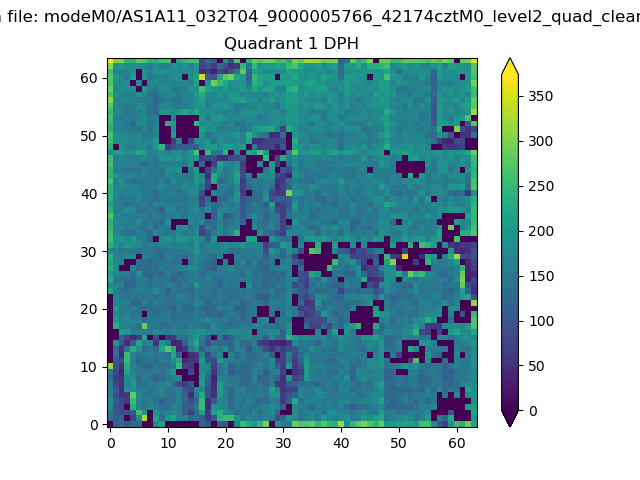 |
Quadrant B |
|---|---|---|---|
| Quadrant D | 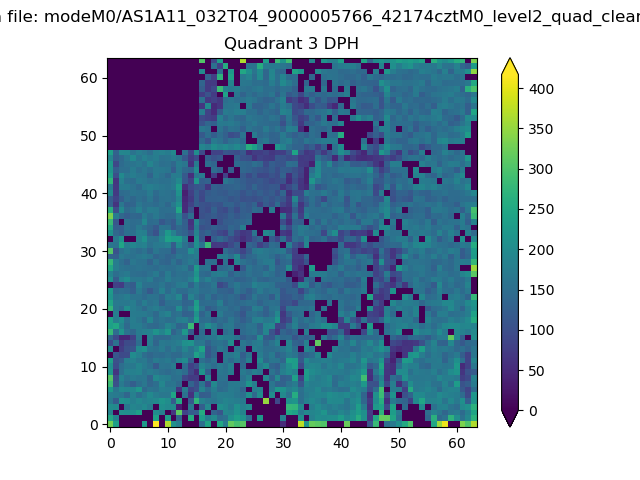 |
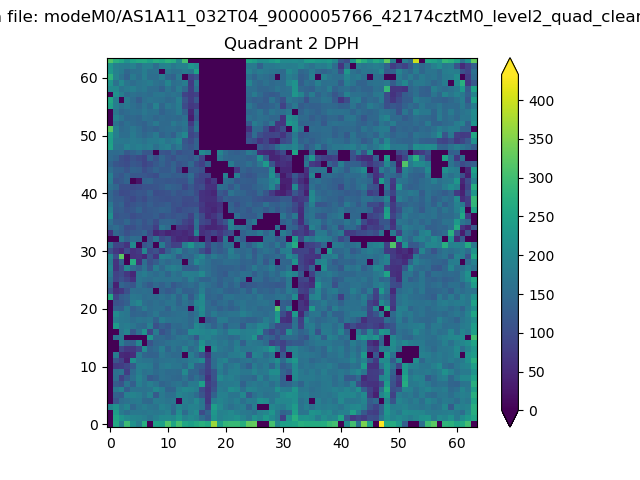 |
Quadrant C |
| Plot type | Count rate plots | Images |
|---|---|---|
| Comparison with Poisson distribution Blue bars denote a histogram of data divided into 1 sec bins. Red curve is a Poisson curve with rate = median count rate of data. |
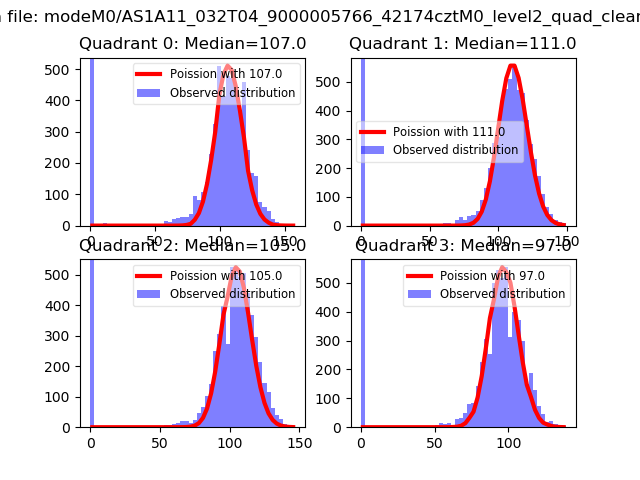 |
 |
| Quadrant-wise count rates Data is divided into 100 sec bins |
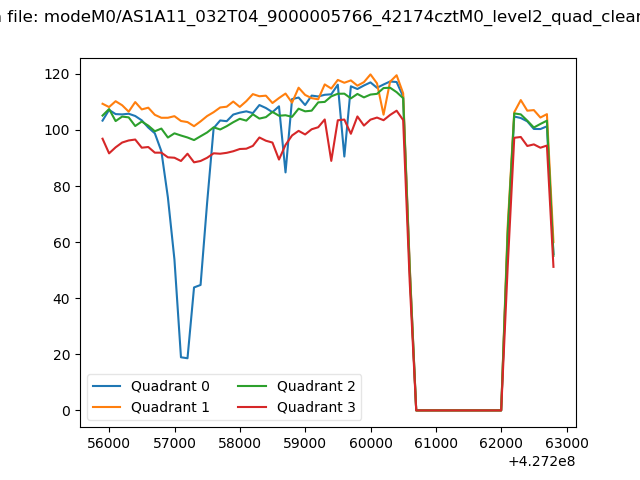 |
|
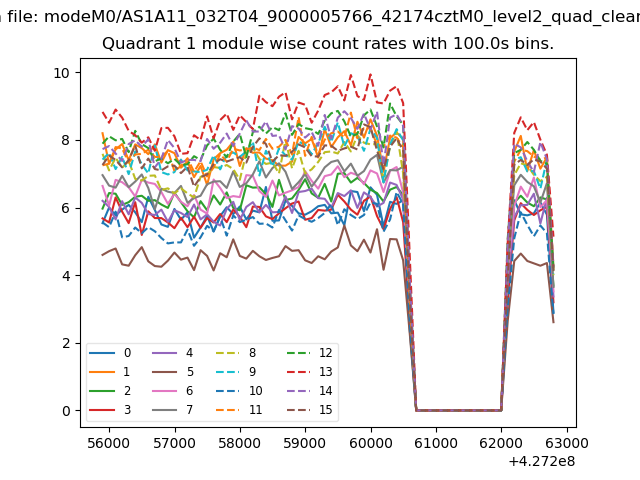
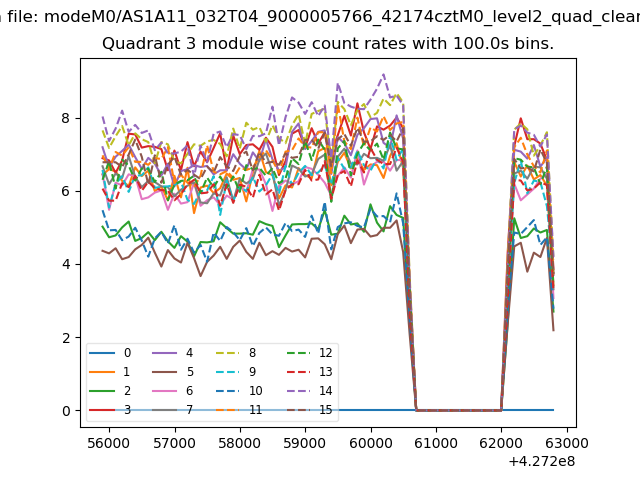
| Module-wise count rates for Quadrant A Data is divided into 100 sec bins |
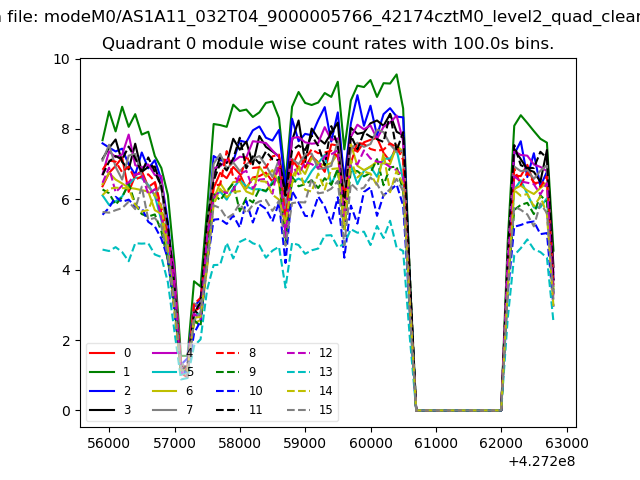 |
 |
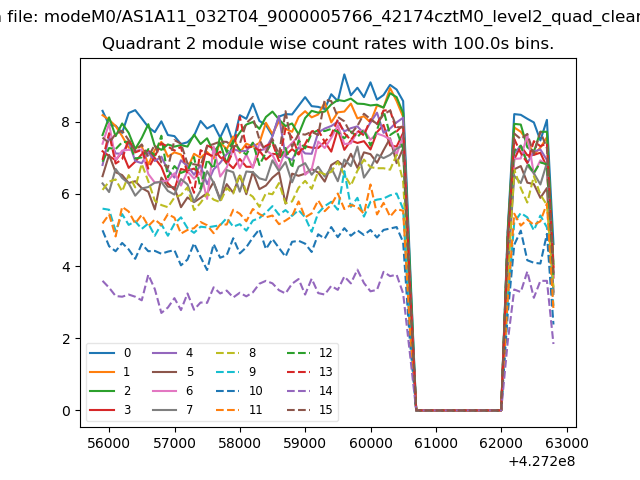
| Module-wise count rates for Quadrant B Data is divided into 100 sec bins |
 |
 |
| Module-wise count rates for Quadrant C Data is divided into 100 sec bins |
 |
 |
| Module-wise count rates for Quadrant D Data is divided into 100 sec bins |
 |
 |
| Parameter | Plot |
|---|---|
| CZT HV Monitor | 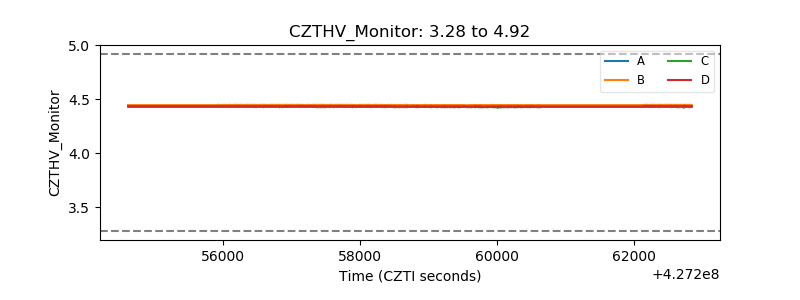 |
| D_VDD | 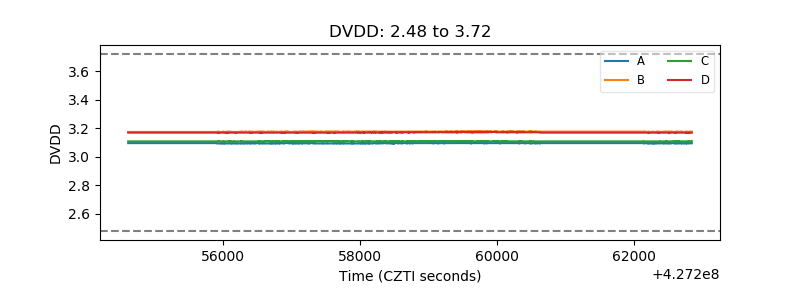 |
| Temperature 1 | 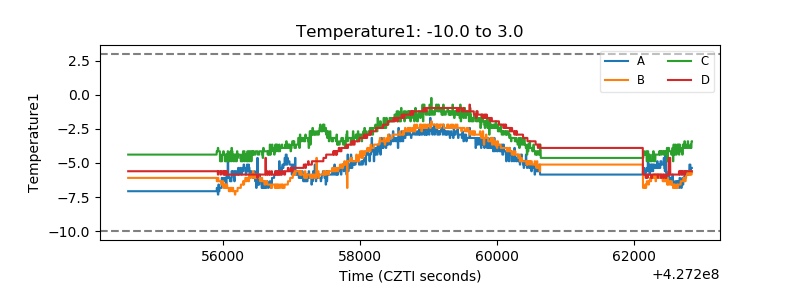 |
| Veto HV Monitor | 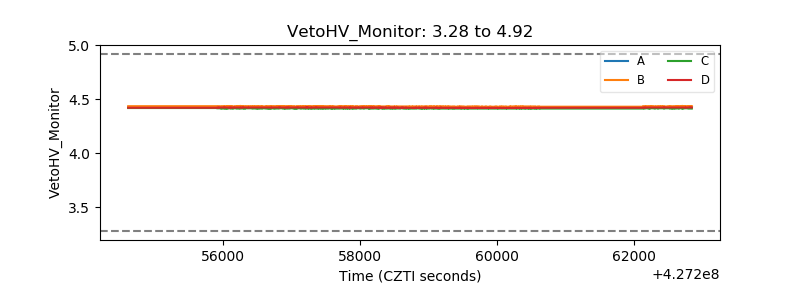 |
| Veto LLD |  |
| Alpha Counter | 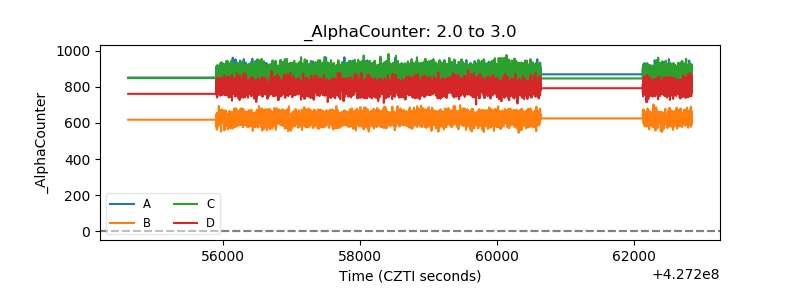 |
| _CPM_Rate | 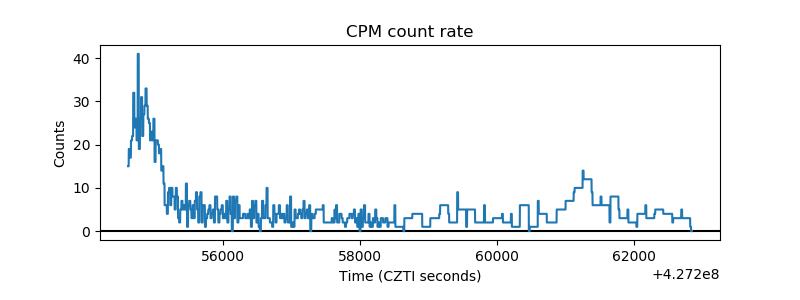 |
| CZT Counter |  |
| +2.5 Volts monitor | 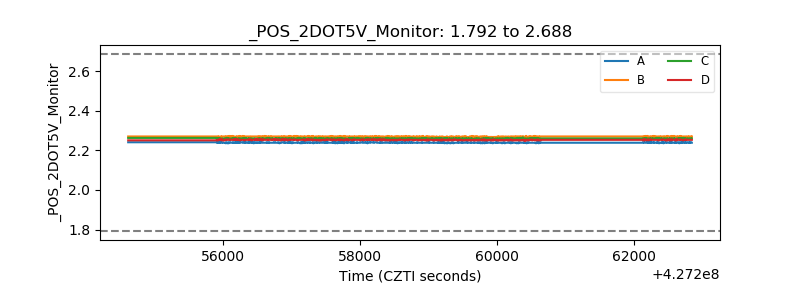 |
| +5 Volts monitor | 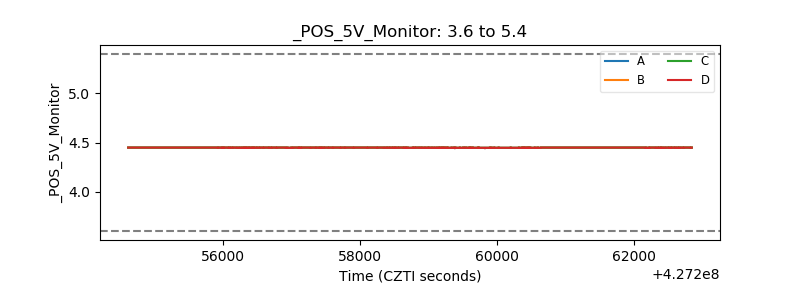 |
| _ROLL_ROT | 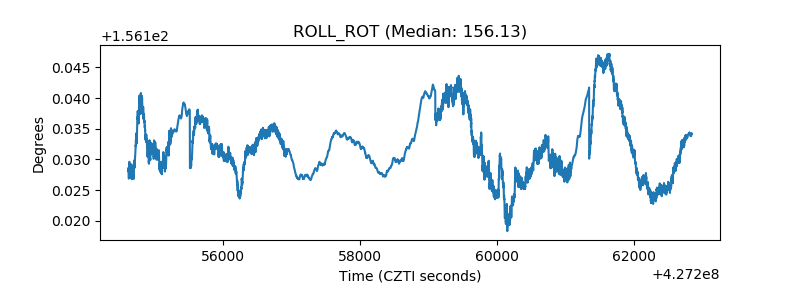 |
| _Roll_DEC | 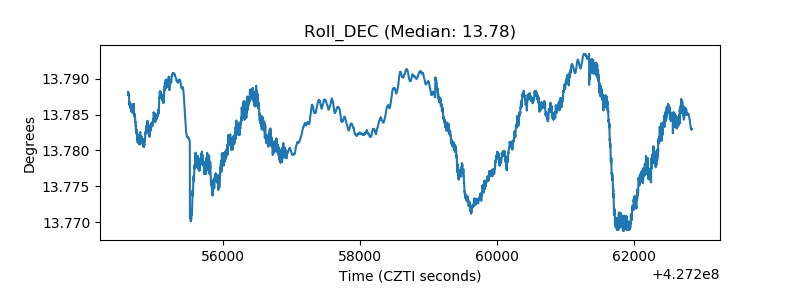 |
| _Roll_RA |  |
| Veto Counter | 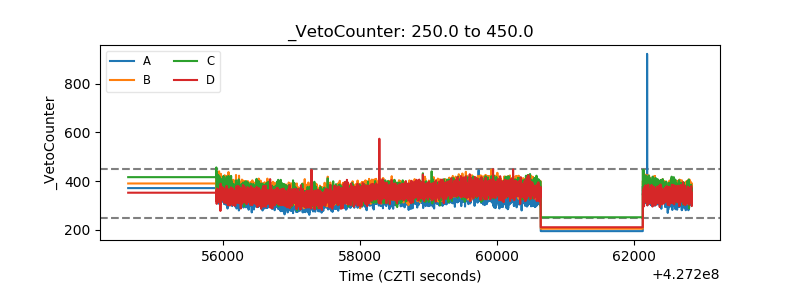 |