| Param | Original file | Final file |
|---|---|---|
| Filename | modeM0/AS1A11_032T04_9000005766_42176cztM0_level2.fits | modeM0/AS1A11_032T04_9000005766_42176cztM0_level2_quad_clean.evt |
| Size (bytes) | 381,369,600 | 108,403,200 |
| Size | 363.7 MB | 103.4 MB |
| Events in quadrant A | 3,579,170 | 720,629 |
| Events in quadrant B | 3,090,002 | 743,501 |
| Events in quadrant C | 3,116,593 | 704,833 |
| Events in quadrant D | 3,807,799 | 644,591 |
| Mode M0 | |||
|---|---|---|---|
| Quadrant | BADHDUFLAG | Total packets | Discarded packets |
| A | 0 | 14491 | 2 |
| B | 0 | 13882 | 2 |
| C | 0 | 13496 | 2 |
| D | 0 | 16105 | 3 |
| Mode M9 | |||
|---|---|---|---|
| Quadrant | BADHDUFLAG | Total packets | Discarded packets |
| A | 0 | 26 | 0 |
| B | 0 | 26 | 0 |
| C | 0 | 26 | 0 |
| D | 0 | 26 | 0 |
| Mode SS | |||
|---|---|---|---|
| Quadrant | BADHDUFLAG | Total packets | Discarded packets |
| A | 0 | 138 | 0 |
| B | 0 | 138 | 0 |
| C | 0 | 138 | 0 |
| D | 0 | 138 | 0 |
| Quadrant | Total seconds | Saturated seconds | Saturation percentage |
|---|---|---|---|
| A | 6725 | 17 | 0.252788% |
| B | 6725 | 25 | 0.371747% |
| C | 6725 | 2 | 0.029740% |
| D | 6725 | 99 | 1.472119% |
Noise dominated data is calculated using 1-second bins in cleaned event files. If a bin has >2000 counts, and if more than 50% of those come from <1% of pixels, then it is considered to be noise-dominated and hence unusable.
| Quadrant | # 1 sec bins | Bins with >0 counts | Bins with >2000 counts | High rate bins dominated by noise | Noise dominated (total time) | Noise dominated (detector-on time) | Marked lightcurve |
|---|---|---|---|---|---|---|---|
| A | 9321 | 6727 | 3 | 3 | 0.03% | 0.04% | 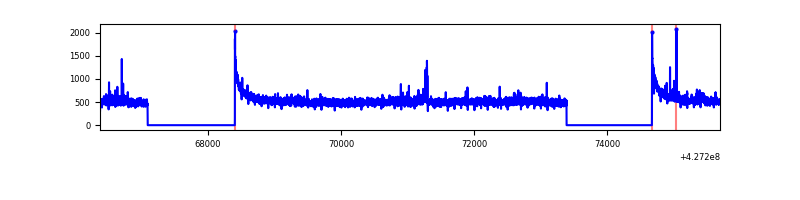 |
| B | 9321 | 6727 | 15 | 15 | 0.16% | 0.22% | 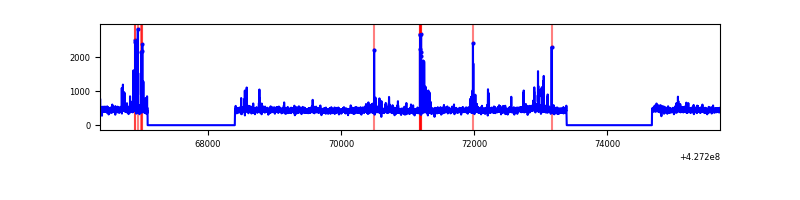 |
| C | 9321 | 6727 | 0 | 0 | 0.00% | 0.00% | 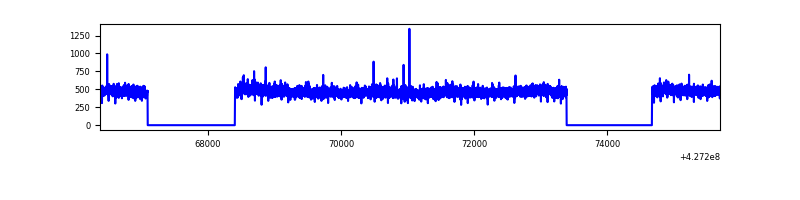 |
| D | 9321 | 6727 | 99 | 99 | 1.06% | 1.47% | 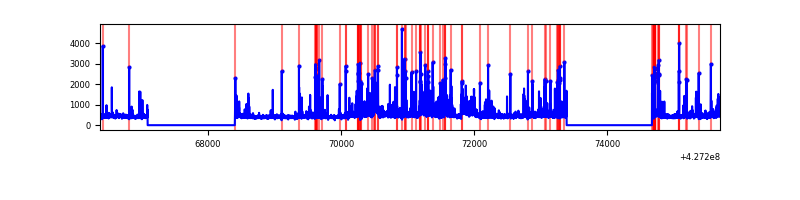 |
Top three noisy pixels from each quadrant. If the there are fewer than three noisy pixels in the level2.evt file, extra rows are filled as -1
| Pixel properties | Quadrant properties | ||||||
|---|---|---|---|---|---|---|---|
| Quadrant | DetID | PixID | Counts | Sigma | Mean | Median | Sigma |
| A | 10 | 83 | 637708 | 4197.16 | 736 | 720 | 151.8 |
| A | 12 | 189 | 32599 | 210.05 | 736 | 720 | 151.8 |
| A | 15 | 223 | 31325 | 201.66 | 736 | 720 | 151.8 |
| B | 5 | 255 | 80457 | 553.35 | 733 | 710 | 144.1 |
| B | 15 | 85 | 40433 | 275.63 | 733 | 710 | 144.1 |
| B | 3 | 112 | 36985 | 251.71 | 733 | 710 | 144.1 |
| C | 15 | 214 | 284507 | 1690.24 | 718 | 724 | 167.9 |
| C | 0 | 207 | 26737 | 154.94 | 718 | 724 | 167.9 |
| C | 12 | 249 | 6714 | 35.68 | 718 | 724 | 167.9 |
| D | 1 | 52 | 452143 | 2542.98 | 716 | 695 | 177.5 |
| D | 12 | 233 | 211869 | 1189.53 | 716 | 695 | 177.5 |
| D | 12 | 6 | 150058 | 841.35 | 716 | 695 | 177.5 |
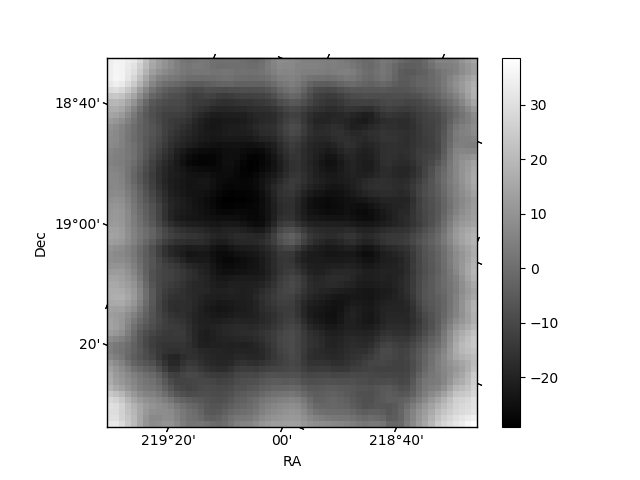
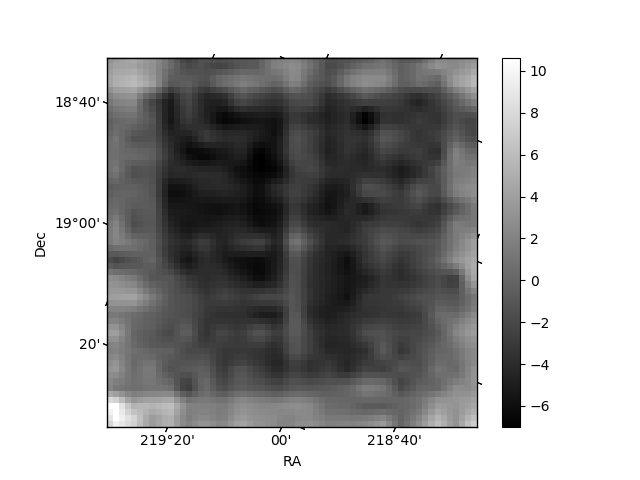
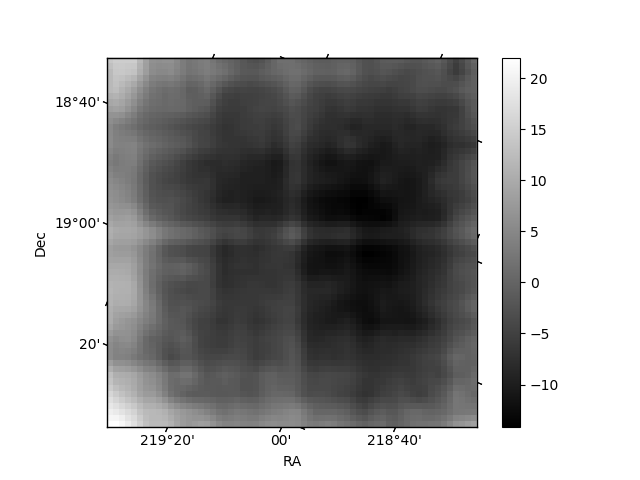
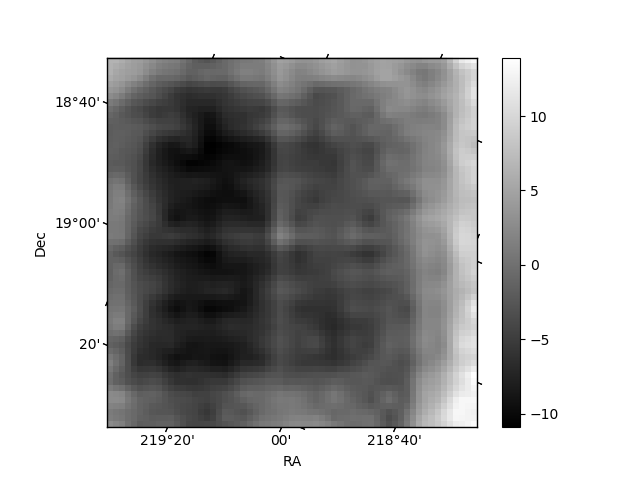
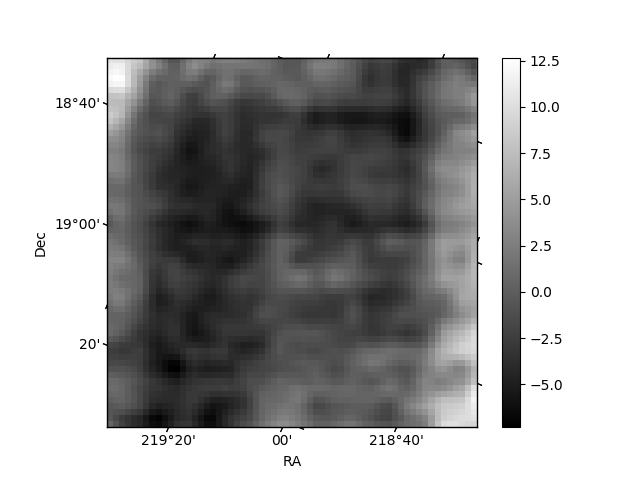
Histogram calculated using DETX and DETY for each event in the final _common_clean file
| Quadrant A | 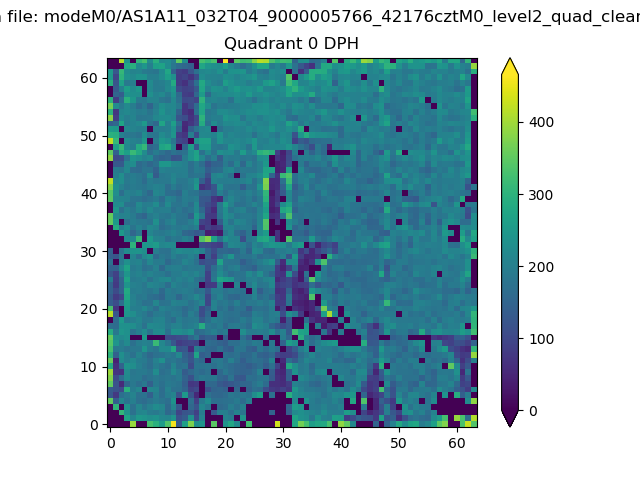 |
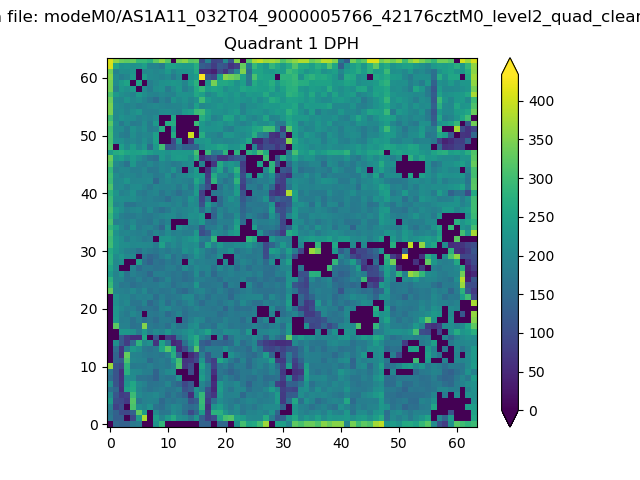 |
Quadrant B |
|---|---|---|---|
| Quadrant D | 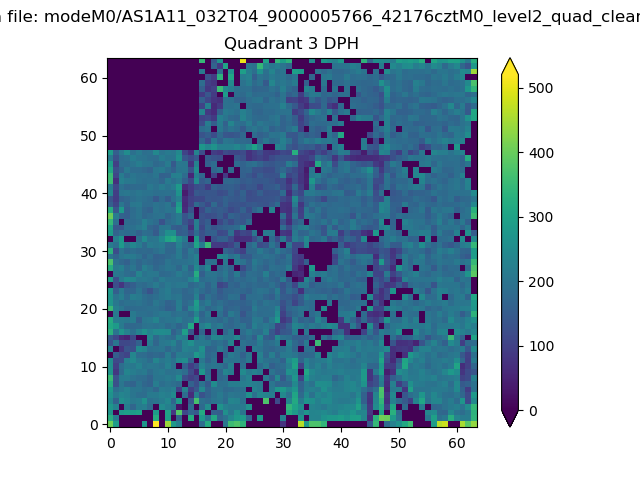 |
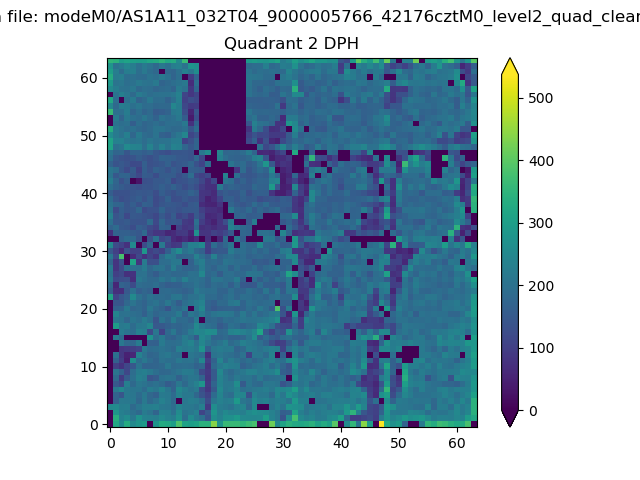 |
Quadrant C |
| Plot type | Count rate plots | Images |
|---|---|---|
| Comparison with Poisson distribution Blue bars denote a histogram of data divided into 1 sec bins. Red curve is a Poisson curve with rate = median count rate of data. |
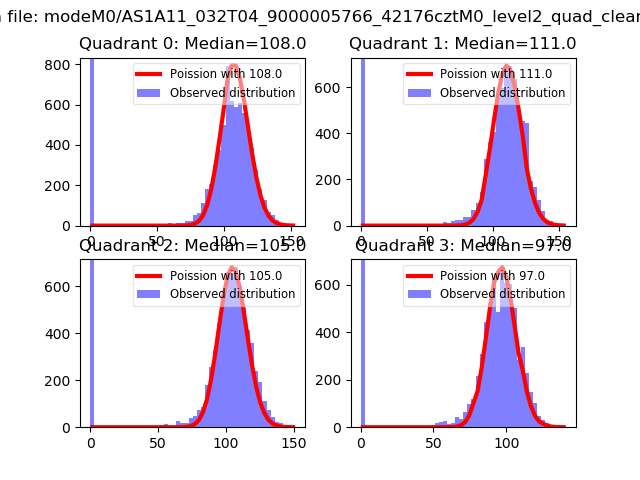 |
 |
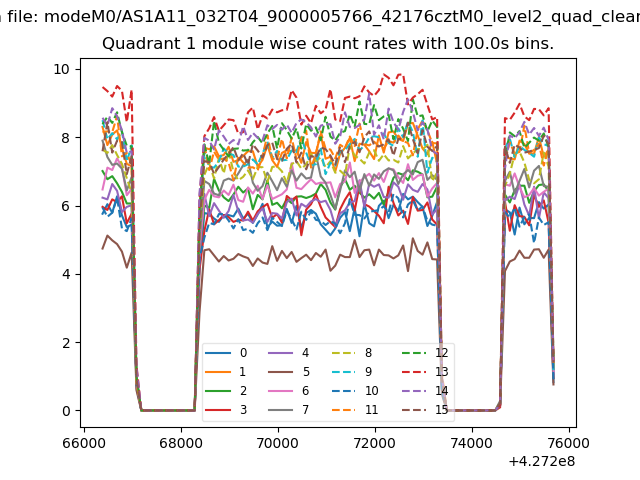
| Quadrant-wise count rates Data is divided into 100 sec bins |
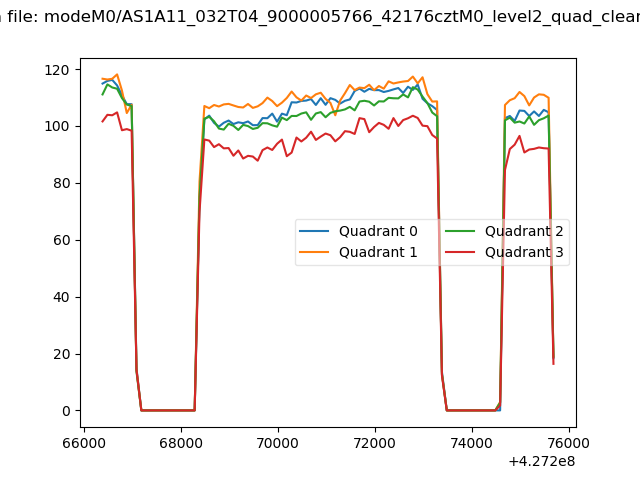 |
|
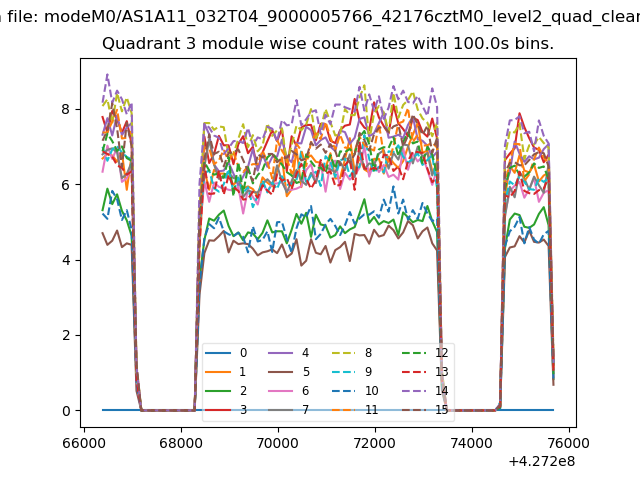
| Module-wise count rates for Quadrant A Data is divided into 100 sec bins |
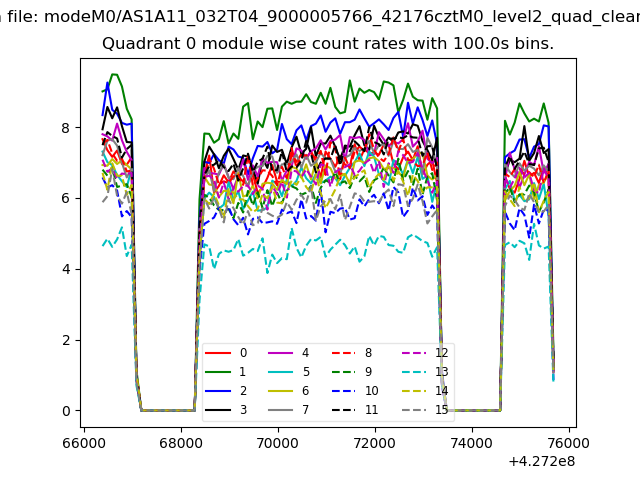 |
 |
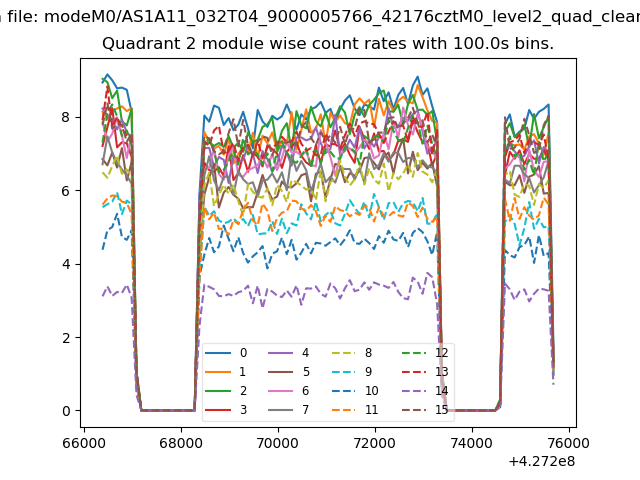
| Module-wise count rates for Quadrant B Data is divided into 100 sec bins |
 |
 |
| Module-wise count rates for Quadrant C Data is divided into 100 sec bins |
 |
 |
| Module-wise count rates for Quadrant D Data is divided into 100 sec bins |
 |
 |
| Parameter | Plot |
|---|---|
| CZT HV Monitor | 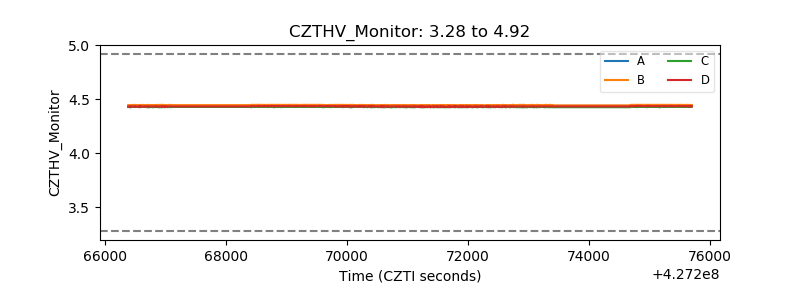 |
| D_VDD | 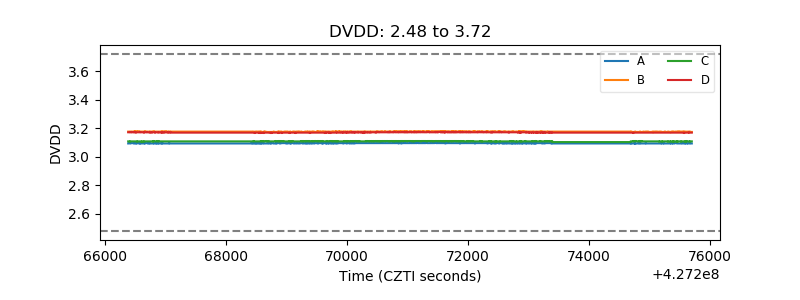 |
| Temperature 1 | 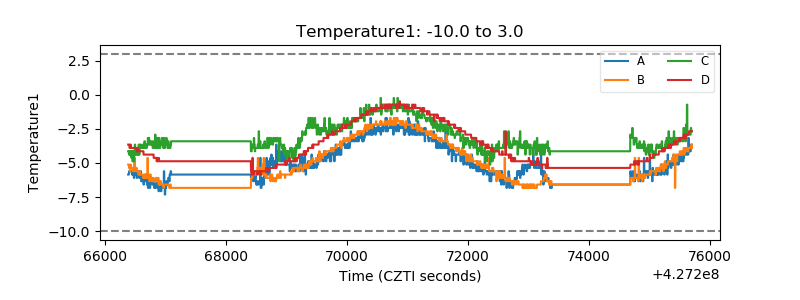 |
| Veto HV Monitor | 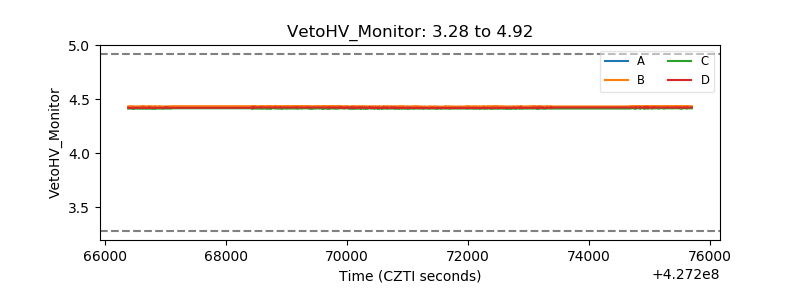 |
| Veto LLD | 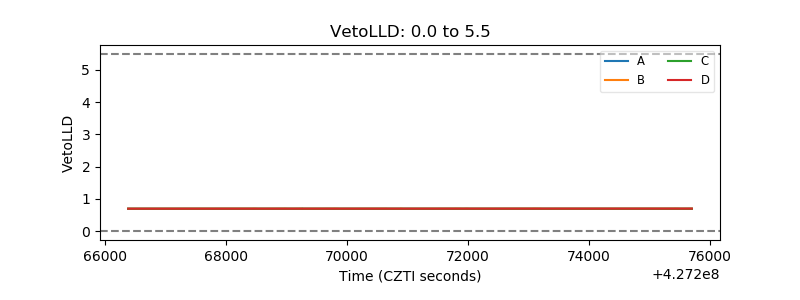 |
| Alpha Counter | 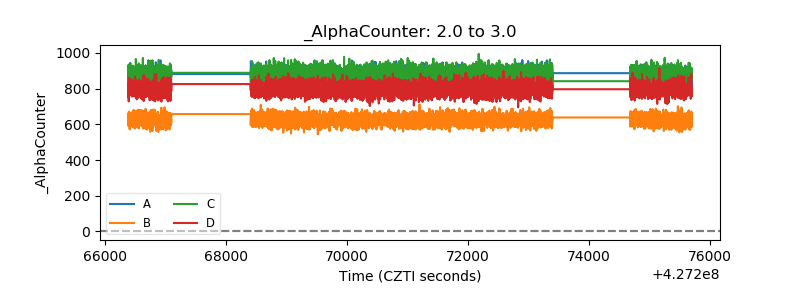 |
| _CPM_Rate | 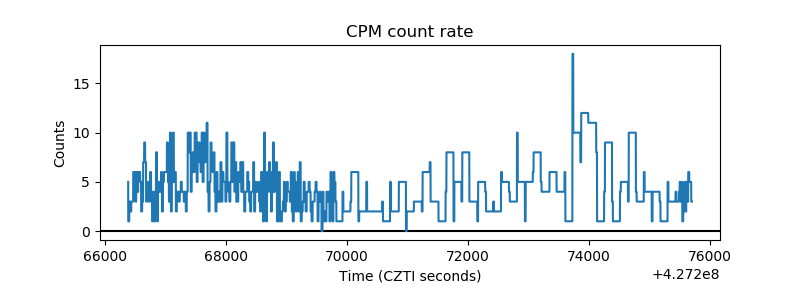 |
| CZT Counter | 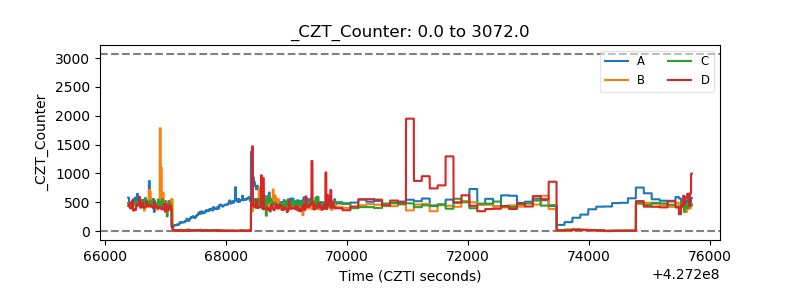 |
| +2.5 Volts monitor | 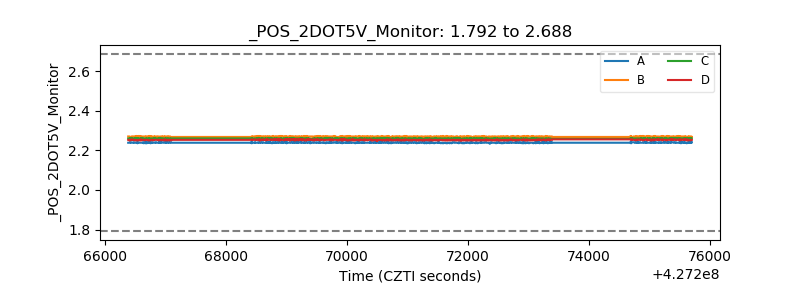 |
| +5 Volts monitor | 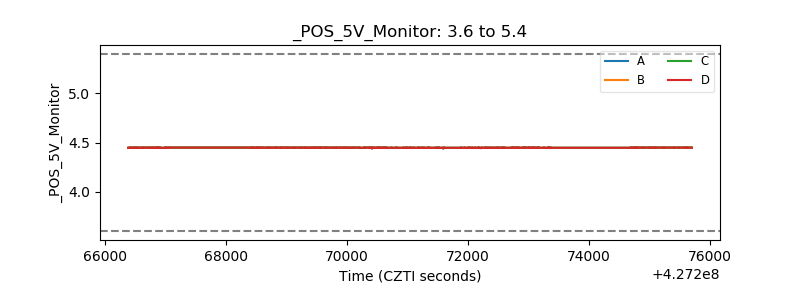 |
| _ROLL_ROT | 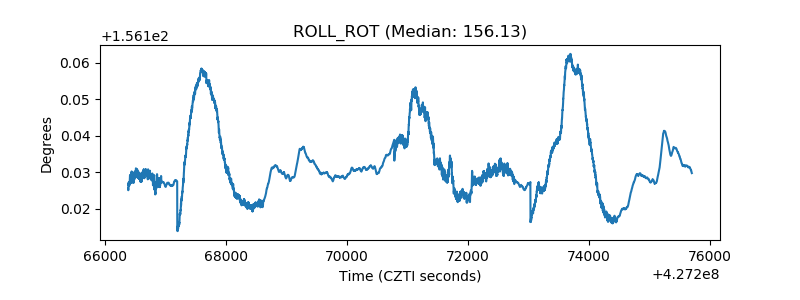 |
| _Roll_DEC | 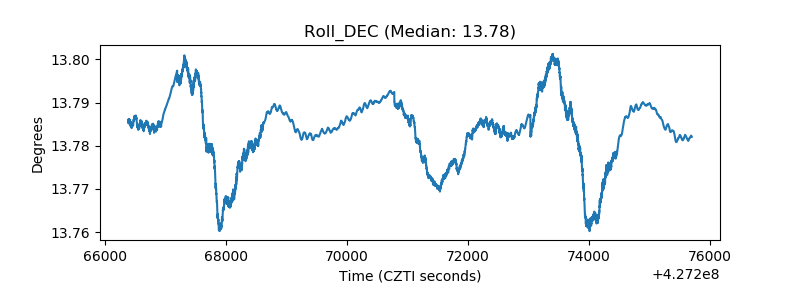 |
| _Roll_RA | 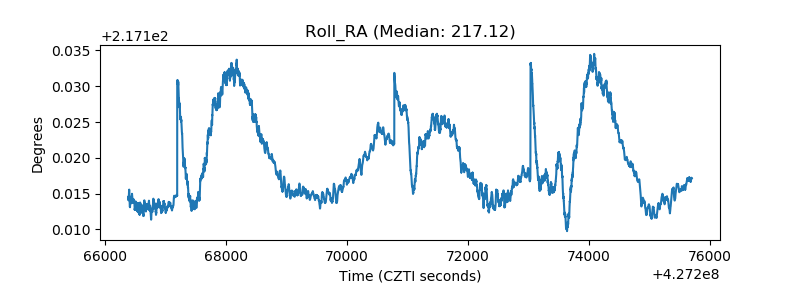 |
| Veto Counter | 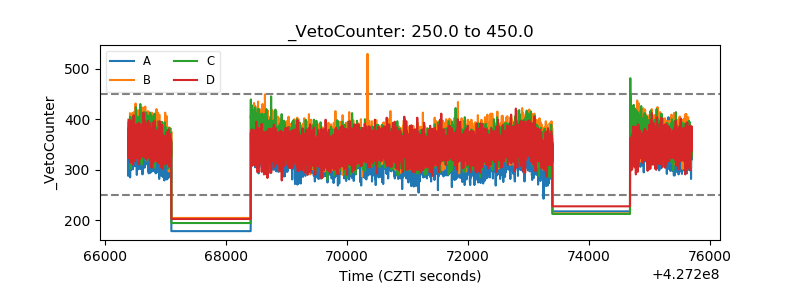 |