| Param | Original file | Final file |
|---|---|---|
| Filename | modeM0/AS1A11_032T04_9000005766_42178cztM0_level2.fits | modeM0/AS1A11_032T04_9000005766_42178cztM0_level2_quad_clean.evt |
| Size (bytes) | 656,593,920 | 176,489,280 |
| Size | 626.2 MB | 168.3 MB |
| Events in quadrant A | 6,115,531 | 1,172,335 |
| Events in quadrant B | 5,213,943 | 1,208,639 |
| Events in quadrant C | 5,102,526 | 1,153,258 |
| Events in quadrant D | 7,018,518 | 1,047,587 |
| Mode M0 | |||
|---|---|---|---|
| Quadrant | BADHDUFLAG | Total packets | Discarded packets |
| A | 0 | 24634 | 3 |
| B | 0 | 23077 | 3 |
| C | 0 | 22221 | 3 |
| D | 0 | 28502 | 3 |
| Mode M9 | |||
|---|---|---|---|
| Quadrant | BADHDUFLAG | Total packets | Discarded packets |
| A | 0 | 42 | 0 |
| B | 0 | 42 | 0 |
| C | 0 | 42 | 0 |
| D | 0 | 42 | 0 |
| Mode SS | |||
|---|---|---|---|
| Quadrant | BADHDUFLAG | Total packets | Discarded packets |
| A | 0 | 224 | 0 |
| B | 0 | 224 | 0 |
| C | 0 | 224 | 0 |
| D | 0 | 224 | 0 |
| Quadrant | Total seconds | Saturated seconds | Saturation percentage |
|---|---|---|---|
| A | 11013 | 135 | 1.225824% |
| B | 11013 | 44 | 0.399528% |
| C | 11014 | 6 | 0.054476% |
| D | 11014 | 315 | 2.859996% |
Noise dominated data is calculated using 1-second bins in cleaned event files. If a bin has >2000 counts, and if more than 50% of those come from <1% of pixels, then it is considered to be noise-dominated and hence unusable.
| Quadrant | # 1 sec bins | Bins with >0 counts | Bins with >2000 counts | High rate bins dominated by noise | Noise dominated (total time) | Noise dominated (detector-on time) | Marked lightcurve |
|---|---|---|---|---|---|---|---|
| A | 15134 | 11016 | 107 | 107 | 0.71% | 0.97% | 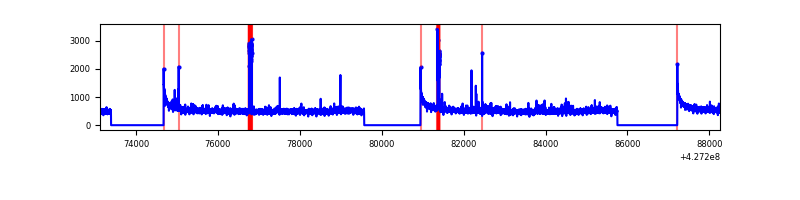 |
| B | 15134 | 11016 | 28 | 28 | 0.19% | 0.25% | 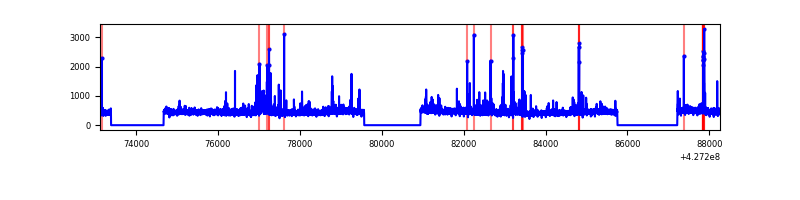 |
| C | 15135 | 11017 | 1 | 1 | 0.01% | 0.01% | 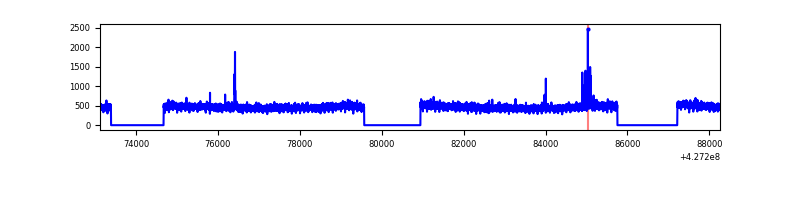 |
| D | 15135 | 11017 | 316 | 316 | 2.09% | 2.87% | 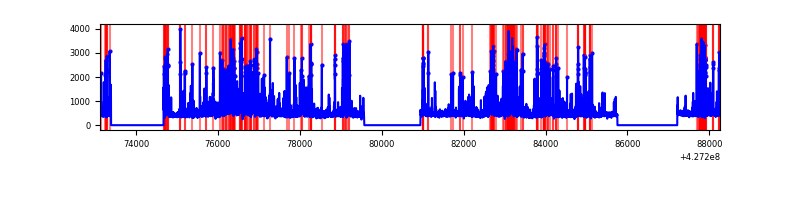 |
Top three noisy pixels from each quadrant. If the there are fewer than three noisy pixels in the level2.evt file, extra rows are filled as -1
| Pixel properties | Quadrant properties | ||||||
|---|---|---|---|---|---|---|---|
| Quadrant | DetID | PixID | Counts | Sigma | Mean | Median | Sigma |
| A | 10 | 83 | 1021077 | 4140.06 | 1203 | 1180 | 246.3 |
| A | 15 | 222 | 172873 | 696.95 | 1203 | 1180 | 246.3 |
| A | 12 | 189 | 130283 | 524.07 | 1203 | 1180 | 246.3 |
| B | 0 | 229 | 187969 | 796.41 | 1197 | 1163 | 234.6 |
| B | 3 | 112 | 142376 | 602.03 | 1197 | 1163 | 234.6 |
| B | 5 | 255 | 125602 | 530.52 | 1197 | 1163 | 234.6 |
| C | 15 | 214 | 458467 | 1659.72 | 1177 | 1184 | 275.5 |
| C | 12 | 249 | 33173 | 116.11 | 1177 | 1184 | 275.5 |
| C | 7 | 220 | 25236 | 87.3 | 1177 | 1184 | 275.5 |
| D | 1 | 52 | 925280 | 3243.29 | 1167 | 1133 | 284.9 |
| D | 12 | 233 | 491559 | 1721.15 | 1167 | 1133 | 284.9 |
| D | 12 | 6 | 262381 | 916.85 | 1167 | 1133 | 284.9 |
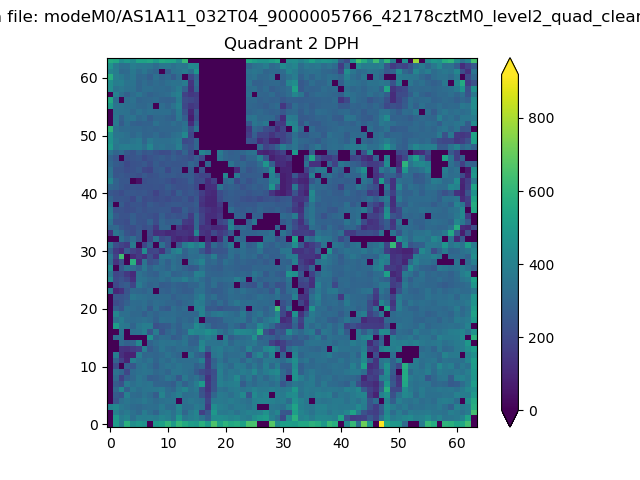
Histogram calculated using DETX and DETY for each event in the final _common_clean file
| Quadrant A | 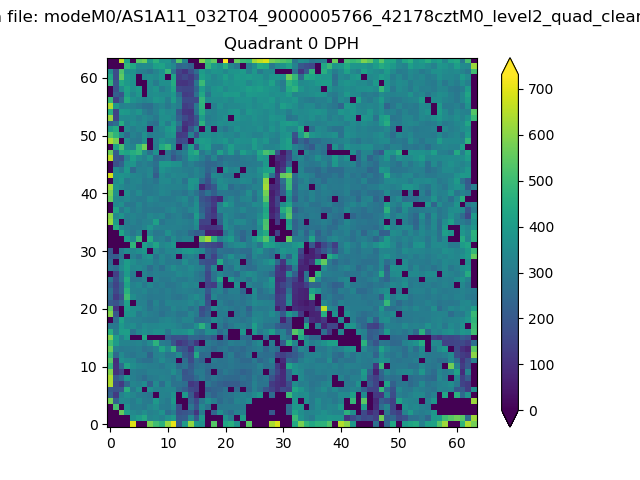 |
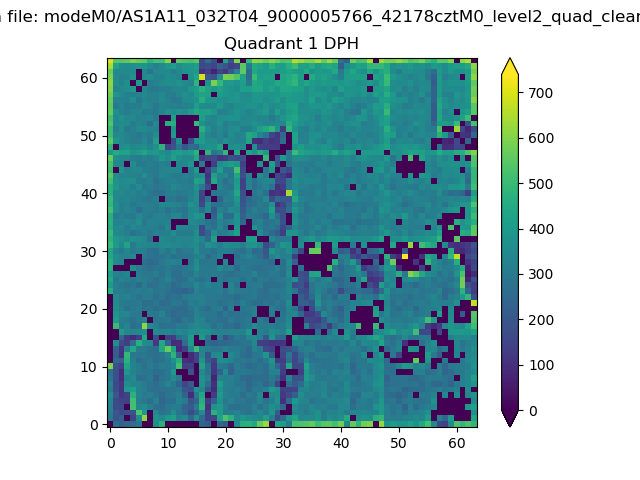 |
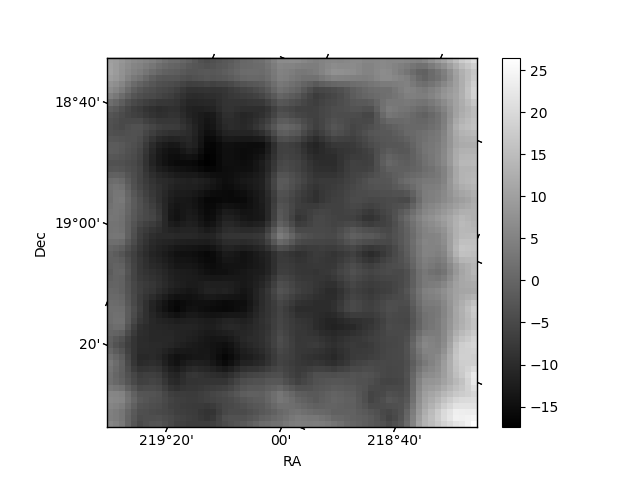
Quadrant B |
|---|---|---|---|
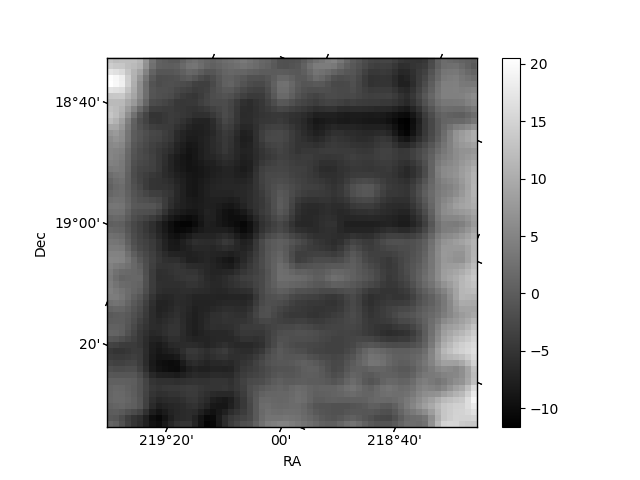
| Quadrant D | 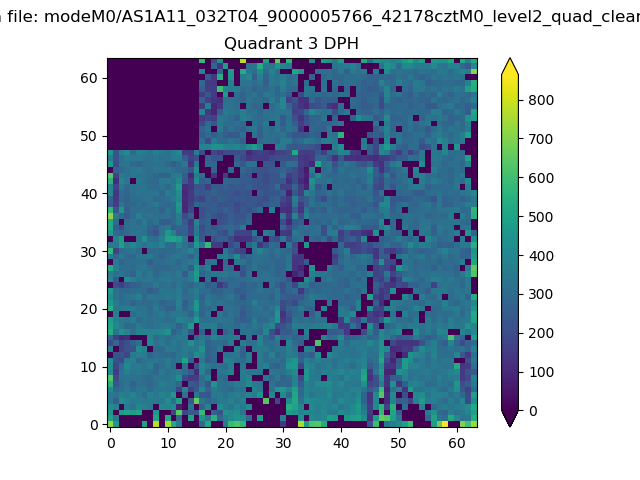 |
 |
Quadrant C |
| Plot type | Count rate plots | Images |
|---|---|---|
| Comparison with Poisson distribution Blue bars denote a histogram of data divided into 1 sec bins. Red curve is a Poisson curve with rate = median count rate of data. |
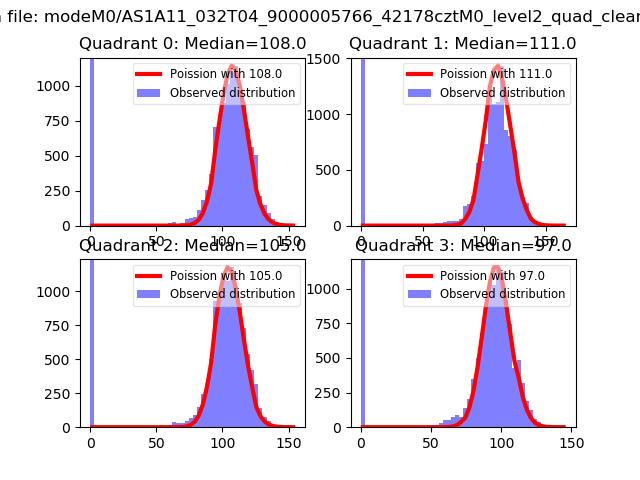 |
 |
| Quadrant-wise count rates Data is divided into 100 sec bins |
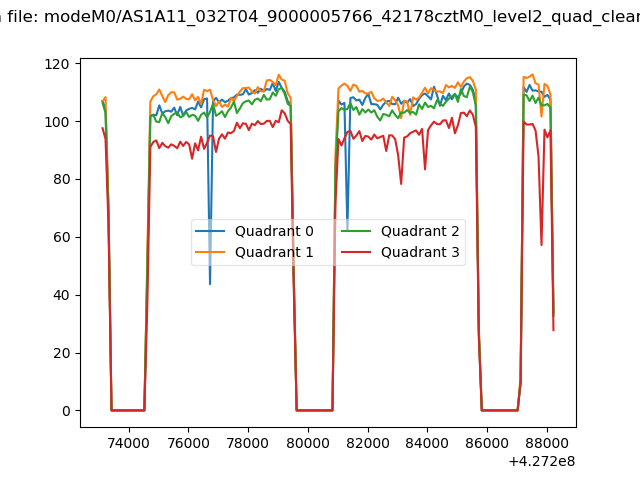 |
|
| Module-wise count rates for Quadrant A Data is divided into 100 sec bins |
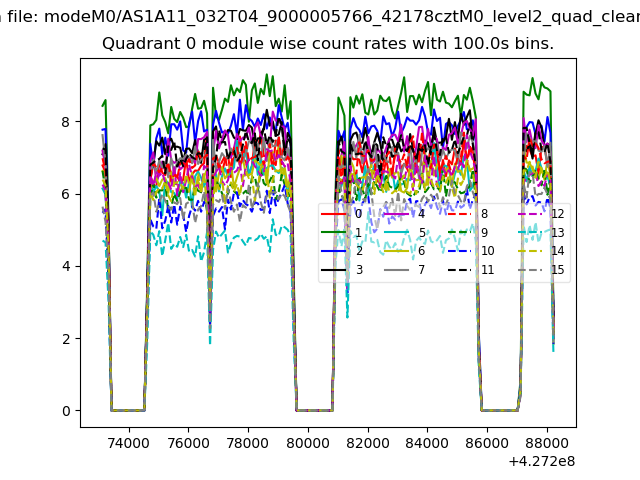 |
 |
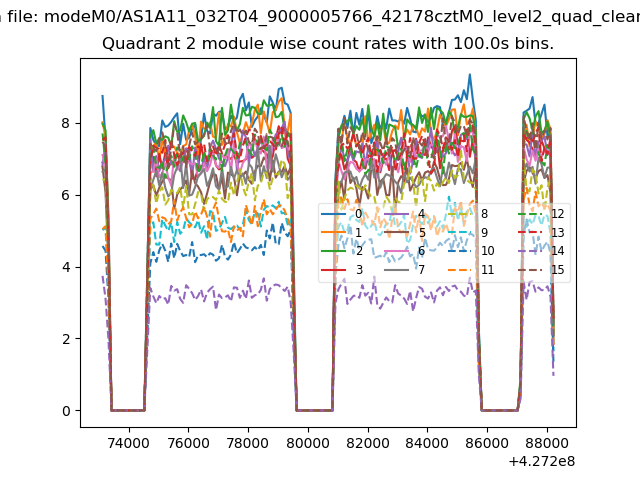
| Module-wise count rates for Quadrant B Data is divided into 100 sec bins |
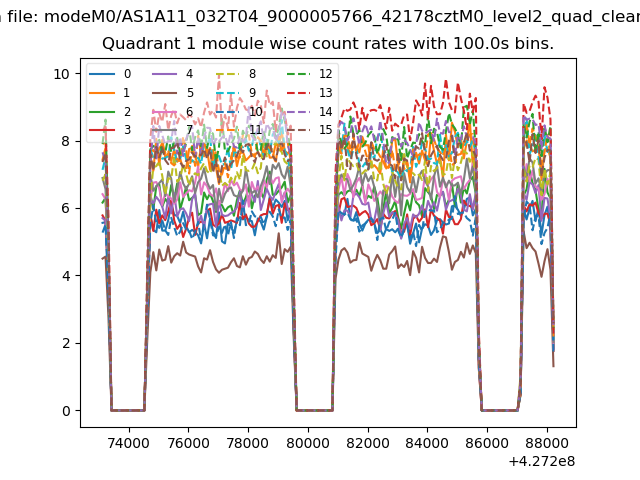 |
 |
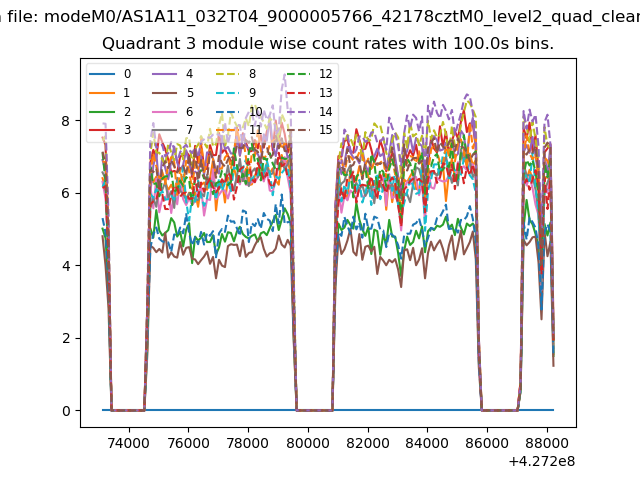
| Module-wise count rates for Quadrant C Data is divided into 100 sec bins |
 |
 |
| Module-wise count rates for Quadrant D Data is divided into 100 sec bins |
 |
 |
| Parameter | Plot |
|---|---|
| CZT HV Monitor | 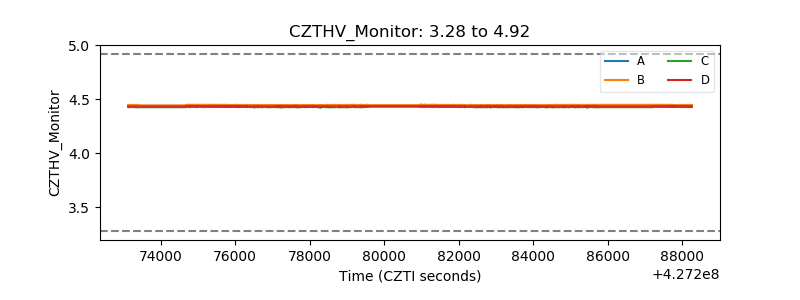 |
| D_VDD | 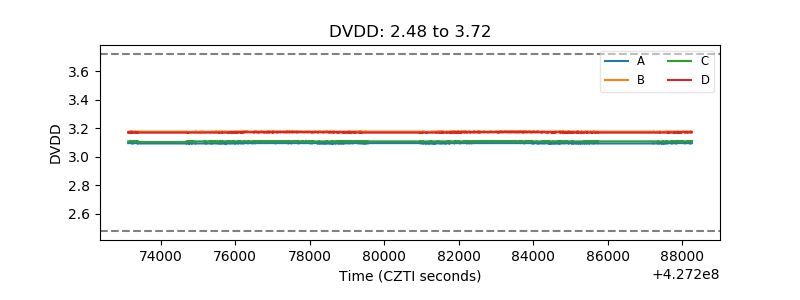 |
| Temperature 1 | 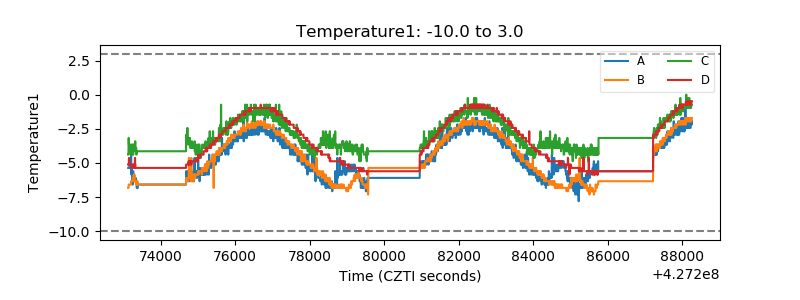 |
| Veto HV Monitor | 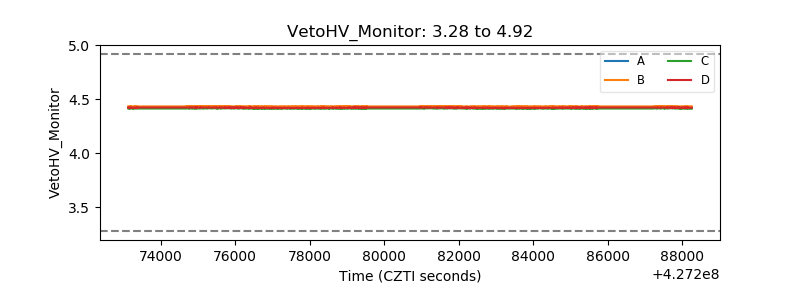 |
| Veto LLD | 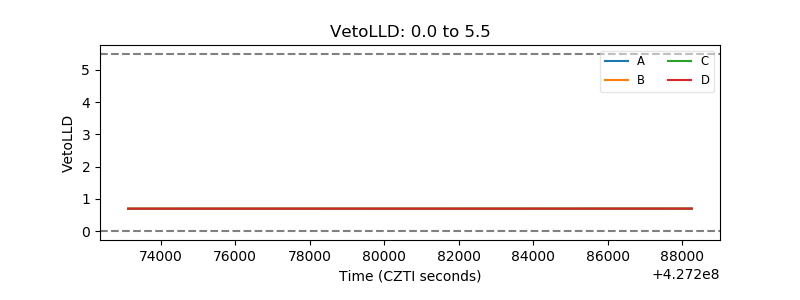 |
| Alpha Counter | 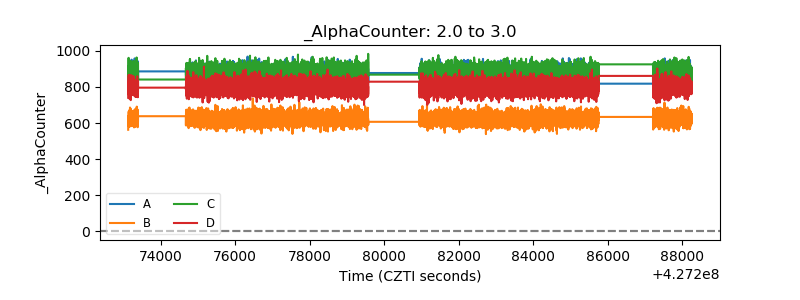 |
| _CPM_Rate | 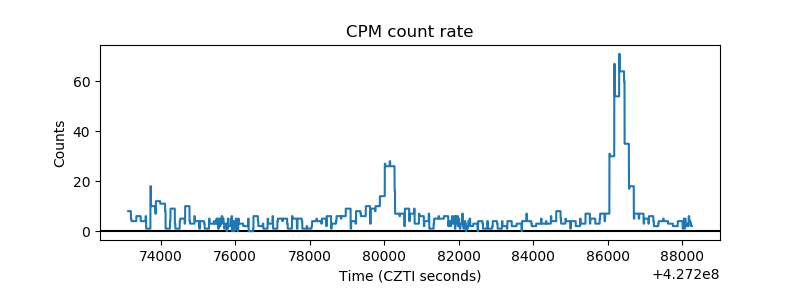 |
| CZT Counter |  |
| +2.5 Volts monitor | 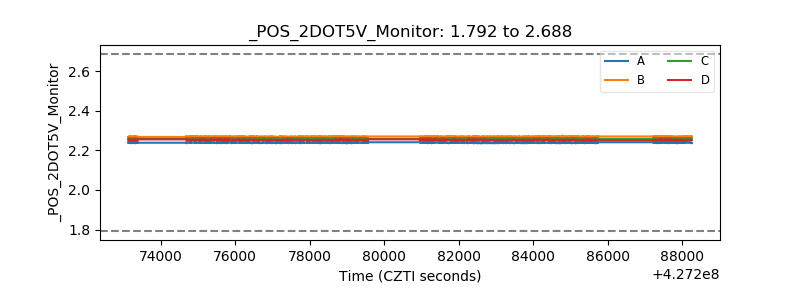 |
| +5 Volts monitor | 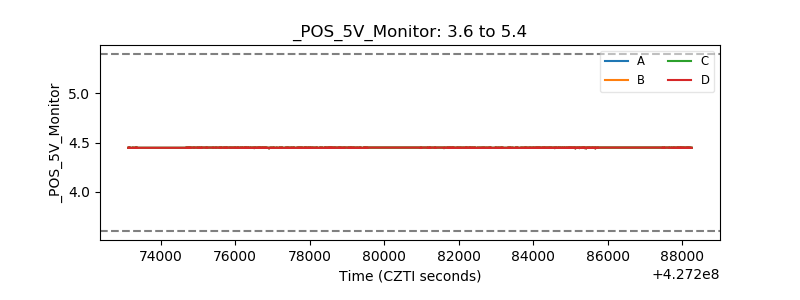 |
| _ROLL_ROT | 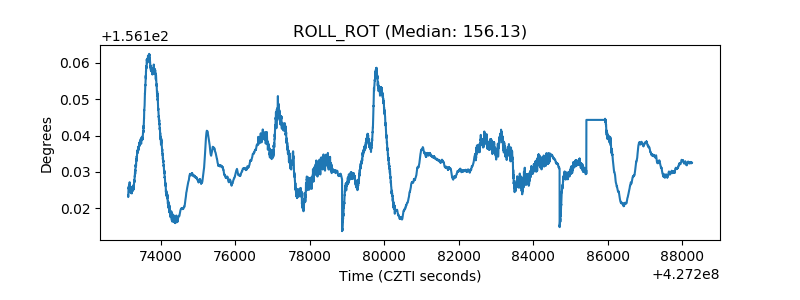 |
| _Roll_DEC | 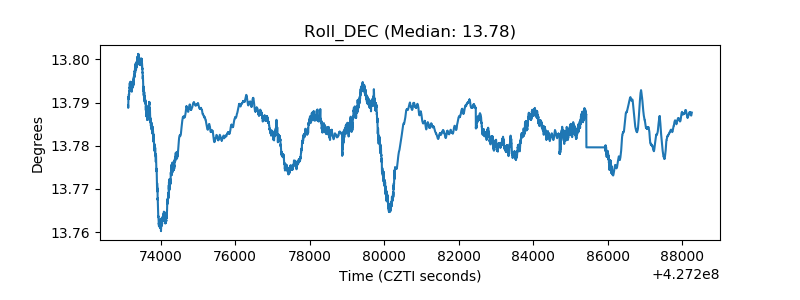 |
| _Roll_RA |  |
| Veto Counter | 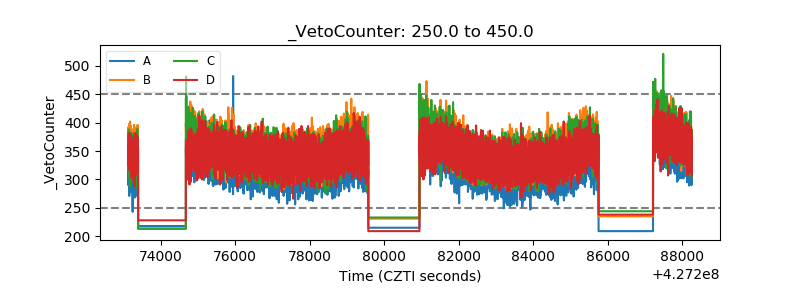 |